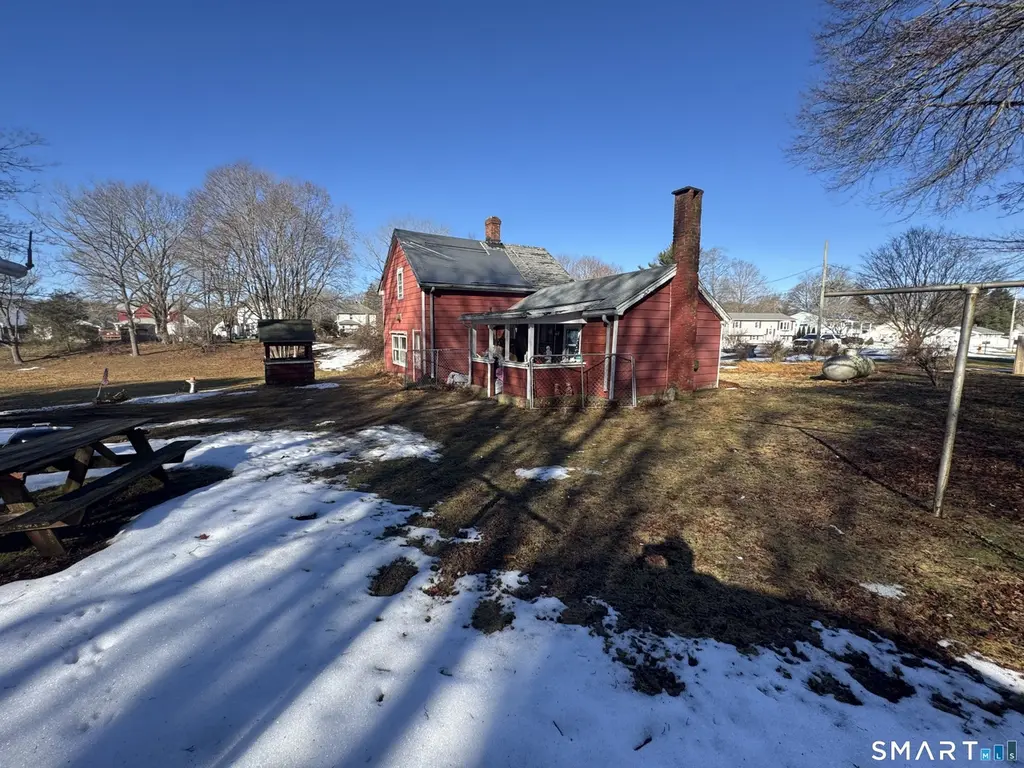
36 Sandy Hollow Dr · Waterford, CT
Flood risk No data
- FEMA flood zone
- —
- Chance of flooding over 30 yrs
- —
- Est. flood insurance / yr
- —
Fire risk No data
- Est. fire insurance / yr
- —
Heat risk No data
- Hot days now (above threshold)
- —
- Hot days in 30 yrs
- —
Wind risk No data
- Chance of severe wind over 30 yrs
- —
Air-quality risk No data
- Unhealthy air days now
- —
- Unhealthy air days in 30 yrs
- —
Risk factors via First Street. Map © Google.
Why this score? — see what drove the B- grade
The composite is a weighted blend of 9 inputs, each scored 0–100. Each bar is that input's sub-score; the figure is the points it added to the 100-point composite (weight × sub-score).
- Cash flow +27.5/30.0
- DSCR +9.7/10.0
- 1% rule +7.7/10.0
- ARV discount +7.5/15.0
- Schools +4.6/10.0
- Livability +3.8/5.0
- Rent growth +2.5/5.0
- Condition / age +2.5/5.0
- Appreciation +0.0/10.0
$159,000
🖨 Deal sheet 📄 Offer letter ✓ Due diligence
Listing remarks MLS
Tucked away at the end of a quiet cul-de-sac, this Circa 1810 home is perfect for an investor or owner who can DIY and revitalize the property. Demo and rebuild is also an option for this fabulous plot of land. Bring your vision to transform this historic home into a modern residence. Located in close proximity to town center, Electric Boat, Pfizer, Casinos, Etc.
Key facts
- Cul-de-sac
- Historic home
- 0.66 acre lot
Tags
Neighborhood map
What this means for you Summary
Snapshot
- This is a 2-bed/1.0-bath single-family listed at $159k.
Deal economics
- At list price, monthly cash flow is $471 ($6k/yr) — positive.
- The deal already cash-flows at list — no discount required.
- Meets the 1% rule at list price ($2k rent vs $159k).
- Recommended offer: $145k (9.0% below list) — sets the bar for market timing.
- Cap rate 9.9% vs local median 3.1% in Waterford — top-decile yield for the area; either an underpriced asset or a hidden risk that comps aren't pricing in. Stress-test before assuming the spread holds.
Location & tenants
- Location reads 76/100 on livability (#50 in CT, #3,268 nationally) — a middle-class / working-renter tenant base. Strengths: crime A+, housing A+, health & safety A+; Watch: amenities F, commute F.
- Waterford School District (suburban): math 45% / reading 58% proficiency, ranked #75 of 153 in CT (top 49%) — acceptable for families but not a draw, mixed tenant base, ~2y average lease; only 14% free/reduced lunch — higher-income household profile.
- Market conditions: 70 active listings in the ZIP; 4 comparable units currently listed for rent nearby; rentals lingering (median 44d on market — plan ~5-8 weeks vacancy on turnover, expect pricing pressure); 50% of comp listings sitting > 30 days — soft ceiling on asking rent; solid renter incomes; 487 units permitted in Southeastern Connecticut Planning Region in 2024 (244 in 5+ unit buildings).
Forward outlook
- Local home prices are declining (-3.0%/yr); year-one equity from $1k of loan paydown is wiped out by about $5k of value loss. Plan a longer hold.
- At projected returns (-3.0% appreciation + 3.0% rent growth), your $45k cash investment doubles in ~9 years — after that, you're playing with house money.
Negotiation context
- It's been on market 91 days — a 9% lower offer ($145k) is reasonable based on typical stale-listing flexibility.
- 2 sale attempts with the ask held roughly flat each time — persistent listings suggest the price (not the market) is what's stuck; bring a comps-based counter.
Risks & watch-outs
- Watch-outs: built in 1810 — expect roof / HVAC / electrical / plumbing capex.
Questions for the listing agent
- It's been on market 91 days. Have you received any prior offers? Is the seller open to a 9% concession, seller financing, or rate buy-down credit?
- Built in 1810 — when were the roof, HVAC, electrical panel, plumbing, and water heater last replaced?
- Why hasn't it sold? Are there any deal-killer items the seller is aware of (foundation, flood, title, zoning, code violations)?
- Is there a deadline driving the sale (1031 exchange, divorce, estate, relocation)? That informs how much negotiation room exists.
- Schools are B-rated — typically a magnet for longer-tenancy family renters. What's the average tenant stay here, and is there a school-zone premium baked into asking?
- What's the average days-on-market for RENTAL listings here right now (not sales)? A rising rental-DOM trend means longer vacancies and softer asking-rent achievability than the comps imply.
- What's the recent tenant-quality profile in this submarket — average credit score on applications, eviction rate, late-payment / NSF rate, and stable-employment percentage? A property-management company in the area should have these aggregated.
- How much new for-sale + rental construction is in the pipeline within 1–3 miles? Heavy new supply typically softens prices + rents 12–24 months out; constrained supply supports both.
Investment metrics
- 1% rule
- 1.27% ✓
- Cap rate
- 9.85%
- Cash-on-cash
- 12.71%
- DSCR
- 1.57
- GRM
- 6.6
CMA / ARV
- ARV (median comp)
- $330,246
- List price
- $159,000
- Delta
- -51.85%
- Verdict
- UNDERPRICED
- Comps
- 20 within 1.0 mi
Show comp detail 12 sales within ~0.75 mi
| Address | Dist | Beds/Ba | Sqft | Sold | Price | $/sf | Match |
|---|---|---|---|---|---|---|---|
| 22 Woodlawn Ave | 0.13mi | 3/1.0 (+1) | 962 (+6%) | 3mo | $325,000 | $338 | 77 |
| 4 Edgewood Ave | 0.17mi | 2/1.0 | 912 (+0%) | 19mo | $315,000 | $345 | 75 |
| 3 Cedar St | 0.22mi | 2/1.0 | 816 (-10%) | 1mo | $375,000 | $460 | 72 |
| 18 Mackenzie Rd | 0.32mi | 2/1.5 | 858 (-6%) | 5mo | $346,500 | $404 | 70 |
| 20 Avery Ln | 0.48mi | 2/2.0 | 929 (+2%) | 9mo | $365,000 | $393 | 63 |
| 39 Mackenzie Rd | 0.22mi | 3/1.0 (+1) | 858 (-6%) | 15mo | $301,500 | $351 | 62 |
| 7 Robin St | 0.30mi | 3/1.0 (+1) | 988 (+9%) | 7mo | $328,000 | $332 | 61 |
| 5 Thrush St | 0.27mi | 3/1.5 (+1) | 988 (+9%) | 9mo | $321,000 | $325 | 59 |
| 4 Hamel Ct | 0.18mi | 2/1.0 | 1,040 (+14%) | 16mo | $296,000 | $285 | 55 |
| 270 Boston Post Rd #22 | 0.40mi | 2/1.0 | 784 (-14%) | 4mo | $114,900 | $147 | 55 |
| 73 North Rd | 0.55mi | 2/1.0 | 1,036 (+14%) | 10mo | $365,000 | $352 | 42 |
| 270 Boston Post Rd Trlr 20 | 0.40mi | 2/1.5 | 784 (-14%) | 17mo | $70,000 | $89 | 42 |
Match score weights: distance 35% · size 25% · config 20% · recency 20%. Top-matched comps best support the ARV.
Projected returns pro-forma
-3.0% appreciation · 3.0% rent growth · sell at horizon
- IRR
- 2.5%
- Equity multiple
- 1.10×
- Total profit
- $4,305
- Equity at exit
- $23,707
- IRR
- 12.1%
- Equity multiple
- 1.96×
- Total profit
- $42,588
- Equity at exit
- $13,747
Cash invested: $44,520 (down + closing). Projections, not guarantees.
Landlord ↔ Tenant lean methodology
- Overall (STATE)
- 27 Tenant-Leaning
- State Connecticut
- 27 Tenant-Leaning · D+7
- County
- — inherits STATE
- City
- — inherits STATE
ZIP-level market 06385
- Active inventory
- 70
- Price-to-rent
- 6.6×
Monthly cashflow live
- Estimated rent
- $2,013 medium interval (Pro) →
- Mortgage (P&I)
- −$834
- Tax from tax record
- −$219 /mo · $2,629/yr
- Insurance
- −$66
- HOA
- −$0
- Vacancy / Maint / Mgmt
- −$423
- Net cashflow
- $471
Break-even live
UW: 25.0% down · 7.5% · 30yr · 1.5% tax · 5.0% vac · 8.0% maint · 8.0% mgmt
Financing live
Cash to close
- Down payment
- $39,750
- Closing costs
- $4,770
- Reserves months
- —
- Total cash needed
- —
Loan-product check · same deal, 3 products live
Conventional
25% down · 7.5% · 30yr
- Down + closing
- —
- Monthly P&I
- —
- Monthly cashflow
- —
- DSCR
- —
- Eligible?
- —
Personal DTI + credit; lowest rate.
DSCR
20% down · 8.5% · 30yr
- Down + closing
- —
- Monthly P&I
- —
- Monthly cashflow
- —
- DSCR
- —
- Eligible?
- —
No personal income docs; deal must DSCR.
Hard money
10% down · 12.0% · 12mo
- Down + closing
- —
- Monthly P&I
- —
- Monthly cashflow
- —
- DSCR
- —
- Eligible?
- —
Short-term bridge; refi at stabilization.
Rent comps 4 comps
| Address | Beds | Baths | Sqft | Rent | $/sqft | DOM | Units | Dist |
|---|---|---|---|---|---|---|---|---|
| 302 Boston Post Rd Unit 21 Waterford, CT | 1.0 | 1.0 | 900 | $1,550 | $1.72 | 43d | 1 | 0.57mi |
| 11 Anthony Rd New London, CT | 1.0–3.0 | 1.0–2.0 | 838 | $1,832 | $2.19 | 13d | 3 | 0.92mi |
| 394 Willetts Ave Waterford, CT | 1.0–2.0 | 1.0–2.0 | 963 | $2,725 | $2.83 | 43d | 14 | 1.32mi |
| 394 Willetts Ave Waterford, CT | 1.0–2.0 | 1.0–2.0 | 963 | $2,725 | $2.83 | 20d | 7 | 1.32mi |
Listing history 13 events
-
2026-06-10days on market $159,000 Active 91 DOM
-
2026-06-09days on market $159,000 Active 90 DOM
-
2026-06-08days on market $159,000 Active 89 DOM
-
2026-06-07days on market $159,000 Active 88 DOM
-
2026-06-05days on market $159,000 Active 85 DOM
-
2026-06-03days on market $159,000 Active 84 DOM
-
2026-06-02days on market $159,000 Active 83 DOM
-
2026-06-01days on market $159,000 Active 82 DOM
-
2026-05-31days on market $159,000 Active 81 DOM
-
2026-05-30days on market $159,000 Active 80 DOM
-
2026-05-04status Active 365-char remark
Show marketing remark (365 chars)
Tucked away at the end of a quiet cul-de-sac, this Circa 1810 home is perfect for an investor or owner who can DIY and revitalize the property. Demo and rebuild is also an option for this fabulous plot of land. Bring your vision to transform this historic home into a modern residence. Located in close proximity to town center, Electric Boat, Pfizer, Casinos, Etc.
-
2026-03-13historical Under Contract - Continue to Show 365-char remark
Show marketing remark (365 chars)
Tucked away at the end of a quiet cul-de-sac, this Circa 1810 home is perfect for an investor or owner who can DIY and revitalize the property. Demo and rebuild is also an option for this fabulous plot of land. Bring your vision to transform this historic home into a modern residence. Located in close proximity to town center, Electric Boat, Pfizer, Casinos, Etc.
-
2026-03-09$159,000 Active 365-char remark
Show marketing remark (365 chars)
Tucked away at the end of a quiet cul-de-sac, this Circa 1810 home is perfect for an investor or owner who can DIY and revitalize the property. Demo and rebuild is also an option for this fabulous plot of land. Bring your vision to transform this historic home into a modern residence. Located in close proximity to town center, Electric Boat, Pfizer, Casinos, Etc.
ⓘ Source: listings_history table (triggers on properties + properties_extension) + one-shot
backfill from property_details.listing_events for pre-trigger history.
Tax reassessment forecast CT · Partial reset (capped growth)
- Current annual tax
- $2,629 · $219/mo
- Projected year-2 tax
- $3,016 · $251/mo
- Expected delta
- +$387/yr (+$32/mo · 14.7%)
ⓘ Screening estimate from a state-policy table — verify with the county assessor before closing.
Nearby sold comps map
Loading sold comps map…
Walkable amenities ~0.75 mi
Loading nearby amenities…
Taxation est. · year 1
- Rental income
- $24,161
- − Mortgage interest
- −$8,906
- − Property taxes
- −$2,629
- − Insurance
- −$795
- − Repairs & maintenance
- −$1,933
- − Management
- −$1,933
- − Depreciation
- −$4,625
- Taxable income
- $3,339
- Est. tax owed @ 24.0%
- −$801
- After-tax cash flow
- $4,856/yr
For passive investors: Depreciation is non-cash, so a rental often shows a tax loss while cash-flowing — sheltering income. Rental losses are passive: they offset passive income freely, and up to $25,000/yr can offset ordinary (W-2) income if you actively participate and your MAGI is under $100k (phasing out to $0 by $150k); unused losses carry forward. On sale, claimed depreciation is recaptured at up to 25%, and gains may owe capital-gains tax (a 1031 exchange can defer both). Figures are a year-1 estimate at your 24.0% rate — not tax advice; consult a CPA.
Schools (NCES district)
- District
- Waterford School District
- NCES district ID
- 0904860
- Math proficiency
- 45% ▼ -18.00%
- Reading proficiency
- 58% ▼ -12.00%
- Median HH income
- $74,686
- Composite
- 46.34/100
- National rank
- #2466
- State rank
- #75 of 153 in CT
Livability — Waterford
- Score
- 76/100
- State rank
- #50
- US rank
- #3268
Category grades
Schools grade is shown separately in the Schools card above.
Census & demographics
- Census place
- Waterford, CT
- County
- New London County · 147,197 people
- City population
- 15,966
- Metro
- Norwich-New London, CT
- Population (ZIP)
- 15,966
- Household income
- $100,484
- Rent vs Own
- Severe rent burden
- 414.0
Population outlook (Southeastern Connecticut County) Hauer SSP2
- By 2040
- 293,442
Race, ethnicity, and origin ACS 2023
- Neighborhood character
- Predominantly White (83%)
- Race & ethnicity
- White 83% Two or more races 6% Hispanic / Latino 6% Asian 5% Black 2%
- Hispanic origin (detail)
- Mexican 1% Puerto Rican 3%
- Common ancestry
- Romanian 6% Lithuanian 5% Iranian 3%
- Foreign-born
- 6% · Canada, China
- Languages at home
- 92% English-only · Other Indo-European 3% Spanish 2% Chinese 1%
Political lean MEDSL · Southeastern Connecticut
- 2024 margin
- D (+13.0) · D 55.6% · R 42.6% · Other 1.8%
- All cycles
- 2024: D+13.0
Not yet ingested
- Civics
- —
Market trends
- HPI YoY
- ▼ -176.84%
- Current HPI
- 191.1743
- Rent YoY
- —
- Metro
- Norwich-New London, CT
- State GDP YoY
- ▲ 1.06%
- F500 in state
- 38
Industry mix (Fortune 500 HQ in CT)
| Industry | F500 HQs | Revenue |
|---|---|---|
| Industrial Machinery | 4 | $38B |
|
||
| Insurance | 3 | $71B |
|
||
| Financial Services | 2 | $25B |
|
||
| Transportation / Logistics | 2 | $18B |
|
||
| Healthcare | 1 | $247B |
|
||
| Telecommunications | 1 | $55B |
|
||
Price history
3 events — show timeline
- 2026-05-04 Relisted — Smart MLS
- 2026-03-13 Contingent — Smart MLS
- 2026-03-09 Listed $159,000 Smart MLS
Property tax history
+1.6%/yrLatest (2023): $2,629 · -7.0% YoY. Source: county tax records.
Cash-flow waterfall
monthlySold comps — $/sqft
last 12 mo · ≤1 miLoading sold comps…