 Duplex
643 E Mcnair Family Dr · Brownsville, TX
Flood risk 1/10 · Minimal
- FEMA flood zone
- X (unshaded)
- Chance of flooding over 30 yrs
- 0.0%
- Est. flood insurance / yr
- $507 – $1,088
Fire risk 1/10 · Minimal
- Est. fire insurance / yr
- $1,222 – $2,270
Heat risk 9/10 · Severe
- Hot days now (above 111°F)
- 7 days/yr
- Hot days in 30 yrs
- 27 days/yr
Wind risk 9/10 · Severe
- Chance of severe wind over 30 yrs
- 99.0%
Air-quality risk 3/10 · Minor
- Unhealthy air days now
- 2 days/yr
- Unhealthy air days in 30 yrs
- 3 days/yr
Risk factors via First Street. Map © Google.
Why this score? — see what drove the D+ grade
The composite is a weighted blend of 9 inputs, each scored 0–100. Each bar is that input's sub-score; the figure is the points it added to the 100-point composite (weight × sub-score).
- Cash flow +16.9/30.0
- ARV discount +7.5/15.0
- DSCR +5.3/10.0
- Appreciation +5.0/10.0
- 1% rule +4.6/10.0
- Livability +4.0/5.0
- Rent growth +2.5/5.0
- Schools +2.2/10.0
- Condition / age +1.0/5.0
$216,000
🖨 Deal sheet 📄 Offer letter ✓ Due diligence
Multi-family units
County records classify this as Multi-Family (2-4 Unit). Listing-text estimate: 2 units. confirmed
Listing remarks MLS
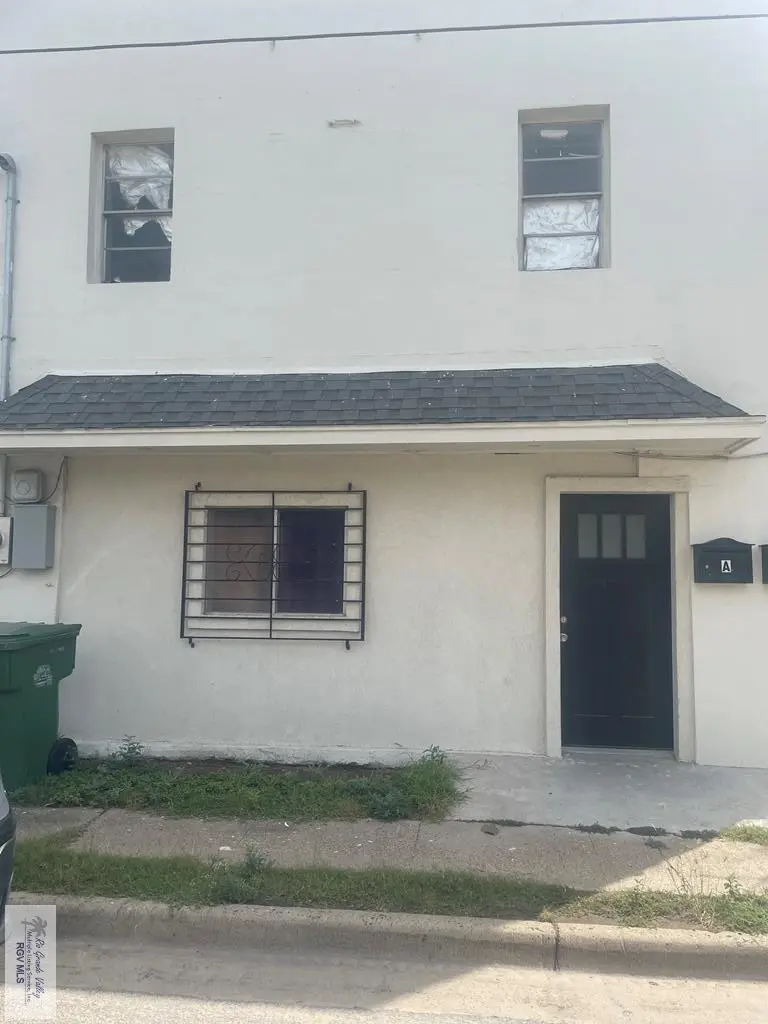
Two Story Duplex and Miutes away from Downtown Historical Brownsville. Building is Cynder Block and Each Unit has two (2) bedrooms , one bath (1). Individual Electrical Meters and One Water Meter.
Key facts
- One water meter
- Two story duplex
- 3,000 sq ft lot
Tags
Neighborhood map
What this means for you Summary
Snapshot
- This is a 2 × 2-bed/1-bath units multifamily listed at $216k. Condition is rated poor.
Deal economics
- At list price, monthly cash flow is $144 ($2k/yr) — positive. Per door: $72/mo.
- The deal already cash-flows at list — no discount required.
- To meet the 1% rule (rent ≥ 1% of price), the offer needs to be $207k (4.1% below list).
- Recommended offer: $190k (12.0% below list) — sets the bar for market timing.
- Cap rate 7.1% vs local median 5.0% in Brownsville — top-decile yield for the area; either an underpriced asset or a hidden risk that comps aren't pricing in. Stress-test before assuming the spread holds.
Location & tenants
- Location reads 79/100 on livability (#62 in TX, #2,311 nationally) — a middle-class / working-renter tenant base. Strengths: commute A+, cost of living A+, housing A+; Watch: schools C-, amenities D, crime D-.
- Brownsville ISD (urban): math 20% / reading 34% proficiency, ranked #710 of 826 in TX (top 86%) — low school quality limits family demand, transient renter base, plan for 1-2y turnover; 83% free/reduced lunch — lower-income household profile, screen leases tightly.
- Market conditions: 13 active listings in the ZIP; 7 comparable units currently listed for rent nearby; rentals at typical pace (median 21d on market — plan ~3-4 weeks tenant-placement turnaround); 2,326 units permitted in Cameron County in 2024 (503 in 5+ unit buildings).
Forward outlook
- In year one you build about $8k of equity ($1k loan paydown + $6k appreciation (3.0% local appreciation)).
- Cameron County population projected at +3% by 2050 — modest demand growth; plan on rents tracking national, not racing it.
- At projected returns (3.0% appreciation + 3.0% rent growth), your $60k cash investment doubles in ~6 years — after that, you're playing with house money.
- By year 5, paydown + projected appreciation supports a ~$35k cash-out refi (75% LTV) — recoverable capital for the next deal without selling this one.
Negotiation context
- It's been on market 362 days — a 12% lower offer ($190k) is reasonable based on typical stale-listing flexibility.
Risks & watch-outs
- Climate carrying-cost: severe wind risk, 99% chance of damaging wind over 30y; extreme-heat days projected 7→27/yr by 2055 (HVAC capex compounding) — expect insurance premiums to compound above CPI over the hold.
Questions for the listing agent
- It's been on market 362 days. Have you received any prior offers? Is the seller open to a 12% concession, seller financing, or rate buy-down credit?
- Can we see the unit-by-unit rent roll, current vacancy, and any below-market leases? What's the average tenancy length?
- What capital expenditures (roof, boiler, parking lot, exteriors) have been made in the last 5 years, and what's planned in the next 2?
- Have any recent inspections been done? Can we get a copy of the seller's disclosures and any deferred-maintenance estimates?
- Built in 1979 — when were the roof, HVAC, electrical panel, plumbing, and water heater last replaced?
- Why hasn't it sold? Are there any deal-killer items the seller is aware of (foundation, flood, title, zoning, code violations)?
- Is there a deadline driving the sale (1031 exchange, divorce, estate, relocation)? That informs how much negotiation room exists.
- Crime grade is D in this area — have there been break-ins, vandalism, or insurance claims at this property in the last 3 years? What carrier currently insures it and at what premium?
- The area grade is low — what's the realistic commute time and amenity access for the typical tenant pool here? Any planned neighborhood developments (good or bad) we should know about?
- What's the average days-on-market for RENTAL listings here right now (not sales)? A rising rental-DOM trend means longer vacancies and softer asking-rent achievability than the comps imply.
- What's the recent tenant-quality profile in this submarket — average credit score on applications, eviction rate, late-payment / NSF rate, and stable-employment percentage? A property-management company in the area should have these aggregated.
- How much new apartment / multifamily construction is in the pipeline within 1–3 miles? Heavy new supply (>2% of stock underway) typically softens rents 12–24 months out; light construction supports rent growth.
Investment metrics
- 1% rule
- 0.96% ✗
- Cap rate
- 7.09%
- Cash-on-cash
- 2.86%
- DSCR
- 1.13
- GRM
- 8.7
CMA / ARV
No comps found within radius.
Projected returns pro-forma
3.0% appreciation · 3.0% rent growth · sell at horizon
- IRR
- 10.2%
- Equity multiple
- 1.58×
- Total profit
- $35,233
- Equity at exit
- $97,123
- IRR
- 12.5%
- Equity multiple
- 2.86×
- Total profit
- $112,635
- Equity at exit
- $149,678
Cash invested: $60,480 (down + closing). Projections, not guarantees.
Landlord ↔ Tenant lean methodology
- Overall (STATE)
- 87 Strongly Landlord-Friendly
- State Texas
- 87 Strongly Landlord-Friendly · R+5
- County
- — inherits STATE
- City
- — inherits STATE
ZIP-level market 78522
- Active inventory
- 13
- Price-to-rent
- 17.4×
Monthly cashflow live
- Estimated rent
- $2,072 high interval (Pro) →
- Mortgage (P&I)
- −$1,133
- Tax est. 1.5%
- −$270 /mo · $3,240/yr
- Insurance
- −$90
- HOA
- −$0
- Vacancy / Maint / Mgmt
- −$435
- Net cashflow
- $144
Break-even live
2-unit breakdown (identical units grouped — click to expand)
| Units | Beds | Baths | Est. rent |
|---|---|---|---|
| 2× units | 2 | 1 | $2,072 |
| #1 | 2 | 1 | $1,036 |
| #2 | 2 | 1 | $1,036 |
| Total (2 units) | $2,072 | ||
UW: 25.0% down · 7.5% · 30yr · 1.5% tax · 5.0% vac · 8.0% maint · 8.0% mgmt
Financing live
Cash to close
- Down payment
- $54,000
- Closing costs
- $6,480
- Reserves months
- —
- Total cash needed
- —
Loan-product check · same deal, 3 products live
Conventional
25% down · 7.5% · 30yr
- Down + closing
- —
- Monthly P&I
- —
- Monthly cashflow
- —
- DSCR
- —
- Eligible?
- —
Personal DTI + credit; lowest rate.
DSCR
20% down · 8.5% · 30yr
- Down + closing
- —
- Monthly P&I
- —
- Monthly cashflow
- —
- DSCR
- —
- Eligible?
- —
No personal income docs; deal must DSCR.
Hard money
10% down · 12.0% · 12mo
- Down + closing
- —
- Monthly P&I
- —
- Monthly cashflow
- —
- DSCR
- —
- Eligible?
- —
Short-term bridge; refi at stabilization.
Rent comps 7 comps
| Address | Beds | Baths | Sqft | Rent | $/sqft | DOM | Units | Dist |
|---|---|---|---|---|---|---|---|---|
| 1500 E Madison St Unit 1512 Brownsville, TX | 2.0 | 2.0 | 1700 | $2,200 | $1.29 | 13d | 1 | 0.74mi |
| 1500 E Madison St Unit 1506 Brownsville, TX | 3.0 | 3.0 | 2313 | $2,450 | $1.06 | 13d | 1 | 0.74mi |
| 30 W Monroe St Brownsville, TX | 3.0 | 2.0 | 2191 | $1,500 | $0.68 | 21d | 1 | 0.76mi |
| 35 Cenizo Brownsville, TX | 2.0 | 3.5 | 1404 | $2,500 | $1.78 | 43d | 1 | 1.17mi |
| 1234 W Levee St Brownsville, TX | 2.0 | 1.0 | 1281 | $1,500 | $1.17 | 21d | 1 | 1.28mi |
| 164 Robins Ln Brownsville, TX | 2.0 | 2.0 | 1620 | $2,200 | $1.36 | 43d | 1 | 1.45mi |
| 2024 E 19th St Brownsville, TX | 3.0 | 1.0 | 1259 | $2,000 | $1.59 | 21d | 1 | 1.49mi |
Listing history 6 events
-
2026-06-01days on market $216,000 Active 362 DOM
-
2026-05-31days on market $216,000 Active 361 DOM
-
2026-05-30days on market $216,000 Active 360 DOM
-
2026-03-19price $216,000 196-char remark
Show marketing remark (196 chars)
Two Story Duplex and Miutes away from Downtown Historical Brownsville. Building is Cynder Block and Each Unit has two (2) bedrooms , one bath (1). Individual Electrical Meters and One Water Meter.
-
2025-09-11price $225,000 196-char remark
Show marketing remark (196 chars)
Two Story Duplex and Miutes away from Downtown Historical Brownsville. Building is Cynder Block and Each Unit has two (2) bedrooms , one bath (1). Individual Electrical Meters and One Water Meter.
-
2025-06-04$235,000 Active 196-char remark
Show marketing remark (196 chars)
Two Story Duplex and Miutes away from Downtown Historical Brownsville. Building is Cynder Block and Each Unit has two (2) bedrooms , one bath (1). Individual Electrical Meters and One Water Meter.
ⓘ Source: listings_history table (triggers on properties + properties_extension) + one-shot
backfill from property_details.listing_events for pre-trigger history.
Climate risk First Street
- Flood 1/10 Low FEMA zone X (unshaded) · 0% chance over 30 yrs
- Wildfire 1/10 Low
- Heat 9/10 Extreme 7 d/yr ≥111°F today · 27 d/yr by 30 yrs out
- Wind 9/10 Extreme 99% chance of damaging wind over 30 yrs
- Air quality 3/10 Moderate 2 unhealthy d/yr today · 3 by 30 yrs out
Nearby sold comps map
Loading sold comps map…
Walkable amenities ~0.75 mi
Loading nearby amenities…
Taxation est. · year 1
- Rental income
- $24,864
- − Mortgage interest
- −$12,099
- − Property taxes
- −$3,240
- − Insurance
- −$1,080
- − Repairs & maintenance
- −$1,989
- − Management
- −$1,989
- − Depreciation
- −$6,284
- Taxable loss
- −$1,817
- Est. tax savings @ 24.0%
- +$436
- After-tax cash flow
- $2,166/yr
For passive investors: Depreciation is non-cash, so a rental often shows a tax loss while cash-flowing — sheltering income. Rental losses are passive: they offset passive income freely, and up to $25,000/yr can offset ordinary (W-2) income if you actively participate and your MAGI is under $100k (phasing out to $0 by $150k); unused losses carry forward. On sale, claimed depreciation is recaptured at up to 25%, and gains may owe capital-gains tax (a 1031 exchange can defer both). Figures are a year-1 estimate at your 24.0% rate — not tax advice; consult a CPA.
Condition & rehab AI · 8 photos
This two-story duplex requires extensive repairs and updates to bring it up to a livable condition. Immediate attention to broken windows, peeling paint, and landscaping is necessary to improve its curb appeal and value.
Repairs flagged
- Major Windows — Broken windows need immediate repair
- Major Exterior paint — Peeling paint indicates significant wear
- Major Landscaping — Overgrown landscaping needs trimming and maintenance
Value-add opportunities
- Both Painting and updating interior decor — Fresh paint and updated decor can significantly improve the home's appeal
- Both New flooring — New flooring can greatly enhance the home's value and appeal
- Both New windows and doors — New windows and doors can improve energy efficiency and curb appeal
- Both HVAC system upgrade — A new HVAC system can improve comfort and energy efficiency, making the home more attractive to potential buyers or renters
Renovation cost estimate screening
| Repair item | Severity | Est. cost |
|---|---|---|
| Windows · Broken windows need immediate repair | Major | $15,000–50,000 |
| Exterior paint · Peeling paint indicates significant wear | Major | $15,000–50,000 |
| Landscaping · Overgrown landscaping needs trimming and maintenance | Major | $15,000–50,000 |
| Total estimated repair cost · 3 items | $45,000–150,000 |
Value-add ROI direction
- Both Painting and updating interior decor — Fresh paint and updated decor can significantly improve the home's appeal ↑
- Both New flooring — New flooring can greatly enhance the home's value and appeal ↑
- Both New windows and doors — New windows and doors can improve energy efficiency and curb appeal ↑
- Both HVAC system upgrade — A new HVAC system can improve comfort and energy efficiency, making the home more attractive to potential buyers or renters ↑
ⓘ Cost ranges are severity-bucket heuristics (US national rule-of-thumb). Get contractor quotes + a written scope before underwriting a rehab budget.
Schools (NCES district)
- District
- Brownsville ISD
- NCES district ID
- 4811680
- Math proficiency
- 20% ▼ -36.00%
- Reading proficiency
- 34% ▼ -13.00%
- Median HH income
- $30,490
- Composite
- 21.8/100
- National rank
- #8249
- State rank
- #710 of 826 in TX
Livability — Brownsville
- Score
- 79/100
- State rank
- #62
- US rank
- #2311
Category grades
Schools grade is shown separately in the Schools card above.
Census & demographics
- Census place
- Brownsville, TX
Population outlook (Cameron County) Hauer SSP2
- Today (2025)
- 441,603 people
- By 2030
- 448,113 · +1.5%
- By 2040
- 456,385 · +3.3%
- By 2050
- 456,294 · +3.3%
- By 2075
- 423,851 · -4.0%
- By 2100
- 342,787 · -22.4%
Not yet ingested
- Political lean
- —
- Race & ethnicity
- —
- Common origin
- —
- Civics
- —
Market trends
- HPI YoY
- —
- Current HPI
- —
- Rent YoY
- —
- Metro
- —
- State GDP YoY
- ▲ 3.95%
- F500 in state
- 110
Industry mix (Fortune 500 HQ in TX)
| Industry | F500 HQs | Revenue |
|---|---|---|
| Energy | 16 | $1,198B |
|
||
| Technology | 5 | $198B |
|
||
| Engineering / Construction | 4 | $72B |
|
||
| Energy Services | 3 | $60B |
|
||
| Utilities | 3 | $41B |
|
||
| Healthcare | 2 | $330B |
|
||
Price history
-8.1% since first listed3 events — show timeline
- 2026-03-19 Price Changed $216,000 RGVMLS
- 2025-09-11 Price Changed $225,000 RGVMLS
- 2025-06-04 Listed $235,000 RGVMLS
Cash-flow waterfall
monthlySold comps — $/sqft
last 12 mo · ≤1 miLoading sold comps…