466 Ten Rod Rd · Kingston, RI
Flood risk 1/10 · Minimal
- FEMA flood zone
- X (unshaded)
- Chance of flooding over 30 yrs
- 0.0%
- Est. flood insurance / yr
- $473 – $860
Fire risk 3/10 · Minor
- Est. fire insurance / yr
- $835 – $1,551
Heat risk 4/10 · Minor
- Hot days now (above 96°F)
- 7 days/yr
- Hot days in 30 yrs
- 16 days/yr
Wind risk 8/10 · Major
- Chance of severe wind over 30 yrs
- 80.0%
Air-quality risk 2/10 · Minimal
- Unhealthy air days now
- 2 days/yr
- Unhealthy air days in 30 yrs
- 2 days/yr
Risk factors via First Street. Map © Google.
Why this score? — see what drove the C+ grade
The composite is a weighted blend of 9 inputs, each scored 0–100. Each bar is that input's sub-score; the figure is the points it added to the 100-point composite (weight × sub-score).
- Cash flow +21.1/30.0
- ARV discount +7.5/15.0
- DSCR +6.7/10.0
- Appreciation +6.4/10.0
- 1% rule +5.6/10.0
- Schools +4.1/10.0
- Livability +3.6/5.0
- Rent growth +2.5/5.0
- Condition / age +2.5/5.0
$189,900
🖨 Deal sheet 📄 Offer letter ✓ Due diligence
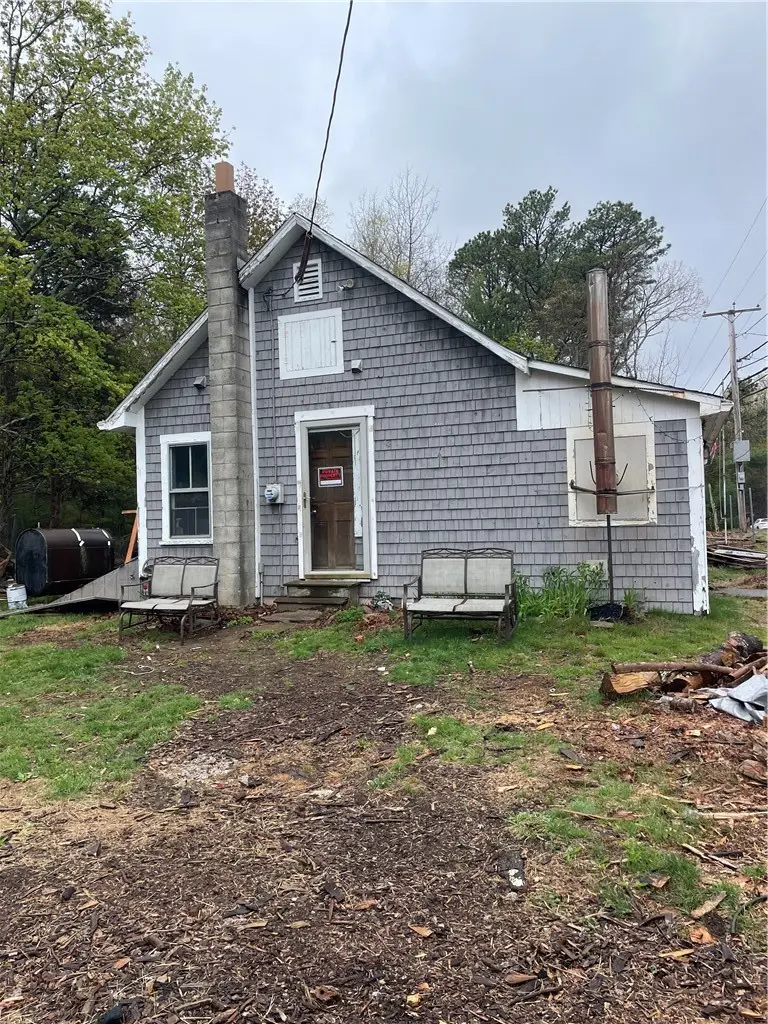
Listing remarks
Rare opportunity to build new or renovate on this spacious 2+ acre lot located in a sought-after area near Exeter Country Club. Existing 2-bedroom cottage and outbuilding on site offer limited utility and are being sold as-is. Property features a private well and existing 2-bedroom septic system Ideal for builders, investors, or buyers looking to create their dream home in peaceful setting with strong surrounding values. Plenty of space for expansion, recreation, or perhaps knock down existing building and build a custom new construction. Bring your vision-opportunities like this don't come around often
Key facts
- 2.04 acre lot
- Garage
- Built 1930
Property features AI
Finance
- HOA & community: Nearby golf; Highway access
Exterior
- Parking: Detached garage; Space for 6 vehicles (total)
- Utilities: Well water; Septic tank; 100 amp electric service
- Home design: Single-story; Fixer condition
- Construction: Wood siding; Stone foundation; Built on a 2.04-acre lot
- Exterior features: Wooded lot; Outbuilding
Interior
- Bathrooms: 1 full bathroom
- Heating & cooling: Oil hot water baseboard heating
- Interior features: Stall shower; Partial, unfinished basement
- Laundry & utility: Water heater
Neighborhood map
What this means for you Summary
Snapshot
- This is a 1-bed/1.0-bath single-family listed at $190k.
Deal economics
- At list price, monthly cash flow is $271 ($3k/yr) — positive.
- The deal already cash-flows at list — no discount required.
- Meets the 1% rule at list price ($2k rent vs $190k).
- Cap rate 8.0% vs local median 2.0% in Kingston — top-decile yield for the area; either an underpriced asset or a hidden risk that comps aren't pricing in. Stress-test before assuming the spread holds.
Location & tenants
- Location reads 72/100 on livability (#15 in RI) — a middle-class / working-renter tenant base. Strengths: crime A+, employment A+, housing A+; Watch: amenities F, commute F, cost of living F.
- Exeter-West Greenwich (rural): math 39% / reading 48% proficiency, ranked #11 of 39 in RI (top 28%) — families likely to look elsewhere, expect single-tenant / working-renter base with shorter leases; only 12% free/reduced lunch — higher-income household profile.
- Market conditions: 21 active listings in the ZIP; 311 units permitted in Washington County in 2024 (45 in 5+ unit buildings).
Forward outlook
- In year one you build about $7k of equity ($1k loan paydown + $5k appreciation (2.8% local appreciation)).
- Washington County population projected at -14% by 2050 — secular population decline; favor cash flow + early exit over multi-decade hold.
- At projected returns (2.8% appreciation + 3.0% rent growth), your $53k cash investment doubles in ~5 years — after that, you're playing with house money.
- By year 6, paydown + projected appreciation supports a ~$35k cash-out refi (75% LTV) — recoverable capital for the next deal without selling this one.
Negotiation context
- Only 7 days on market — expect competitive offers; lowballing is unlikely to land.
Risks & watch-outs
- Watch-outs: built in 1930 — expect roof / HVAC / electrical / plumbing capex.
- Climate carrying-cost: severe wind risk, 80% chance of damaging wind over 30y — expect insurance premiums to compound above CPI over the hold.
Questions for the listing agent
- Built in 1930 — when were the roof, HVAC, electrical panel, plumbing, and water heater last replaced?
- Is there a deadline driving the sale (1031 exchange, divorce, estate, relocation)? That informs how much negotiation room exists.
- Schools are B-rated — typically a magnet for longer-tenancy family renters. What's the average tenant stay here, and is there a school-zone premium baked into asking?
- What's the average days-on-market for RENTAL listings here right now (not sales)? A rising rental-DOM trend means longer vacancies and softer asking-rent achievability than the comps imply.
- What's the recent tenant-quality profile in this submarket — average credit score on applications, eviction rate, late-payment / NSF rate, and stable-employment percentage? A property-management company in the area should have these aggregated.
- How much new for-sale + rental construction is in the pipeline within 1–3 miles? Heavy new supply typically softens prices + rents 12–24 months out; constrained supply supports both.
Investment metrics
- 1% rule
- 1.06% ✓
- Cap rate
- 8.01%
- Cash-on-cash
- 6.13%
- DSCR
- 1.27
- GRM
- 7.9
CMA / ARV
- ARV (on-the-fly)
- $190,080
- Comps found
- 1
Show comp detail 1 sale within ~0.75 mi
| Address | Dist | Beds/Ba | Sqft | Sold | Price | $/sf | Match |
|---|---|---|---|---|---|---|---|
| 466 Ten Rod Rd | 0.00mi | 2/1.0 (+1) | 432 (0%) | 0mo | $190,000 | $440 | 95 |
Match score weights: distance 35% · size 25% · config 20% · recency 20%. Top-matched comps best support the ARV.
Projected returns pro-forma
2.8% appreciation · 3.0% rent growth · sell at horizon
- IRR
- 12.7%
- Equity multiple
- 1.72×
- Total profit
- $38,228
- Equity at exit
- $83,291
- IRR
- 14.9%
- Equity multiple
- 3.15×
- Total profit
- $114,405
- Equity at exit
- $126,755
Cash invested: $53,172 (down + closing). Projections, not guarantees.
Landlord ↔ Tenant lean methodology
- Overall (STATE)
- 31 Tenant-Leaning
- State Rhode Island
- 31 Tenant-Leaning · D+8
- County
- — inherits STATE
- City
- — inherits STATE
ZIP-level market 02822
- Home prices YoY
- 0.8%
- Active inventory
- 21
- Price-to-rent
- 7.9×
Monthly cashflow live
- Estimated rent
- $2,013 medium interval (Pro) →
- Mortgage (P&I)
- −$996
- Tax from tax record
- −$244 /mo · $2,923/yr
- Insurance
- −$79
- HOA
- −$0
- Vacancy / Maint / Mgmt
- −$423
- Net cashflow
- $271
Break-even live
UW: 25.0% down · 7.5% · 30yr · 1.5% tax · 5.0% vac · 8.0% maint · 8.0% mgmt
Financing live
Cash to close
- Down payment
- $47,475
- Closing costs
- $5,697
- Reserves months
- —
- Total cash needed
- —
Loan-product check · same deal, 3 products live
Conventional
25% down · 7.5% · 30yr
- Down + closing
- —
- Monthly P&I
- —
- Monthly cashflow
- —
- DSCR
- —
- Eligible?
- —
Personal DTI + credit; lowest rate.
DSCR
20% down · 8.5% · 30yr
- Down + closing
- —
- Monthly P&I
- —
- Monthly cashflow
- —
- DSCR
- —
- Eligible?
- —
No personal income docs; deal must DSCR.
Hard money
10% down · 12.0% · 12mo
- Down + closing
- —
- Monthly P&I
- —
- Monthly cashflow
- —
- DSCR
- —
- Eligible?
- —
Short-term bridge; refi at stabilization.
Listing history 2 events
-
2026-05-07status Pending
-
2026-04-30$189,900 Active
ⓘ Source: listings_history table (triggers on properties + properties_extension) + one-shot
backfill from property_details.listing_events for pre-trigger history.
Tax reassessment forecast RI · Partial reset (capped growth)
- Current annual tax
- $2,923 · $244/mo
- Projected year-2 tax
- $3,009 · $251/mo
- Expected delta
- +$86/yr (+$7/mo · 2.9%)
ⓘ Screening estimate from a state-policy table — verify with the county assessor before closing.
Climate risk First Street
- Flood 1/10 Low FEMA zone X (unshaded) · 0% chance over 30 yrs
- Wildfire 3/10 Moderate
- Heat 4/10 Moderate 7 d/yr ≥96°F today · 16 d/yr by 30 yrs out
- Wind 8/10 Severe 80% chance of damaging wind over 30 yrs
- Air quality 2/10 Low 2 unhealthy d/yr today · 2 by 30 yrs out
Nearby sold comps map
Loading sold comps map…
Walkable amenities ~0.75 mi
Loading nearby amenities…
Taxation est. · year 1
- Rental income
- $24,152
- − Mortgage interest
- −$10,637
- − Property taxes
- −$2,923
- − Insurance
- −$950
- − Repairs & maintenance
- −$1,932
- − Management
- −$1,932
- − Depreciation
- −$5,524
- Taxable income
- $253
- Est. tax owed @ 24.0%
- −$61
- After-tax cash flow
- $3,196/yr
For passive investors: Depreciation is non-cash, so a rental often shows a tax loss while cash-flowing — sheltering income. Rental losses are passive: they offset passive income freely, and up to $25,000/yr can offset ordinary (W-2) income if you actively participate and your MAGI is under $100k (phasing out to $0 by $150k); unused losses carry forward. On sale, claimed depreciation is recaptured at up to 25%, and gains may owe capital-gains tax (a 1031 exchange can defer both). Figures are a year-1 estimate at your 24.0% rate — not tax advice; consult a CPA.
Schools (NCES district)
- District
- Exeter-West Greenwich
- NCES district ID
- 4400360
- Math proficiency
- 39% ▼ -10.00%
- Reading proficiency
- 48% ▼ -8.00%
- Median HH income
- $84,349
- Composite
- 40.65/100
- National rank
- #3679
- State rank
- #11 of 39 in RI
Livability — Kingston
- Score
- 72/100
- State rank
- #15
- US rank
- #6220
Category grades
Schools grade is shown separately in the Schools card above.
Census & demographics
- City population
- 7,183
- Population (ZIP)
- 6,139
Population outlook (Washington County) Hauer SSP2
- Today (2025)
- 123,856 people
- By 2030
- 121,962 · -1.5%
- By 2040
- 115,902 · -6.4%
- By 2050
- 107,078 · -13.5%
- By 2075
- 92,575 · -25.3%
- By 2100
- 77,407 · -37.5%
Race, ethnicity, and origin ACS 2023
- Neighborhood character
- Predominantly White (85%)
- Race & ethnicity
- White 85% Two or more races 9% Hispanic / Latino 6% Black 2%
- Hispanic origin (detail)
- Puerto Rican 4%
- Common ancestry
- Lithuanian 7% Romanian 3% Russian 3%
- Foreign-born
- 5% · Canada, China
- Languages at home
- 95% English-only · Russian/Polish/Slavic 2% French/Haitian/Cajun 1% Chinese 1%
Political lean MEDSL · Washington
- 2024 margin
- D (+15.0) · D 56.4% · R 41.4% · Other 2.3%
- 2008→2024 swing
- -24.3pp toward R · 2008: 39.3pp · 2024: 15.0pp
- All cycles
- 2024: D+15.0 2020: D+19.4 2016: D+10.0 2012: D+16.8 2008: D+39.3
Not yet ingested
- Civics
- —
Market trends
- HPI YoY
- ▲ 2.80%
- Current HPI
- 351.6284
- Rent YoY
- —
- Metro
- —
- State GDP YoY
- ▲ 2.25%
- F500 in state
- 10
Industry mix (Fortune 500 HQ in RI)
| Industry | F500 HQs | Revenue |
|---|---|---|
| Healthcare | 1 | $373B |
|
||
| Food Distribution | 1 | $31B |
|
||
| Aerospace / Defense | 1 | $14B |
|
||
| Financial Services | 1 | $8B |
|
||
| Consumer Goods | 1 | $4B |
|
||
Price history
2 events — show timeline
- 2026-05-07 Pending — RIS
- 2026-04-30 Listed $189,900 RIS
Property tax history
+3.7%/yrLatest (2025): $2,923 · +28.4% YoY. Source: county tax records.
Cash-flow waterfall
monthlySold comps — $/sqft
last 12 mo · ≤1 miLoading sold comps…