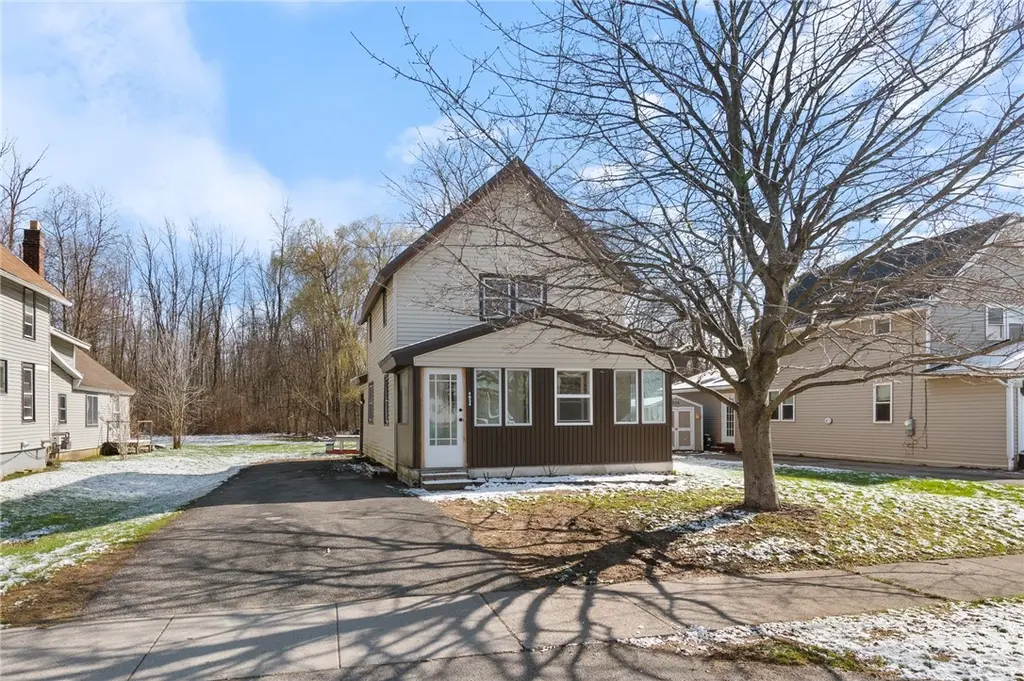
4024 Ridgeway St · Williamson, NY
Flood risk 1/10 · Minimal
- FEMA flood zone
- —
- Chance of flooding over 30 yrs
- 0.0%
- Est. flood insurance / yr
- —
Fire risk 4/10 · Minor
- Est. fire insurance / yr
- $691 – $1,283
Heat risk 2/10 · Minimal
- Hot days now (above 95°F)
- 7 days/yr
- Hot days in 30 yrs
- 16 days/yr
Wind risk 1/10 · Minimal
- Chance of severe wind over 30 yrs
- 0.0%
Air-quality risk 2/10 · Minimal
- Unhealthy air days now
- 1 days/yr
- Unhealthy air days in 30 yrs
- 2 days/yr
Risk factors via First Street. Map © Google.
Why this score? — see what drove the B- grade
The composite is a weighted blend of 9 inputs, each scored 0–100. Each bar is that input's sub-score; the figure is the points it added to the 100-point composite (weight × sub-score).
- Cash flow +22.6/30.0
- ARV discount +15.0/15.0
- 1% rule +7.6/10.0
- DSCR +7.2/10.0
- Schools +4.4/10.0
- Livability +4.0/5.0
- Rent growth +2.5/5.0
- Condition / age +2.5/5.0
- Appreciation +0.0/10.0
$119,000
🖨 Deal sheet 📄 Offer letter ✓ Due diligence
Listing remarks
Looking for an affordable home in Williamson NY? Here’s a two/three bedroom, one full bath home with a first floor laundry that has an enclosed front porch (great space to keep all those coats and boots!) that’s a wonderful retreat for a spot to sit and enjoy the views of the outdoors. The rear first floor room in this home (was used as a bedroom) is a flex space that can be used as another bedroom- studio- home office- playroom and more! The FIRST FLOOR LAUNDRY is a huge plus! The kitchen even has an WALK IN PANTRY for plenty of storage! Upstairs you’ll have two more bedrooms- a full bath too! All this covered by a METAL ROOF for years of worry free service! The ample lo
Key facts
- Metal roof
- First floor laundry
- Ample lot
Tags
Property features AI
Exterior
- Parking: No garage
- Utilities: Electricity connected (circuit breakers); Public water connected; Sewer connected; High-speed internet available
- Home design: 2-story house; Existing construction
- Construction: Metal roof; Aluminum siding; Vinyl siding; Wood siding; Copper plumbing; Block foundation; Pillar/post/pier foundation; Crawl space basement
- Exterior features: Enclosed porch; Open porch; Blacktop driveway; Shed(s); Exterior storage
Interior
- Kitchen: Free-standing range; Oven; Refrigerator
- Bedrooms: 1 main-level bedroom
- Flooring: Hardwood; Vinyl; Varies
- Bathrooms: 1 full bathroom
- Heating & cooling: Electric heating; Baseboard heating; Additional heating details in remarks
- Interior features: Breakfast area; Eat-in kitchen; Country kitchen; Storage; Thermal windows
- Laundry & utility: Main-level laundry; Gas water heater
Neighborhood map
What this means for you Summary
Snapshot
- This is a 2-bed/1.0-bath single-family listed at $119k.
Deal economics
- At list price, monthly cash flow is $202 ($2k/yr) — positive.
- The deal already cash-flows at list — no discount required.
- Meets the 1% rule at list price ($1k rent vs $119k).
Location & tenants
- Location reads 79/100 on livability (#141 in NY, #2,196 nationally) — a middle-class / working-renter tenant base. Strengths: cost of living A+, housing A+, health & safety A+; Watch: employment C-, amenities F.
- Williamson Central School District (rural): math 51% / reading 50% proficiency, ranked #363 of 590 in NY (top 62%) — acceptable for families but not a draw, mixed tenant base, ~2y average lease.
- Market conditions: 33 active listings in the ZIP; 259 units permitted in Wayne County in 2024 (90 in 5+ unit buildings).
Forward outlook
- Local home prices are declining (-3.0%/yr); year-one equity from $823 of loan paydown is wiped out by about $4k of value loss. Plan a longer hold.
- Wayne County population projected at -24% by 2050 — secular population decline; favor cash flow + early exit over multi-decade hold.
Negotiation context
- Only 14 days on market — expect competitive offers; lowballing is unlikely to land.
- Current owner paid $46k; list at $119k implies a 162% gain — meaningful room to come down on a strong offer.
Risks & watch-outs
- Watch-outs: property tax is 3.1% of price; built in 1925 — expect roof / HVAC / electrical / plumbing capex.
Questions for the listing agent
- Built in 1925 — when were the roof, HVAC, electrical panel, plumbing, and water heater last replaced?
- Property tax is high relative to price — has the assessment been appealed recently, and will the sale trigger a re-assessment?
- Is there a deadline driving the sale (1031 exchange, divorce, estate, relocation)? That informs how much negotiation room exists.
- Schools are B-rated — typically a magnet for longer-tenancy family renters. What's the average tenant stay here, and is there a school-zone premium baked into asking?
- What's the average days-on-market for RENTAL listings here right now (not sales)? A rising rental-DOM trend means longer vacancies and softer asking-rent achievability than the comps imply.
- What's the recent tenant-quality profile in this submarket — average credit score on applications, eviction rate, late-payment / NSF rate, and stable-employment percentage? A property-management company in the area should have these aggregated.
- How much new for-sale + rental construction is in the pipeline within 1–3 miles? Heavy new supply typically softens prices + rents 12–24 months out; constrained supply supports both.
Investment metrics
- 1% rule
- 1.26% ✓
- Cap rate
- 8.32%
- Cash-on-cash
- 7.26%
- DSCR
- 1.32
- GRM
- 6.6
CMA / ARV
- ARV (on-the-fly)
- $212,400
- Comps found
- 4
Show comp detail 4 sales within ~0.75 mi
| Address | Dist | Beds/Ba | Sqft | Sold | Price | $/sf | Match |
|---|---|---|---|---|---|---|---|
| 4034 Rasmussen St | 0.17mi | 2/2.0 | 1,150 (-2%) | 1mo | $320,000 | $278 | 83 |
| 6315 State Route 21 Ave | 0.28mi | 3/2.5 (+1) | 1,300 (+10%) | 5mo | $210,000 | $162 | 55 |
| 6275 State Route 21 | 0.38mi | 3/2.0 (+1) | 1,290 (+9%) | 16mo | $166,100 | $129 | 44 |
| 6274 Bennett St | 0.36mi | 3/1.0 (+1) | 1,026 (-13%) | 19mo | $185,000 | $180 | 40 |
Match score weights: distance 35% · size 25% · config 20% · recency 20%. Top-matched comps best support the ARV.
Projected returns pro-forma
-3.0% appreciation · 3.0% rent growth · sell at horizon
- IRR
- -5.1%
- Equity multiple
- 0.81×
- Total profit
- $-6,329
- Equity at exit
- $17,743
- IRR
- 4.7%
- Equity multiple
- 1.35×
- Total profit
- $11,504
- Equity at exit
- $10,289
Cash invested: $33,320 (down + closing). Projections, not guarantees.
Landlord ↔ Tenant lean methodology
- Overall (STATE)
- 15 Strongly Tenant-Friendly
- State New York
- 15 Strongly Tenant-Friendly · D+10
- County
- — inherits STATE
- City
- — inherits STATE
ZIP-level market 14589
- Home prices YoY
- -19.4%
- Active inventory
- 33
- Price-to-rent
- 6.6×
Monthly cashflow live
- Estimated rent
- $1,497 medium interval (Pro) →
- Mortgage (P&I)
- −$624
- Tax from tax record
- −$308 /mo · $3,694/yr
- Insurance
- −$50
- HOA
- −$0
- Vacancy / Maint / Mgmt
- −$314
- Net cashflow
- $202
Break-even live
UW: 25.0% down · 7.5% · 30yr · 1.5% tax · 5.0% vac · 8.0% maint · 8.0% mgmt
Financing live
Cash to close
- Down payment
- $29,750
- Closing costs
- $3,570
- Reserves months
- —
- Total cash needed
- —
Loan-product check · same deal, 3 products live
Conventional
25% down · 7.5% · 30yr
- Down + closing
- —
- Monthly P&I
- —
- Monthly cashflow
- —
- DSCR
- —
- Eligible?
- —
Personal DTI + credit; lowest rate.
DSCR
20% down · 8.5% · 30yr
- Down + closing
- —
- Monthly P&I
- —
- Monthly cashflow
- —
- DSCR
- —
- Eligible?
- —
No personal income docs; deal must DSCR.
Hard money
10% down · 12.0% · 12mo
- Down + closing
- —
- Monthly P&I
- —
- Monthly cashflow
- —
- DSCR
- —
- Eligible?
- —
Short-term bridge; refi at stabilization.
Listing history 5 events
-
2026-04-29status Pending
-
2026-04-15$119,000 Active
-
2018-12-21soldstatus $45,500
-
1996-10-07soldstatus $43,900
-
1994-01-11soldstatus $35,832
ⓘ Source: listings_history table (triggers on properties + properties_extension) + one-shot
backfill from property_details.listing_events for pre-trigger history.
Tax reassessment forecast NY · Partial reset (capped growth)
- Current annual tax
- $3,694 · $308/mo
- Projected year-2 tax
- $3,694 · $308/mo
- Expected delta
- $0/yr ($0/mo · 0.0%)
ⓘ Screening estimate from a state-policy table — verify with the county assessor before closing.
Climate risk First Street
- Flood 1/10 Low 0% chance over 30 yrs
- Wildfire 4/10 Moderate
- Heat 2/10 Low 7 d/yr ≥95°F today · 16 d/yr by 30 yrs out
- Wind 1/10 Low 0% chance of damaging wind over 30 yrs
- Air quality 2/10 Low 1 unhealthy d/yr today · 2 by 30 yrs out
Nearby sold comps map
Loading sold comps map…
Walkable amenities ~0.75 mi
Loading nearby amenities…
Taxation est. · year 1
- Rental income
- $17,969
- − Mortgage interest
- −$6,666
- − Property taxes
- −$3,694
- − Insurance
- −$595
- − Repairs & maintenance
- −$1,438
- − Management
- −$1,438
- − Depreciation
- −$3,462
- Taxable income
- $677
- Est. tax owed @ 24.0%
- −$163
- After-tax cash flow
- $2,255/yr
For passive investors: Depreciation is non-cash, so a rental often shows a tax loss while cash-flowing — sheltering income. Rental losses are passive: they offset passive income freely, and up to $25,000/yr can offset ordinary (W-2) income if you actively participate and your MAGI is under $100k (phasing out to $0 by $150k); unused losses carry forward. On sale, claimed depreciation is recaptured at up to 25%, and gains may owe capital-gains tax (a 1031 exchange can defer both). Figures are a year-1 estimate at your 24.0% rate — not tax advice; consult a CPA.
Schools (NCES district)
- District
- Williamson Central School District
- NCES district ID
- 3631440
- Math proficiency
- 51% ▼ -6.00%
- Reading proficiency
- 50% ▼ -1.00%
- Median HH income
- $56,080
- Composite
- 43.79/100
- National rank
- #2937
- State rank
- #363 of 590 in NY
Livability — Williamson
- Score
- 79/100
- State rank
- #141
- US rank
- #2196
Category grades
Schools grade is shown separately in the Schools card above.
Census & demographics
- Census place
- Williamson, NY
- Population (ZIP)
- 7,904
Population outlook (Wayne County) Hauer SSP2
- Today (2025)
- 85,662 people
- By 2030
- 81,945 · -4.3%
- By 2040
- 73,735 · -13.9%
- By 2050
- 65,029 · -24.1%
- By 2075
- 47,451 · -44.6%
- By 2100
- 31,574 · -63.1%
Race, ethnicity, and origin ACS 2023
- Neighborhood character
- Predominantly White (88%)
- Race & ethnicity
- White 88% Hispanic / Latino 6% Two or more races 5% Black 2%
- Hispanic origin (detail)
- Mexican 4% Puerto Rican 1%
- Common ancestry
- Iranian 13% Romanian 4% Lithuanian 3%
- Foreign-born
- 5% · Canada
- Languages at home
- 94% English-only · Spanish 4% Arabic 1% Other Indo-European 1%
Political lean MEDSL · Wayne
- 2024 margin
- Strong R (+23.1) · D 38.5% · R 61.5%
- 2008→2024 swing
- -13.2pp toward R · 2008: -9.9pp · 2024: -23.1pp
- All cycles
- 2024: R+23.1 2020: R+19.6 2016: R+26.1 2012: R+9.3 2008: R+9.9
Not yet ingested
- Civics
- —
Market trends
- HPI YoY
- ▼ -56.43%
- Current HPI
- 234.0889
- Rent YoY
- —
- Metro
- —
- State GDP YoY
- ▲ 2.60%
- F500 in state
- 92
Industry mix (Fortune 500 HQ in NY)
| Industry | F500 HQs | Revenue |
|---|---|---|
| Financial Services | 10 | $950B |
|
||
| Consumer Goods | 9 | $162B |
|
||
| Insurance | 4 | $225B |
|
||
| Telecommunications | 2 | $144B |
|
||
| Pharmaceuticals | 2 | $112B |
|
||
| Media / Entertainment | 2 | $69B |
|
||
Price history
+232.1% since first listed5 events — show timeline
- 2026-04-29 Pending — UNYREIS
- 2026-04-15 Listed $119,000 UNYREIS
- 2018-12-21 Sold (Public Records) $45,500 Public Records
- 1996-10-07 Sold (Public Records) $43,900 Public Records
- 1994-01-11 Sold (Public Records) $35,832 Public Records
Property tax history
+4.9%/yrLatest (2025): $3,694 · +2.0% YoY. Source: county tax records.
Cash-flow waterfall
monthlySold comps — $/sqft
last 12 mo · ≤1 miLoading sold comps…