 Multi-family
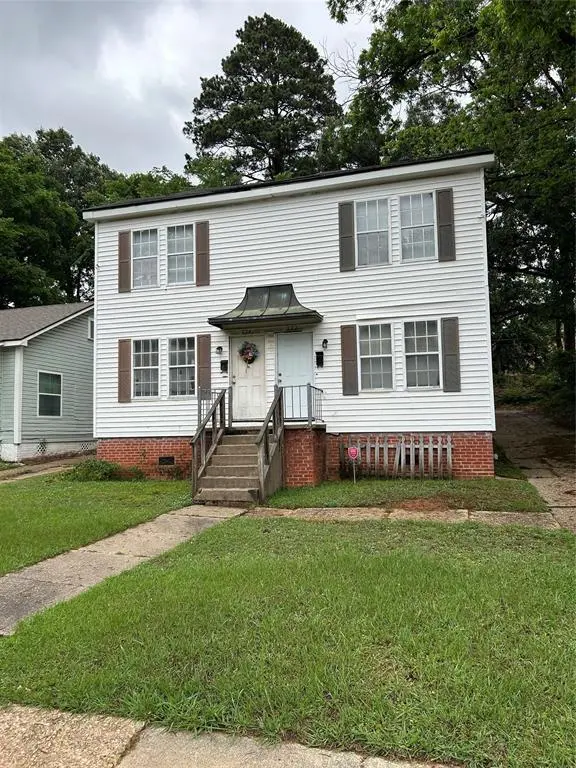
224 Olive St · Shreveport, LA
Flood risk 1/10 · Minimal
- FEMA flood zone
- X (unshaded)
- Chance of flooding over 30 yrs
- 0.0%
- Est. flood insurance / yr
- $507 – $1,088
Fire risk 1/10 · Minimal
- Est. fire insurance / yr
- $1,269 – $2,357
Heat risk 7/10 · Major
- Hot days now (above 110°F)
- 7 days/yr
- Hot days in 30 yrs
- 22 days/yr
Wind risk 6/10 · Moderate
- Chance of severe wind over 30 yrs
- 66.0%
Air-quality risk 2/10 · Minimal
- Unhealthy air days now
- 1 days/yr
- Unhealthy air days in 30 yrs
- 2 days/yr
Risk factors via First Street. Map © Google.
Why this score? — see what drove the C grade
The composite is a weighted blend of 9 inputs, each scored 0–100. Each bar is that input's sub-score; the figure is the points it added to the 100-point composite (weight × sub-score).
- Cash flow +25.8/30.0
- DSCR +8.7/10.0
- ARV discount +7.5/15.0
- 1% rule +5.5/10.0
- Rent growth +3.4/5.0
- Livability +3.0/5.0
- Condition / age +2.5/5.0
- Schools +2.2/10.0
- Appreciation +0.0/10.0
$169,900
🖨 Deal sheet 📄 Offer letter ✓ Due diligence
Multi-family units
County records classify this as Multi-Family (2-4 Unit). Listing-text estimate: 1 unit. estimate disagrees with records
Listing remarks MLS
Low maintenance investment opportunity, both have large kitchens and separate dining rooms. Washer-Dryer hook ups in both units, there is an upstairs unit and a downstairs unit. Close to public transportation and convenient to the VA hospital.
Key facts
- New paint
- Large kitchen
- New dishwasher
Tags
Property features AI
Finance
- Other: Lot approximately 0.178 acres; Subdivision: Opo Sub; County: Caddo, United States
- Financial info: Property marketed as residential income (duplex); Two buildings with a total of 2 units; Reported gross annual income and expenses listed as $0.00
- HOA & community: No association
Exterior
- Parking: 4 parking spaces; No garage
- Utilities: City water; City sewer; No municipal utility district
- Home design: Duplex (residential income); Two levels; Entry level information not provided
- Construction: Vinyl siding exterior; Asphalt roof; Pillar/post/pier foundation; Built in 1990
- Exterior features: Outside parking pad; On-site common parking
Interior
- Kitchen: Built-in refrigerator; Dishwasher; Electric range
- Flooring: Ceramic tile
- Heating & cooling: Central heating (natural gas); Central air (electric)
- Interior features: Decorative lighting; Eat-in kitchen; High-speed internet available
Neighborhood map
What this means for you Summary
Snapshot
- This is a 4-bed/2.0-bath multifamily listed at $170k.
Deal economics
- At list price, monthly cash flow is $414 ($5k/yr) — positive.
- The deal already cash-flows at list — no discount required.
- Meets the 1% rule at list price ($2k rent vs $170k).
- Recommended offer: $165k (3.0% below list) — sets the bar for market timing.
- Cap rate 9.2% vs local median 5.7% in Shreveport — top-decile yield for the area; either an underpriced asset or a hidden risk that comps aren't pricing in. Stress-test before assuming the spread holds.
Location & tenants
- Location reads 59/100 on livability (#270 in LA) — a working-class tenant base; expect higher turnover. Strengths: cost of living A+, housing A; Watch: schools D+, crime F, amenities F.
- Caddo Parish (urban): math 21% / reading 32% proficiency, ranked #53 of 98 in LA (top 54%) — low school quality limits family demand, transient renter base, plan for 1-2y turnover; 64% free/reduced lunch — lower-income household profile, screen leases tightly.
- Market conditions: Rents rising (+3.6%/yr); 146 active listings in the ZIP; 12 comparable units currently listed for rent nearby; rentals at typical pace (median 21d on market — plan ~3-4 weeks tenant-placement turnaround); 42% of comp listings sitting > 30 days — soft ceiling on asking rent; 221 units permitted in Caddo Parish in 2024 (0 in 5+ unit buildings).
- This rent runs 38% of the median local income ($57k/yr) — at the standard rent-burdened threshold; future hikes will face affordability resistance.
Forward outlook
- Local home prices are declining (-3.0%/yr); year-one equity from $1k of loan paydown is wiped out by about $5k of value loss. Plan a longer hold.
- Caddo County population projected at -15% by 2050 — secular population decline; favor cash flow + early exit over multi-decade hold.
- At projected returns (-3.0% appreciation + 3.6% rent growth), your $48k cash investment doubles in ~10 years — after that, you're playing with house money.
Negotiation context
- It's been on market 41 days — a 3% lower offer ($165k) is reasonable based on typical stale-listing flexibility.
- 2 sale attempts since 6y ago with the ask held roughly flat each time — persistent listings suggest the price (not the market) is what's stuck; bring a comps-based counter.
- Current owner paid $120k; 42% above their basis — modest negotiation headroom, anchor on the comps not their cost.
Risks & watch-outs
- Climate carrying-cost: major wind risk, 66% chance of damaging wind over 30y; extreme-heat days projected 7→22/yr by 2055 (HVAC capex compounding) — expect insurance premiums to compound above CPI over the hold.
Questions for the listing agent
- It's been on market 41 days. Have you received any prior offers? Is the seller open to a 3% concession, seller financing, or rate buy-down credit?
- Is there a deadline driving the sale (1031 exchange, divorce, estate, relocation)? That informs how much negotiation room exists.
- Schools are D-rated, which usually means shorter tenancies and higher turnover. Who's the typical renter profile here, and what's been the actual vacancy rate?
- Crime grade is F in this area — have there been break-ins, vandalism, or insurance claims at this property in the last 3 years? What carrier currently insures it and at what premium?
- What's the average days-on-market for RENTAL listings here right now (not sales)? A rising rental-DOM trend means longer vacancies and softer asking-rent achievability than the comps imply.
- What's the recent tenant-quality profile in this submarket — average credit score on applications, eviction rate, late-payment / NSF rate, and stable-employment percentage? A property-management company in the area should have these aggregated.
- How much new apartment / multifamily construction is in the pipeline within 1–3 miles? Heavy new supply (>2% of stock underway) typically softens rents 12–24 months out; light construction supports rent growth.
Investment metrics
- 1% rule
- 1.05% ✓
- Cap rate
- 9.22%
- Cash-on-cash
- 10.45%
- DSCR
- 1.47
- GRM
- 7.9
CMA / ARV
- ARV (median comp)
- $105,098
- List price
- $169,900
- Delta
- 61.66%
- Verdict
- OVERPRICED
- Comps
- 20 within 1.0 mi
Show comp detail 7 sales within ~0.75 mi
| Address | Dist | Beds/Ba | Sqft | Sold | Price | $/sf | Match |
|---|---|---|---|---|---|---|---|
| 362 Boulevard St | 0.27mi | 4/2.0 | 1,881 (-7%) | 8mo | $175,000 | $93 | 68 |
| 2401 Creswell Ave | 0.53mi | 4/3.0 | 1,972 (-3%) | 11mo | $112,293 | $57 | 57 |
| 705 College St | 0.60mi | 3/2.0 (-1) | 1,870 (-8%) | 6mo | $90,000 | $48 | 48 |
| 221 E Jordan St | 0.49mi | 4/2.0 | 1,765 (-13%) | 20mo | $140,000 | $79 | 38 |
| 540 Wilkinson St | 0.64mi | 3/2.0 (-1) | 1,764 (-13%) | 11mo | $65,000 | $37 | 35 |
| 2316 Creswell Ave | 0.52mi | 3/2.0 (-1) | 1,736 (-14%) | 15mo | $224,900 | $130 | 34 |
| 318 Columbia St | 0.62mi | 4/3.0 | 2,213 (+9%) | 24mo | $149,900 | $68 | 32 |
Match score weights: distance 35% · size 25% · config 20% · recency 20%. Top-matched comps best support the ARV.
Projected returns pro-forma
-3.0% appreciation · 3.56% rent growth · sell at horizon
- IRR
- -0.1%
- Equity multiple
- 1.00×
- Total profit
- $-200
- Equity at exit
- $25,333
- IRR
- 10.0%
- Equity multiple
- 1.79×
- Total profit
- $37,700
- Equity at exit
- $14,690
Cash invested: $47,572 (down + closing). Projections, not guarantees.
Landlord ↔ Tenant lean methodology
- Overall (STATE)
- 90 Strongly Landlord-Friendly
- State Louisiana
- 90 Strongly Landlord-Friendly · R+12
- County
- — inherits STATE
- City
- — inherits STATE
ZIP-level market 71104
- Home prices YoY
- -32.2%
- Rents YoY
- 3.6%
- Active inventory
- 146
- Price-to-rent
- 15.8×
Monthly cashflow live
- Estimated rent
- $1,790 high interval (Pro) →
- Mortgage (P&I)
- −$891
- Tax from tax record
- −$38 /mo · $454/yr
- Insurance
- −$71
- HOA
- −$0
- Vacancy / Maint / Mgmt
- −$376
- Net cashflow
- $414
Break-even live
2-unit breakdown (identical units grouped — click to expand)
| Units | Beds | Baths | Est. rent |
|---|---|---|---|
| 2× units | 2 | 1 | $1,790 |
| #1 | 2 | 1 | $895 |
| #2 | 2 | 1 | $895 |
| Total (2 units) | $1,790 | ||
UW: 25.0% down · 7.5% · 30yr · 1.5% tax · 5.0% vac · 8.0% maint · 8.0% mgmt
Financing live
Cash to close
- Down payment
- $42,475
- Closing costs
- $5,097
- Reserves months
- —
- Total cash needed
- —
Loan-product check · same deal, 3 products live
Conventional
25% down · 7.5% · 30yr
- Down + closing
- —
- Monthly P&I
- —
- Monthly cashflow
- —
- DSCR
- —
- Eligible?
- —
Personal DTI + credit; lowest rate.
DSCR
20% down · 8.5% · 30yr
- Down + closing
- —
- Monthly P&I
- —
- Monthly cashflow
- —
- DSCR
- —
- Eligible?
- —
No personal income docs; deal must DSCR.
Hard money
10% down · 12.0% · 12mo
- Down + closing
- —
- Monthly P&I
- —
- Monthly cashflow
- —
- DSCR
- —
- Eligible?
- —
Short-term bridge; refi at stabilization.
Rent comps 12 comps
| Address | Beds | Baths | Sqft | Rent | $/sqft | DOM | Units | Dist |
|---|---|---|---|---|---|---|---|---|
| 442 Merrick St Shreveport, LA | 3.0 | 1.5 | 1595 | $1,000 | $0.63 | 43d | 1 | 0.30mi |
| 2109 Highland Ave Shreveport, LA | 3.0 | 1.0 | 1739 | $1,050 | $0.60 | 43d | 1 | 0.33mi |
| 419 Boulevard St Shreveport, LA | 3.0 | 2.0 | 1852 | $1,100 | $0.59 | 43d | 1 | 0.34mi |
| 642 Robinson Pl Shreveport, LA | 3.0 | 1.0 | 1500 | $1,275 | $0.85 | 21d | 1 | 0.69mi |
| 2506 Mecom Dr Shreveport, LA | 3.0 | 1.5 | 1433 | $1,350 | $0.94 | 13d | 1 | 1.00mi |
| 222 Stephenson St Shreveport, LA | 3.0 | 2.5 | 2642 | $2,000 | $0.76 | 21d | 1 | 1.04mi |
| 320 Stephenson St Shreveport, LA | 3.0 | 2.0 | 1845 | $1,675 | $0.91 | 21d | 1 | 1.05mi |
| 320 Stephenson St Shreveport, LA | 3.0 | 2.0 | 1845 | $1,675 | $0.91 | 13d | 1 | 1.05mi |
| 2615 Judith Pl Shreveport, LA | 3.0 | 2.0 | 1450 | $1,600 | $1.10 | 13d | 1 | 1.11mi |
| 3624 Gilbert Dr Shreveport, LA | 3.0 | 3.0 | 2088 | $1,900 | $0.91 | 43d | 1 | 1.27mi |
| 715 Camilla Dr Shreveport, LA | 3.0 | 1.0 | 1654 | $1,350 | $0.82 | 43d | 1 | 1.28mi |
| 2811 Samford Ave Shreveport, LA | 3.0 | 1.0 | 1612 | $850 | $0.53 | 13d | 1 | 1.43mi |
Listing history 24 events
-
2026-06-18days on market $169,900 Active 41 DOM
-
2026-06-17days on market $169,900 Active 40 DOM
-
2026-06-16days on market $169,900 Active 39 DOM
-
2026-06-15days on market $169,900 Active 38 DOM
-
2026-06-14days on market $169,900 Active 36 DOM
-
2026-06-13days on market $169,900 Active 35 DOM
-
2026-06-10days on market $169,900 Active 33 DOM
-
2026-06-09days on market $169,900 Active 32 DOM
-
2026-06-08days on market $169,900 Active 31 DOM
-
2026-06-07days on market $169,900 Active 30 DOM
-
2026-06-05days on market $169,900 Active 27 DOM
-
2026-06-03days on market $169,900 Active 26 DOM
-
2026-06-02days on market $169,900 Active 25 DOM
-
2026-06-01days on market $169,900 Active 24 DOM
-
2026-05-31days on market $169,900 Active 23 DOM
-
2026-05-30days on market $169,900 Active 22 DOM
-
2026-05-07$169,900 Active 581-char remark
-
2021-07-12soldstatus $120,000
-
2021-07-09soldstatus Sold 243-char remark
Show marketing remark (243 chars)
Low maintenance investment opportunity, both have large kitchens and separate dining rooms. Washer-Dryer hook ups in both units, there is an upstairs unit and a downstairs unit. Close to public transportation and convenient to the VA hospital.
-
2021-04-29status Pending 243-char remark
Show marketing remark (243 chars)
Low maintenance investment opportunity, both have large kitchens and separate dining rooms. Washer-Dryer hook ups in both units, there is an upstairs unit and a downstairs unit. Close to public transportation and convenient to the VA hospital.
-
2020-12-16$120,000 Active 243-char remark
Show marketing remark (243 chars)
Low maintenance investment opportunity, both have large kitchens and separate dining rooms. Washer-Dryer hook ups in both units, there is an upstairs unit and a downstairs unit. Close to public transportation and convenient to the VA hospital.
-
2007-07-09soldstatus
-
2007-03-22soldstatus
-
1994-10-31soldstatus
ⓘ Source: listings_history table (triggers on properties + properties_extension) + one-shot
backfill from property_details.listing_events for pre-trigger history.
Tax reassessment forecast LA · Resets to sale price
- Current annual tax
- $454 · $38/mo
- Projected year-2 tax
- $934 · $78/mo
- Expected delta
- +$480/yr (+$40/mo · 105.6%)
ⓘ Screening estimate from a state-policy table — verify with the county assessor before closing.
Climate risk First Street
- Flood 1/10 Low FEMA zone X (unshaded) · 0% chance over 30 yrs
- Wildfire 1/10 Low
- Heat 7/10 Severe 7 d/yr ≥110°F today · 22 d/yr by 30 yrs out
- Wind 6/10 Major 66% chance of damaging wind over 30 yrs
- Air quality 2/10 Low 1 unhealthy d/yr today · 2 by 30 yrs out
Nearby sold comps map
Loading sold comps map…
Walkable amenities ~0.75 mi
Loading nearby amenities…
Taxation est. · year 1
- Rental income
- $21,480
- − Mortgage interest
- −$9,517
- − Property taxes
- −$454
- − Insurance
- −$850
- − Repairs & maintenance
- −$1,718
- − Management
- −$1,718
- − Depreciation
- −$4,943
- Taxable income
- $2,280
- Est. tax owed @ 24.0%
- −$547
- After-tax cash flow
- $4,426/yr
For passive investors: Depreciation is non-cash, so a rental often shows a tax loss while cash-flowing — sheltering income. Rental losses are passive: they offset passive income freely, and up to $25,000/yr can offset ordinary (W-2) income if you actively participate and your MAGI is under $100k (phasing out to $0 by $150k); unused losses carry forward. On sale, claimed depreciation is recaptured at up to 25%, and gains may owe capital-gains tax (a 1031 exchange can defer both). Figures are a year-1 estimate at your 24.0% rate — not tax advice; consult a CPA.
Schools (NCES district)
- District
- Caddo Parish
- NCES district ID
- 2200300
- Math proficiency
- 21% ▼ -33.00%
- Reading proficiency
- 32% ▼ -30.00%
- Median HH income
- $39,227
- Composite
- 22.23/100
- National rank
- #8148
- State rank
- #53 of 98 in LA
Livability — Shreveport
- Score
- 59/100
- State rank
- #270
- US rank
- #19730
Category grades
Schools grade is shown separately in the Schools card above.
Census & demographics
- Census place
- Shreveport, LA
- County
- Caddo Parish · 178,536 people
- City population
- 164,123
- Metro
- Shreveport-Bossier City, LA
- Population (ZIP)
- 12,975
- Household income
- $56,833
- Rent vs Own
- Severe rent burden
- 759.0
Population outlook (Caddo County) Hauer SSP2
- Today (2025)
- 243,190 people
- By 2030
- 237,231 · -2.5%
- By 2040
- 222,502 · -8.5%
- By 2050
- 206,516 · -15.1%
- By 2075
- 165,706 · -31.9%
- By 2100
- 122,262 · -49.7%
Race, ethnicity, and origin ACS 2023
- Neighborhood character
- Diverse neighborhood (Simpson 0.63)
- Race & ethnicity
- White 53% Black 28% Two or more races 10% Hispanic / Latino 10% Asian 3%
- Hispanic origin (detail)
- Mexican 7%
- Common ancestry
- Slovak 6% Lithuanian 4% Scottish 2%
- Foreign-born
- 5% · Canada, Vietnam
- Languages at home
- 90% English-only · Spanish 5% French/Haitian/Cajun 1% Tagalog/Filipino 1%
Political lean MEDSL · Caddo
- 2024 margin
- Toss-up / Even · D 51.6% · R 47.0% · Other 1.4%
- 2008→2024 swing
- +1.6pp toward D · 2008: 3.0pp · 2024: 4.6pp
- All cycles
- 2024: D+4.6 2020: D+6.8 2016: D+4.2 2012: D+4.9 2008: D+3.0
Not yet ingested
- Civics
- —
Market trends
- HPI YoY
- ▼ -49.61%
- Current HPI
- 104.3781
- Rent YoY
- ▲ 3.56%
- Metro
- Shreveport-Bossier City, LA
- State GDP YoY
- ▲ 3.29%
- F500 in state
- 10
Industry mix (Fortune 500 HQ in LA)
| Industry | F500 HQs | Revenue |
|---|---|---|
| Telecommunications | 2 | $23B |
|
||
| Utilities | 1 | $12B |
|
||
| Wholesale / Distribution | 1 | $5B |
|
||
| Advertising | 1 | $2B |
|
||
Price history
+41.6% since first listed8 events — show timeline
- 2026-05-07 Listed $169,900 NTREIS
- 2021-07-12 Sold (Public Records) $120,000 Public Records
- 2021-07-09 Sold (MLS) — NTREIS
- 2021-04-29 Pending — NTREIS
- 2020-12-16 Listed $120,000 NTREIS
- 2007-07-09 Sold (Public Records) — Public Records
- 2007-03-22 Sold (Public Records) — Public Records
- 1994-10-31 Sold (Public Records) — Public Records
Property tax history
-1.6%/yrLatest (2025): $454 · +0.4% YoY. Source: county tax records.
Cash-flow waterfall
monthlySold comps — $/sqft
last 12 mo · ≤1 miLoading sold comps…