 🏗️ New Construction
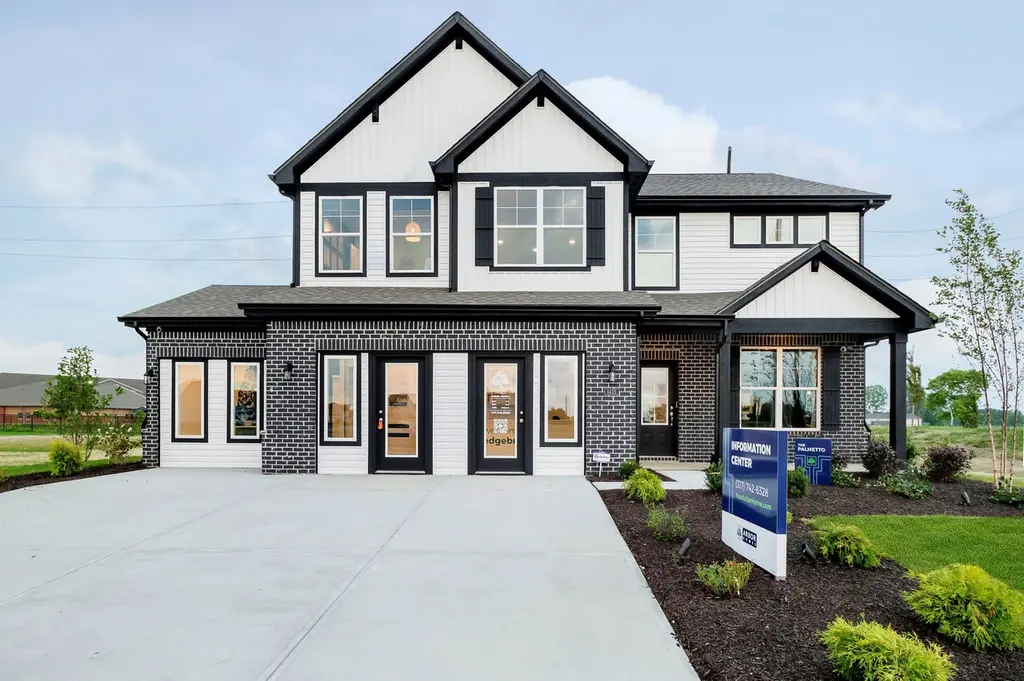
Palmetto Plan · South Bloomfield, OH
Flood risk No data
- FEMA flood zone
- —
- Chance of flooding over 30 yrs
- —
- Est. flood insurance / yr
- —
Fire risk No data
- Est. fire insurance / yr
- —
Heat risk No data
- Hot days now (above threshold)
- —
- Hot days in 30 yrs
- —
Wind risk No data
- Chance of severe wind over 30 yrs
- —
Air-quality risk No data
- Unhealthy air days now
- —
- Unhealthy air days in 30 yrs
- —
Risk factors via First Street. Map © Google.
Why this score? — see what drove the F grade
The composite is a weighted blend of 9 inputs, each scored 0–100. Each bar is that input's sub-score; the figure is the points it added to the 100-point composite (weight × sub-score).
- ARV discount +7.5/15.0
- Cash flow +6.1/30.0
- Schools +5.8/10.0
- Livability +3.8/5.0
- Rent growth +2.5/5.0
- Condition / age +2.5/5.0
- 1% rule +1.4/10.0
- DSCR +0.4/10.0
- Appreciation +0.0/10.0
$343,990
🖨 Deal sheet 📄 Offer letter ✓ Due diligence
Listing remarks MLS
Experience The Palmetto: space and functionality in perfect harmony. A grand living area awaits your customization, while the kitchen dazzles with its L-shaped design, walk-in pantry, and expansive island. Entertain in the great room or enjoy family meals in the adjacent café. Retreat to the study for quiet moments. Upstairs, find four bedrooms, including a lavish primary suite. With options for a fifth bedroom or versatile loft, embrace modern living at its finest.
Key facts
- 2 garage spots
- Listed 908 days
Neighborhood map
What this means for you Summary
Snapshot
- This is a 4-bed/2.5-bath single-family listed at $344k.
Deal economics
- At list price, monthly cash flow is $-743 ($-9k/yr) — negative.
- To cash-flow at today's rent, offer at most $289k (15.9% below list).
- To meet the 1% rule (rent ≥ 1% of price), the offer needs to be $253k (26.4% below list).
- Recommended offer: $253k (26.4% below list) — sets the bar for 1% rule.
Location & tenants
- Location reads 75/100 on livability (#263 in OH, #4,216 nationally) — a middle-class / working-renter tenant base. Strengths: crime A+, cost of living A+, housing A+; Watch: amenities F, commute F, health & safety F.
- Teays Valley Local (town): math 66% / reading 68% proficiency, ranked #166 of 656 in OH (top 25%) — acceptable for families but not a draw, mixed tenant base, ~2y average lease.
- Market conditions: 169 active listings in the ZIP; 1 comparable units currently listed for rent nearby; solid renter incomes; 312 units permitted in Pickaway County in 2024 (0 in 5+ unit buildings).
- This rent runs 36% of the median local income ($84k/yr) — at the standard rent-burdened threshold; future hikes will face affordability resistance.
Forward outlook
- Local home prices are declining (-3.0%/yr); year-one equity from $3k of loan paydown is wiped out by about $12k of value loss. Plan a longer hold.
- Pickaway County population projected at +3% by 2050 — modest demand growth; plan on rents tracking national, not racing it.
Negotiation context
- It's been on market 909 days — a 12% lower offer ($303k) is reasonable based on typical stale-listing flexibility.
- 2 sale attempts since 3y ago with the ask held roughly flat each time — persistent listings suggest the price (not the market) is what's stuck; bring a comps-based counter.
Questions for the listing agent
- What do current leases actually rent for vs. the listed asking? Can we see a recent rent roll and the last 12 months of T-12 income?
- It's been on market 909 days. Have you received any prior offers? Is the seller open to a 26% concession, seller financing, or rate buy-down credit?
- Why hasn't it sold? Are there any deal-killer items the seller is aware of (foundation, flood, title, zoning, code violations)?
- Is there a deadline driving the sale (1031 exchange, divorce, estate, relocation)? That informs how much negotiation room exists.
- Schools are A-rated — typically a magnet for longer-tenancy family renters. What's the average tenant stay here, and is there a school-zone premium baked into asking?
- The area grade is low — what's the realistic commute time and amenity access for the typical tenant pool here? Any planned neighborhood developments (good or bad) we should know about?
- What's the average days-on-market for RENTAL listings here right now (not sales)? A rising rental-DOM trend means longer vacancies and softer asking-rent achievability than the comps imply.
- What's the recent tenant-quality profile in this submarket — average credit score on applications, eviction rate, late-payment / NSF rate, and stable-employment percentage? A property-management company in the area should have these aggregated.
- How much new for-sale + rental construction is in the pipeline within 1–3 miles? Heavy new supply typically softens prices + rents 12–24 months out; constrained supply supports both.
Investment metrics
- 1% rule
- 0.64% ✗
- Cap rate
- 4.05%
- Cash-on-cash
- -8.02%
- DSCR
- 0.64
- GRM
- 13.1
CMA / ARV
- ARV (median comp)
- $396,825
- List price
- $343,990
- Delta
- -13.31%
- Verdict
- UNDERPRICED
- Comps
- 20 within 1.0 mi
Show comp detail 12 sales within ~0.75 mi
| Address | Dist | Beds/Ba | Sqft | Sold | Price | $/sf | Match |
|---|---|---|---|---|---|---|---|
| 5207 Apple Ln | 0.14mi | 4/2.5 | 2,416 (-6%) | 0mo | $417,770 | $173 | 82 |
| 5224 Apple Ln | 0.14mi | 4/3.0 | 2,457 (-5%) | 2mo | $399,940 | $163 | 82 |
| 5203 Apple Ln | 0.19mi | 4/2.5 | 2,448 (-5%) | 2mo | $424,990 | $174 | 81 |
| 5209 Apple Ln | 0.14mi | 4/2.5 | 2,816 (+9%) | 0mo | $486,872 | $173 | 78 |
| 62 Cider Mill Dr | 0.36mi | 5/3.0 (+1) | 2,600 (+1%) | 2mo | $396,802 | $153 | 73 |
| 5513 George Pl | 0.29mi | 4/2.5 | 2,272 (-12%) | 2mo | $431,664 | $190 | 65 |
| 287 Dowler Dr Lot 344 | 0.64mi | 4/2.5 | 2,670 (+4%) | 0mo | $409,900 | $154 | 64 |
| 274 Dowler Dr Lot 342 | 0.64mi | 4/2.5 | 2,670 (+4%) | 1mo | $397,900 | $149 | 63 |
| 123 Hutchison St | 0.59mi | 4/2.5 | 2,710 (+5%) | 2mo | $389,900 | $144 | 63 |
| 5440 Morning Glory St Lot 354 | 0.70mi | 4/2.5 | 2,337 (-9%) | 1mo | $389,900 | $167 | 51 |
| 334 Honeysuckle St Lot 326 | 0.75mi | 4/2.5 | 2,265 (-12%) | 1mo | $372,900 | $165 | 44 |
| 330 Honeysuckle St Lot 328 | 0.75mi | 4/2.5 | 2,264 (-12%) | 1mo | $372,900 | $165 | 44 |
Match score weights: distance 35% · size 25% · config 20% · recency 20%. Top-matched comps best support the ARV.
Projected returns pro-forma
-3.0% appreciation · 3.0% rent growth · sell at horizon
- IRR
- -30.4%
- Equity multiple
- -0.00×
- Total profit
- $-111,579
- Equity at exit
- $59,168
- IRR
- -32.3%
- Equity multiple
- -0.42×
- Total profit
- $-157,931
- Equity at exit
- $34,310
Cash invested: $111,111 (down + closing). Projections, not guarantees.
Landlord ↔ Tenant lean methodology
- Overall (STATE)
- 73 Landlord-Friendly
- State Ohio
- 73 Landlord-Friendly · R+6
- County
- — inherits STATE
- City
- — inherits STATE
ZIP-level market 43103
- Active inventory
- 169
- Price-to-rent
- 11.3×
Monthly cashflow live
- Estimated rent
- $2,531 medium interval (Pro) →
- Mortgage (P&I)
- −$2,081
- Tax est. 1.5%
- −$496 /mo · $5,952/yr
- Insurance
- −$165
- HOA
- −$0
- Vacancy / Maint / Mgmt
- −$532
- Net cashflow
- $-743
Break-even live
UW: 25.0% down · 7.5% · 30yr · 1.5% tax · 5.0% vac · 8.0% maint · 8.0% mgmt
Financing live
Cash to close
- Down payment
- $99,206
- Closing costs
- $11,905
- Reserves months
- —
- Total cash needed
- —
Loan-product check · same deal, 3 products live
Conventional
25% down · 7.5% · 30yr
- Down + closing
- —
- Monthly P&I
- —
- Monthly cashflow
- —
- DSCR
- —
- Eligible?
- —
Personal DTI + credit; lowest rate.
DSCR
20% down · 8.5% · 30yr
- Down + closing
- —
- Monthly P&I
- —
- Monthly cashflow
- —
- DSCR
- —
- Eligible?
- —
No personal income docs; deal must DSCR.
Hard money
10% down · 12.0% · 12mo
- Down + closing
- —
- Monthly P&I
- —
- Monthly cashflow
- —
- DSCR
- —
- Eligible?
- —
Short-term bridge; refi at stabilization.
Rent comps 1 comps
| Address | Beds | Baths | Sqft | Rent | $/sqft | DOM | Units | Dist |
|---|---|---|---|---|---|---|---|---|
| 110 Richard Ave South Bloomfield, OH | 4.0 | 2.5 | 1900 | $2,531 | $1.33 | 3d | 1 | 0.95mi |
Listing history 17 events
-
2026-06-18days on market $343,990 Active 909 DOM
-
2026-06-17days on market $343,990 Active 908 DOM
-
2026-06-16days on market $343,990 Active 907 DOM
-
2026-06-15days on market $343,990 Active 906 DOM
-
2026-06-13days on market $343,990 Active 904 DOM
-
2026-06-09days on market $343,990 Active 900 DOM
-
2026-06-08days on market $343,990 Active 899 DOM
-
2026-06-07days on market $343,990 Active 898 DOM
-
2026-06-03days on market $343,990 Active 894 DOM
-
2026-06-02days on market $343,990 Active 893 DOM
-
2026-06-01days on market $343,990 Active 892 DOM
-
2026-05-31days on market $343,990 Active 891 DOM
-
2024-05-22price $343,990 477-char remark
Show marketing remark (477 chars)
Experience The Palmetto: space and functionality in perfect harmony. A grand living area awaits your customization, while the kitchen dazzles with its L-shaped design, walk-in pantry, and expansive island. Entertain in the great room or enjoy family meals in the adjacent café. Retreat to the study for quiet moments. Upstairs, find four bedrooms, including a lavish primary suite. With options for a fifth bedroom or versatile loft, embrace modern living at its finest.
-
2024-01-04price $339,990 477-char remark
Show marketing remark (477 chars)
Experience The Palmetto: space and functionality in perfect harmony. A grand living area awaits your customization, while the kitchen dazzles with its L-shaped design, walk-in pantry, and expansive island. Entertain in the great room or enjoy family meals in the adjacent café. Retreat to the study for quiet moments. Upstairs, find four bedrooms, including a lavish primary suite. With options for a fifth bedroom or versatile loft, embrace modern living at its finest.
-
2024-01-04status Active 477-char remark
Show marketing remark (477 chars)
Experience The Palmetto: space and functionality in perfect harmony. A grand living area awaits your customization, while the kitchen dazzles with its L-shaped design, walk-in pantry, and expansive island. Entertain in the great room or enjoy family meals in the adjacent café. Retreat to the study for quiet moments. Upstairs, find four bedrooms, including a lavish primary suite. With options for a fifth bedroom or versatile loft, embrace modern living at its finest.
-
2024-01-03historical 477-char remark
Show marketing remark (477 chars)
Experience The Palmetto: space and functionality in perfect harmony. A grand living area awaits your customization, while the kitchen dazzles with its L-shaped design, walk-in pantry, and expansive island. Entertain in the great room or enjoy family meals in the adjacent café. Retreat to the study for quiet moments. Upstairs, find four bedrooms, including a lavish primary suite. With options for a fifth bedroom or versatile loft, embrace modern living at its finest.
-
2023-12-22$337,990 Active 477-char remark
Show marketing remark (477 chars)
Experience The Palmetto: space and functionality in perfect harmony. A grand living area awaits your customization, while the kitchen dazzles with its L-shaped design, walk-in pantry, and expansive island. Entertain in the great room or enjoy family meals in the adjacent café. Retreat to the study for quiet moments. Upstairs, find four bedrooms, including a lavish primary suite. With options for a fifth bedroom or versatile loft, embrace modern living at its finest.
ⓘ Source: listings_history table (triggers on properties + properties_extension) + one-shot
backfill from property_details.listing_events for pre-trigger history.
Nearby sold comps map
Loading sold comps map…
Walkable amenities ~0.75 mi
Loading nearby amenities…
Taxation est. · year 1
- Rental income
- $30,372
- − Mortgage interest
- −$22,228
- − Property taxes
- −$5,952
- − Insurance
- −$1,984
- − Repairs & maintenance
- −$2,430
- − Management
- −$2,430
- − Depreciation
- −$11,544
- Taxable loss
- −$16,196
- Est. tax savings @ 24.0%
- +$3,887
- After-tax cash flow
- $-5,027/yr
For passive investors: Depreciation is non-cash, so a rental often shows a tax loss while cash-flowing — sheltering income. Rental losses are passive: they offset passive income freely, and up to $25,000/yr can offset ordinary (W-2) income if you actively participate and your MAGI is under $100k (phasing out to $0 by $150k); unused losses carry forward. On sale, claimed depreciation is recaptured at up to 25%, and gains may owe capital-gains tax (a 1031 exchange can defer both). Figures are a year-1 estimate at your 24.0% rate — not tax advice; consult a CPA.
Schools (NCES district)
- District
- Teays Valley Local
- NCES district ID
- 3904909
- Math proficiency
- 66% ▼ -12.00%
- Reading proficiency
- 68% ▼ -10.00%
- Median HH income
- $64,637
- Composite
- 58.28/100
- National rank
- #1019
- State rank
- #166 of 656 in OH
Livability — South Bloomfield
- Score
- 75/100
- State rank
- #263
- US rank
- #4216
Category grades
Schools grade is shown separately in the Schools card above.
Census & demographics
- Census place
- South Bloomfield, OH
- County
- Pickaway · 57,589 people
- Metro
- Columbus, OH
- Population (ZIP)
- 12,981
- Household income
- $84,304
- Rent vs Own
- Severe rent burden
- 4.6
Population outlook (Pickaway County) Hauer SSP2
- Today (2025)
- 59,488 people
- By 2030
- 60,400 · +1.5%
- By 2040
- 61,498 · +3.4%
- By 2050
- 61,478 · +3.3%
- By 2075
- 59,696 · +0.3%
- By 2100
- 51,458 · -13.5%
Race, ethnicity, and origin ACS 2023
- Neighborhood character
- Predominantly White (94%)
- Race & ethnicity
- White 94% Two or more races 4% Hispanic / Latino 2%
- Common ancestry
- Italian 2% Slovak 2% Lithuanian 1%
- Foreign-born
- 1% · Canada
- Languages at home
- 99% English-only · Spanish 1%
Political lean MEDSL · Pickaway
- 2024 margin
- Solid R (+48.5) · D 25.3% · R 73.8%
- 2008→2024 swing
- -26.8pp toward R · 2008: -21.7pp · 2024: -48.5pp
- All cycles
- 2024: R+48.5 2020: R+47.0 2016: R+42.6 2012: R+18.7 2008: R+21.7
Not yet ingested
- Civics
- —
Market trends
- HPI YoY
- ▼ -137.66%
- Current HPI
- 241.2767
- Rent YoY
- —
- Metro
- —
- State GDP YoY
- ▲ 1.98%
- F500 in state
- 48
Industry mix (Fortune 500 HQ in OH)
| Industry | F500 HQs | Revenue |
|---|---|---|
| Insurance | 3 | $145B |
|
||
| Industrial Machinery | 3 | $49B |
|
||
| Financial Services | 3 | $24B |
|
||
| Consumer Goods | 2 | $93B |
|
||
| Aerospace / Defense | 2 | $47B |
|
||
| Utilities | 2 | $33B |
|
||
Price history
+1.8% since first listed5 events — show timeline
- 2024-05-22 Price Changed $343,990 Zillow
- 2024-01-04 Price Changed $339,990 Zillow
- 2024-01-04 Relisted — Zillow
- 2024-01-03 Delisted — Zillow
- 2023-12-22 Listed $337,990 Zillow
Cash-flow waterfall
monthlySold comps — $/sqft
last 12 mo · ≤1 miLoading sold comps…