104 John Walker Cir Unit A,B,C,D · Huntsville, AL
Flood risk 1/10 · Minimal
- FEMA flood zone
- X (unshaded)
- Chance of flooding over 30 yrs
- 0.0%
- Est. flood insurance / yr
- $507 – $1,088
Fire risk 3/10 · Minor
- Est. fire insurance / yr
- $916 – $1,700
Heat risk 5/10 · Moderate
- Hot days now (above 104°F)
- 6 days/yr
- Hot days in 30 yrs
- 17 days/yr
Wind risk 4/10 · Minor
- Chance of severe wind over 30 yrs
- 17.0%
Air-quality risk 2/10 · Minimal
- Unhealthy air days now
- 1 days/yr
- Unhealthy air days in 30 yrs
- 1 days/yr
Risk factors via First Street. Map © Google.
Why this score? — see what drove the F grade
The composite is a weighted blend of 9 inputs, each scored 0–100. Each bar is that input's sub-score; the figure is the points it added to the 100-point composite (weight × sub-score).
- ARV discount +7.5/15.0
- Livability +4.1/5.0
- Schools +3.7/10.0
- Rent growth +2.7/5.0
- Condition / age +2.2/5.0
- Cash flow +0.0/30.0
- 1% rule +0.0/10.0
- DSCR +0.0/10.0
- Appreciation +0.0/10.0
$755,000
🖨 Deal sheet 📄 Offer letter ✓ Due diligence
Listing remarks MLS
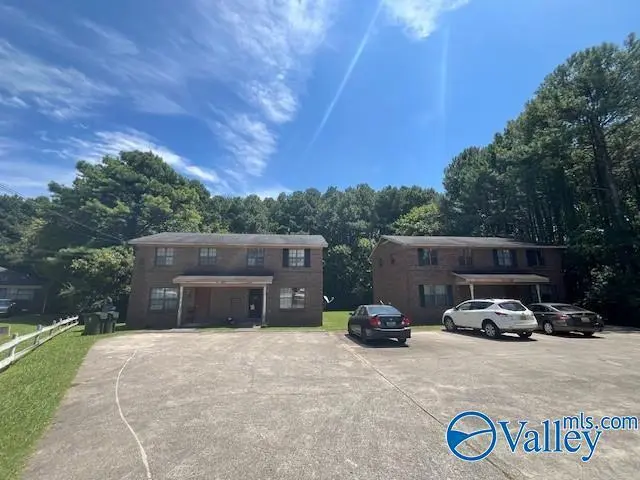
Great location near Madison Hospital, Toyota, Polaris, Redstone Arsenal, shopping and restaurants. Four 3 bedroom/2 bath townhomes in 2 full brick buildings. All units are occupied. 2 units have new carpet and new paint. Huge lot with room to build more units. Tenants pay all utilities and services. 48 hours notice to show - tenant occupied. Please do not disturb tenants.
Key facts
- 8 parking spots
- Built 1988
- Listed 674 days
Neighborhood map
What this means for you Summary
Snapshot
- This is a condo listed at $755k. Condition is rated fair.
Deal economics
- At list price, monthly cash flow is $-4k ($-45k/yr) — negative.
- To cash-flow at today's rent, offer at most $208k (72.5% below list).
- To meet the 1% rule (rent ≥ 1% of price), the offer needs to be $182k (75.9% below list).
- Recommended offer: $182k (75.9% below list) — sets the bar for 1% rule.
- Cap rate 0.3% vs local median 3.8% in Huntsville — below-typical yield; the buyer is paying a premium for something (appreciation thesis, condition, location) that the cap rate doesn't capture.
Location & tenants
- Location reads 82/100 on livability (#3 in AL, #1,082 nationally) — a professional / high-income tenant draw. Strengths: commute A+, cost of living A+, housing A+; Watch: crime F.
- Madison County (rural): math 27% / reading 56% proficiency, ranked #19 of 129 in AL (top 15%) — families likely to look elsewhere, expect single-tenant / working-renter base with shorter leases.
- Market conditions: Rents flat; 666 active listings in the ZIP; 10 comparable units currently listed for rent nearby; rentals at typical pace (median 24d on market — plan ~3-4 weeks tenant-placement turnaround); solid renter incomes; 4,709 units permitted in Madison County in 2024 (1,186 in 5+ unit buildings).
Forward outlook
- Local home prices are declining (-3.0%/yr); year-one equity from $5k of loan paydown is wiped out by about $23k of value loss. Plan a longer hold.
- Madison County population projected at +18% by 2050 — long-run rental-demand tailwind backs the buy-and-hold thesis.
Negotiation context
- It's been on market 674 days — a 12% lower offer ($664k) is reasonable based on typical stale-listing flexibility.
- 2 sale attempts since 2y ago; this cycle's ask has dropped $40k (5%) from the opening price — seller is motivated, your offer sets the floor, not the list.
Risks & watch-outs
- Climate carrying-cost: extreme-heat days projected 6→17/yr by 2055 (HVAC capex compounding) — expect insurance premiums to compound above CPI over the hold.
Questions for the listing agent
- What do current leases actually rent for vs. the listed asking? Can we see a recent rent roll and the last 12 months of T-12 income?
- It's been on market 674 days. Have you received any prior offers? Is the seller open to a 76% concession, seller financing, or rate buy-down credit?
- Have any recent inspections been done? Can we get a copy of the seller's disclosures and any deferred-maintenance estimates?
- Any open or pending special assessments — roof, HVAC, plumbing, elevator, façade? What's the per-unit balance and payoff schedule, and is the seller paying it off at close or rolling it to the buyer?
- Why hasn't it sold? Are there any deal-killer items the seller is aware of (foundation, flood, title, zoning, code violations)?
- Is there a deadline driving the sale (1031 exchange, divorce, estate, relocation)? That informs how much negotiation room exists.
- Crime grade is F in this area — have there been break-ins, vandalism, or insurance claims at this property in the last 3 years? What carrier currently insures it and at what premium?
- The area grade is low — what's the realistic commute time and amenity access for the typical tenant pool here? Any planned neighborhood developments (good or bad) we should know about?
- What's the average days-on-market for RENTAL listings here right now (not sales)? A rising rental-DOM trend means longer vacancies and softer asking-rent achievability than the comps imply.
- What's the recent tenant-quality profile in this submarket — average credit score on applications, eviction rate, late-payment / NSF rate, and stable-employment percentage? A property-management company in the area should have these aggregated.
- How much new apartment / multifamily construction is in the pipeline within 1–3 miles? Heavy new supply (>2% of stock underway) typically softens rents 12–24 months out; light construction supports rent growth.
Investment metrics
- 1% rule
- 0.24% ✗
- Cap rate
- 0.28%
- Cash-on-cash
- -21.46%
- DSCR
- 0.05
- GRM
- 34.6
CMA / ARV
No comps found within radius.
Projected returns pro-forma
-3.0% appreciation · 0.81% rent growth · sell at horizon
- IRR
- -63.5%
- Equity multiple
- -0.74×
- Total profit
- $-367,056
- Equity at exit
- $112,573
- IRR
- —
- Equity multiple
- -2.05×
- Total profit
- $-645,007
- Equity at exit
- $65,279
Cash invested: $211,400 (down + closing). Projections, not guarantees.
Landlord ↔ Tenant lean methodology
- Overall (STATE)
- 90 Strongly Landlord-Friendly
- State Alabama
- 90 Strongly Landlord-Friendly · R+15
- County
- — inherits STATE
- City
- — inherits STATE
ZIP-level market 35749
- Home prices YoY
- -5.4%
- Rents YoY
- 0.8%
- Active inventory
- 666
- Price-to-rent
- 34.6×
Monthly cashflow live
- Estimated rent
- $1,818 high interval (Pro) →
- Mortgage (P&I)
- −$3,959
- Tax est. 1.5%
- −$944 /mo · $11,325/yr
- Insurance
- −$315
- HOA
- −$0
- Vacancy / Maint / Mgmt
- −$382
- Net cashflow
- $-3,781
Break-even live
UW: 25.0% down · 7.5% · 30yr · 1.5% tax · 5.0% vac · 8.0% maint · 8.0% mgmt
Financing live
Cash to close
- Down payment
- $188,750
- Closing costs
- $22,650
- Reserves months
- —
- Total cash needed
- —
Loan-product check · same deal, 3 products live
Conventional
25% down · 7.5% · 30yr
- Down + closing
- —
- Monthly P&I
- —
- Monthly cashflow
- —
- DSCR
- —
- Eligible?
- —
Personal DTI + credit; lowest rate.
DSCR
20% down · 8.5% · 30yr
- Down + closing
- —
- Monthly P&I
- —
- Monthly cashflow
- —
- DSCR
- —
- Eligible?
- —
No personal income docs; deal must DSCR.
Hard money
10% down · 12.0% · 12mo
- Down + closing
- —
- Monthly P&I
- —
- Monthly cashflow
- —
- DSCR
- —
- Eligible?
- —
Short-term bridge; refi at stabilization.
Rent comps 10 comps
| Address | Beds | Baths | Sqft | Rent | $/sqft | DOM | Units | Dist |
|---|---|---|---|---|---|---|---|---|
| 100 Gibbon Dr Harvest, AL | 3.0 | 2.0 | 1500 | $1,625 | $1.08 | 44d | 1 | 0.26mi |
| 117 Water Oak Ct Harvest, AL | 3.0 | 2.0 | 1400 | $1,650 | $1.18 | 43d | 1 | 0.53mi |
| 115 Sabel Cir Madison, AL | 3.0 | 2.5 | 1412 | $1,698 | $1.20 | 13d | 1 | 0.68mi |
| 30000 Abbeywood Ln Harvest, AL | 3.0 | 2.0 | 1618 | $1,600 | $0.99 | 23d | 1 | 1.08mi |
| 7403 Wall Triana Hwy Madison, AL | 3.0 | 2.0 | 1512 | $1,495 | $0.99 | 23d | 1 | 1.09mi |
| 29889 Glenrose Way Harvest, AL | 3.0 | 2.0 | 1670 | $1,600 | $0.96 | 23d | 1 | 1.20mi |
| 15881 Elaine Ct Unit 1250617P Harvest, AL | 3.0 | 2.0 | 2497 | $4,891 | $1.96 | 13d | 1 | 1.32mi |
| 324 Willow Oak Dr Harvest, AL | 3.0 | 2.0 | 1226 | $1,850 | $1.51 | 13d | 1 | 1.33mi |
| 17439 Morgan Dr Harvest, AL | 3.0 | 2.0 | 1193 | $1,550 | $1.30 | 21d | 1 | 1.38mi |
| 113 Suffolk Dr Madison, AL | 3.0 | 2.0 | 1453 | $1,800 | $1.24 | 43d | 1 | 1.49mi |
HOA detail condo
- Monthly dues
- $0 · $0/yr
- Assessments
- None detected in remarks — confirm with the listing agent.
Listing history 17 events
-
2026-06-18days on market $755,000 Active 674 DOM
-
2026-06-17days on market $755,000 Active 673 DOM
-
2026-06-16days on market $755,000 Active 672 DOM
-
2026-06-15days on market $755,000 Active 671 DOM
-
2026-06-14days on market $755,000 Active 669 DOM
-
2026-06-10days on market $755,000 Active 666 DOM
-
2026-06-09days on market $755,000 Active 665 DOM
-
2026-06-08days on market $755,000 Active 664 DOM
-
2026-06-07days on market $755,000 Active 663 DOM
-
2026-06-02days on market $755,000 Active 658 DOM
-
2026-06-01days on market $755,000 Active 657 DOM
-
2026-05-31days on market $755,000 Active 656 DOM
-
2026-05-30days on market $755,000 Active 655 DOM
-
2025-03-23price $755,000 381-char remark
Show marketing remark (381 chars)
Great location near Madison Hospital, Toyota, Polaris, Redstone Arsenal, shopping and restaurants. Four 3 bedroom/2 bath townhomes in 2 full brick buildings. All units are occupied. 2 units have new carpet and new paint. Huge lot with room to build more units. Tenants pay all utilities and services. 48 hours notice to show - tenant occupied. Please do not disturb tenants.
-
2024-08-13$795,000 Active 381-char remark
Show marketing remark (381 chars)
Great location near Madison Hospital, Toyota, Polaris, Redstone Arsenal, shopping and restaurants. Four 3 bedroom/2 bath townhomes in 2 full brick buildings. All units are occupied. 2 units have new carpet and new paint. Huge lot with room to build more units. Tenants pay all utilities and services. 48 hours notice to show - tenant occupied. Please do not disturb tenants.
-
2024-06-14historical $995
-
2024-06-02$995
ⓘ Source: listings_history table (triggers on properties + properties_extension) + one-shot
backfill from property_details.listing_events for pre-trigger history.
Climate risk First Street
- Flood 1/10 Low FEMA zone X (unshaded) · 0% chance over 30 yrs
- Wildfire 3/10 Moderate
- Heat 5/10 Major 6 d/yr ≥104°F today · 17 d/yr by 30 yrs out
- Wind 4/10 Moderate 17% chance of damaging wind over 30 yrs
- Air quality 2/10 Low 1 unhealthy d/yr today · 1 by 30 yrs out
Nearby sold comps map
Loading sold comps map…
Walkable amenities ~0.75 mi
Loading nearby amenities…
Taxation est. · year 1
- Rental income
- $21,821
- − Mortgage interest
- −$42,292
- − Property taxes
- −$11,325
- − Insurance
- −$3,775
- − Repairs & maintenance
- −$1,746
- − Management
- −$1,746
- − Depreciation
- −$21,964
- Taxable loss
- −$61,026
- Est. tax savings @ 24.0%
- +$14,646
- After-tax cash flow
- $-30,727/yr
For passive investors: Depreciation is non-cash, so a rental often shows a tax loss while cash-flowing — sheltering income. Rental losses are passive: they offset passive income freely, and up to $25,000/yr can offset ordinary (W-2) income if you actively participate and your MAGI is under $100k (phasing out to $0 by $150k); unused losses carry forward. On sale, claimed depreciation is recaptured at up to 25%, and gains may owe capital-gains tax (a 1031 exchange can defer both). Figures are a year-1 estimate at your 24.0% rate — not tax advice; consult a CPA.
Condition & rehab AI · 1 photo
A moderate rehab is needed to address exterior and interior wear, with painting being the highest-ROI update for both resale and rental value.
Repairs flagged
- Minor exterior brick — Weathered appearance
- Minor interior walls/paint — No visible damage
Value-add opportunities
- Both paint exterior — Enhances curb appeal and resale value
- Both paint interior walls — Improves interior appearance and rental appeal
Renovation cost estimate screening
| Repair item | Severity | Est. cost |
|---|---|---|
| exterior brick · Weathered appearance | Minor | $500–3,000 |
| interior walls/paint · No visible damage | Minor | $500–3,000 |
| Total estimated repair cost · 2 items | $1,000–6,000 |
Value-add ROI direction
- Both paint exterior — Enhances curb appeal and resale value ↑
- Both paint interior walls — Improves interior appearance and rental appeal ↑
ⓘ Cost ranges are severity-bucket heuristics (US national rule-of-thumb). Get contractor quotes + a written scope before underwriting a rehab budget.
Schools (NCES district)
- District
- Madison County
- NCES district ID
- 0102220
- Math proficiency
- 27% ▼ -32.00%
- Reading proficiency
- 56% ▼ -1.00%
- Median HH income
- $66,058
- Composite
- 37.15/100
- National rank
- #4483
- State rank
- #19 of 129 in AL
Livability — Huntsville
- Score
- 82/100
- State rank
- #3
- US rank
- #1082
Category grades
Schools grade is shown separately in the Schools card above.
Census & demographics
- County
- Madison County · 380,832 people
- City population
- 220,435
- Metro
- Huntsville, AL
- Population (ZIP)
- 30,710
- Household income
- $103,901
- Rent vs Own
- Severe rent burden
- 174.0
Population outlook (Madison County) Hauer SSP2
- Today (2025)
- 392,086 people
- By 2030
- 409,788 · +4.5%
- By 2040
- 440,557 · +12.4%
- By 2050
- 460,990 · +17.6%
- By 2075
- 502,872 · +28.3%
- By 2100
- 513,623 · +31.0%
Race, ethnicity, and origin ACS 2023
- Neighborhood character
- Diverse neighborhood (Simpson 0.56)
- Race & ethnicity
- White 60% Black 29% Two or more races 7% Hispanic / Latino 4% Asian 2%
- Common ancestry
- Italian 2% Slovak 1% Serbian 1%
- Foreign-born
- 3% · Canada, South Korea
- Languages at home
- 95% English-only · Spanish 3% Korean 1% Other Indo-European 1%
Political lean MEDSL · Madison
- 2024 margin
- Lean R (+9.0) · D 44.7% · R 53.7% · Other 1.6%
- 2008→2024 swing
- +6.0pp toward D · 2008: -14.9pp · 2024: -9.0pp
- All cycles
- 2024: R+9.0 2020: R+8.0 2016: R+16.8 2012: R+18.7 2008: R+14.9
Not yet ingested
- Civics
- —
Market trends
- HPI YoY
- ▼ -16.54%
- Current HPI
- 291.1184
- Rent YoY
- ▲ 0.81%
- Metro
- Huntsville, AL
- State GDP YoY
- ▲ 2.94%
- F500 in state
- 4
Industry mix (Fortune 500 HQ in AL)
| Industry | F500 HQs | Revenue |
|---|---|---|
| Financial Services | 1 | $8B |
|
||
| Healthcare | 1 | $5B |
|
||
Price history
-5.0% since first listed4 events — show timeline
- 2025-03-23 Price Changed $755,000 VMLS
- 2024-08-13 Listed $795,000 VMLS
- 2024-06-14 Rental Removed $995 VMLS
- 2024-06-02 Listed for Rent $995 VMLS
Cash-flow waterfall
monthlySold comps — $/sqft
last 12 mo · ≤1 miLoading sold comps…