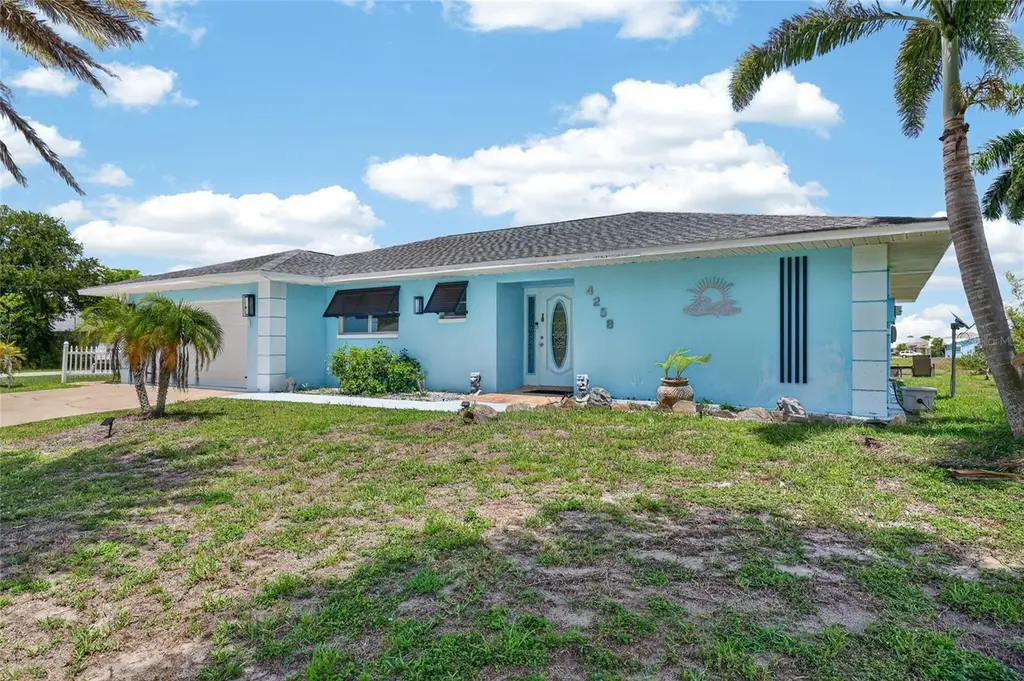
4258 Gillot Blvd · North Port, FL
Flood risk 8/10 · Major
- FEMA flood zone
- X (shaded)
- Chance of flooding over 30 yrs
- 0.97%
- Est. flood insurance / yr
- $507 – $1,088
Fire risk 4/10 · Minor
- Est. fire insurance / yr
- $947 – $1,759
Heat risk 10/10 · Severe
- Hot days now (above 107°F)
- 7 days/yr
- Hot days in 30 yrs
- 28 days/yr
Wind risk 10/10 · Severe
- Chance of severe wind over 30 yrs
- 99.0%
Air-quality risk 3/10 · Minor
- Unhealthy air days now
- 2 days/yr
- Unhealthy air days in 30 yrs
- 3 days/yr
Risk factors via First Street. Map © Google.
Why this score? — see what drove the B- grade
The composite is a weighted blend of 9 inputs, each scored 0–100. Each bar is that input's sub-score; the figure is the points it added to the 100-point composite (weight × sub-score).
- Cash flow +23.2/30.0
- ARV discount +15.0/15.0
- DSCR +7.5/10.0
- 1% rule +4.9/10.0
- Schools +4.6/10.0
- Rent growth +3.8/5.0
- Livability +3.8/5.0
- Condition / age +2.5/5.0
- Appreciation +0.0/10.0
$250,000
🖨 Deal sheet 📄 Offer letter ✓ Due diligence
Listing remarks MLS
Priced and primed for renovation this ranch has views of the canal! Although it's not on the water, and does not offer boating access, there is a community boat ramp just minutes away. The large two car garage could house a small boat or a couple jetskis. Screened lanai is the perfect size for a hot tub. Lots of potential here for a handy buyer, the demo inside has already been done for you. Minutes to Gulf Beaches, Golf, Shopping and more! Perfect for a construction rehab loan where your improvements are built into the loan. See your loan professional for details.
Key facts
- Newer plank tile
- Canal view
- Open floorplan
Tags
Property features AI
Finance
- Other: Canal water view; Property listed as residential single-family; Unfurnished
- HOA & community: No association; Pets allowed
Exterior
- Parking: Attached, oversized 2-car garage (21 x 26) with garage door opener; Driveway
- Utilities: Public water; Public sewer; Electricity connected
- Home design: Single-family residence; One story; Faces northwest; Residential zoning (RSF3.5); Homestead exempt
- Construction: Block and stucco construction; Shingle roof; Slab foundation; Built on a 0.24-acre lot
- Exterior features: Sliding doors; Mature landscaping with trees
Interior
- Kitchen: Eat-in kitchen; Stone counters; Other appliances included
- Bedrooms: 3 bedrooms
- Flooring: Ceramic tile
- Bathrooms: 2 full bathrooms
- Heating & cooling: Central heating (electric); Central air conditioning
- Interior features: Ceiling fans; Eat-in kitchen; Living room/dining room combo; Open floorplan; Split-bedroom layout; Stone counters; Thermostat; Walk-in closets; Blinds on windows
- Laundry & utility: Inside laundry room
Neighborhood map
What this means for you Summary
Snapshot
- This is a 3-bed/2.0-bath single-family listed at $250k.
Deal economics
- At list price, monthly cash flow is $389 ($5k/yr) — positive.
- The deal already cash-flows at list — no discount required.
- To meet the 1% rule (rent ≥ 1% of price), the offer needs to be $247k (1.2% below list).
- Recommended offer: $247k (1.2% below list) — sets the bar for 1% rule.
- Cap rate 8.5% vs local median 3.6% in North Port — top-decile yield for the area; either an underpriced asset or a hidden risk that comps aren't pricing in. Stress-test before assuming the spread holds.
Location & tenants
- Location reads 75/100 on livability (#252 in FL, #3,975 nationally) — a middle-class / working-renter tenant base. Strengths: crime A+, housing A+, health & safety A+; Watch: amenities F, commute F.
- Charlotte (suburban): math 54% / reading 54% proficiency, ranked #22 of 73 in FL (top 30%) — acceptable for families but not a draw, mixed tenant base, ~2y average lease.
- Zoned schools: Myakka River Elementary School (math 65% / reading 60%, grade B, #601 of 2,144 statewide, top 28%, 608 students, 51% FRL); Lemon Bay High School (math 50% / reading 56%, grade C-, #148 of 667 statewide, top 23%, 1,360 students, 28% FRL).
- Market conditions: Rents rising fast (+5.3%/yr); 2188 active listings in the ZIP; 12 comparable units currently listed for rent nearby; rentals at typical pace (median 21d on market — plan ~3-4 weeks tenant-placement turnaround); solid renter incomes; 4,585 units permitted in Charlotte County in 2024 (703 in 5+ unit buildings).
- This rent runs 35% of the median local income ($84k/yr) — at the standard rent-burdened threshold; future hikes will face affordability resistance.
Forward outlook
- Local home prices are declining (-3.0%/yr); year-one equity from $2k of loan paydown is wiped out by about $8k of value loss. Plan a longer hold.
- Charlotte County population projected at +24% by 2050 — long-run rental-demand tailwind backs the buy-and-hold thesis.
Negotiation context
- Only 6 days on market — expect competitive offers; lowballing is unlikely to land.
- 3 sale attempts since 22y ago with the ask held roughly flat each time — persistent listings suggest the price (not the market) is what's stuck; bring a comps-based counter.
- Current owner paid $50k; list at $250k implies a 400% gain — meaningful room to come down on a strong offer.
Risks & watch-outs
- Watch-outs: flood insurance adds $66/mo.
- Climate carrying-cost: severe flood risk; severe wind risk, 99% chance of damaging wind over 30y; extreme-heat days projected 7→28/yr by 2055 (HVAC capex compounding) — expect insurance premiums to compound above CPI over the hold.
Questions for the listing agent
- Built in 1978 — when were the roof, HVAC, electrical panel, plumbing, and water heater last replaced?
- What's the actual annual flood-insurance premium (NFIP or private), and is the property in a SFHA with mandatory coverage?
- Is there a deadline driving the sale (1031 exchange, divorce, estate, relocation)? That informs how much negotiation room exists.
- Schools are B-rated — typically a magnet for longer-tenancy family renters. What's the average tenant stay here, and is there a school-zone premium baked into asking?
- What's the average days-on-market for RENTAL listings here right now (not sales)? A rising rental-DOM trend means longer vacancies and softer asking-rent achievability than the comps imply.
- What's the recent tenant-quality profile in this submarket — average credit score on applications, eviction rate, late-payment / NSF rate, and stable-employment percentage? A property-management company in the area should have these aggregated.
- How much new for-sale + rental construction is in the pipeline within 1–3 miles? Heavy new supply typically softens prices + rents 12–24 months out; constrained supply supports both.
Investment metrics
- 1% rule
- 0.99% ✗
- Cap rate
- 8.48%
- Cash-on-cash
- 7.80%
- DSCR
- 1.35
- GRM
- 8.4
CMA / ARV
- ARV (on-the-fly)
- $315,868
- Comps found
- 11
Show comp detail 11 sales within ~0.75 mi
| Address | Dist | Beds/Ba | Sqft | Sold | Price | $/sf | Match |
|---|---|---|---|---|---|---|---|
| 12202 Moore Ct | 0.17mi | 3/2.0 | 1,648 (+6%) | 2mo | $334,900 | $203 | 81 |
| 4340 Kennel St | 0.18mi | 3/2.0 | 1,640 (+5%) | 7mo | $290,000 | $177 | 77 |
| 4240 Elvington Rd | 0.22mi | 3/2.0 | 1,650 (+6%) | 19mo | $329,900 | $200 | 64 |
| 4200 Hollybrook St | 0.22mi | 3/2.0 | 1,663 (+7%) | 19mo | $329,900 | $198 | 63 |
| 4510 Burns Ter | 0.49mi | 3/2.0 | 1,631 (+5%) | 11mo | $447,000 | $274 | 59 |
| 4186 Attaway Ln | 0.26mi | 3/2.0 | 1,648 (+6%) | 23mo | $385,000 | $234 | 59 |
| 12075 Duval Blvd | 0.66mi | 3/2.0 | 1,524 (-2%) | 14mo | $425,000 | $279 | 54 |
| 4584 Opel Ter | 0.59mi | 3/2.0 | 1,550 (-0%) | 22mo | $302,990 | $195 | 53 |
| 12199 Storke Ave | 0.50mi | 3/2.0 | 1,687 (+8%) | 15mo | $329,000 | $195 | 50 |
| 4375 Callaway St | 0.53mi | 4/2.5 (+1) | 1,695 (+9%) | 6mo | $349,000 | $206 | 49 |
| 5113 Kennel St | 0.75mi | 2/2.0 (-1) | 1,329 (-15%) | 4mo | $315,000 | $237 | 32 |
Match score weights: distance 35% · size 25% · config 20% · recency 20%. Top-matched comps best support the ARV.
Projected returns pro-forma
-3.0% appreciation · 5.29% rent growth · sell at horizon
- IRR
- -3.7%
- Equity multiple
- 0.86×
- Total profit
- $-9,996
- Equity at exit
- $37,276
- IRR
- 8.2%
- Equity multiple
- 1.69×
- Total profit
- $47,956
- Equity at exit
- $21,615
Cash invested: $70,000 (down + closing). Projections, not guarantees.
Landlord ↔ Tenant lean methodology
- Overall (STATE)
- 87 Strongly Landlord-Friendly
- State Florida
- 87 Strongly Landlord-Friendly · R+3
- County
- — inherits STATE
- City
- — inherits STATE
ZIP-level market 33981
- Home prices YoY
- -7.5%
- Rents YoY
- 5.3%
- Active inventory
- 2188
- Price-to-rent
- 8.4×
Monthly cashflow live
- Estimated rent
- $2,471 high interval (Pro) →
- Mortgage (P&I)
- −$1,311
- Tax from tax record
- −$82 /mo · $981/yr
- Insurance
- −$104
- Flood insurance flood zone
- −$66 /mo · $798/yr
- HOA
- −$0
- Vacancy / Maint / Mgmt
- −$519
- Net cashflow
- $389
Break-even live
UW: 25.0% down · 7.5% · 30yr · 1.5% tax · 5.0% vac · 8.0% maint · 8.0% mgmt
Financing live
Cash to close
- Down payment
- $62,500
- Closing costs
- $7,500
- Reserves months
- —
- Total cash needed
- —
Loan-product check · same deal, 3 products live
Conventional
25% down · 7.5% · 30yr
- Down + closing
- —
- Monthly P&I
- —
- Monthly cashflow
- —
- DSCR
- —
- Eligible?
- —
Personal DTI + credit; lowest rate.
DSCR
20% down · 8.5% · 30yr
- Down + closing
- —
- Monthly P&I
- —
- Monthly cashflow
- —
- DSCR
- —
- Eligible?
- —
No personal income docs; deal must DSCR.
Hard money
10% down · 12.0% · 12mo
- Down + closing
- —
- Monthly P&I
- —
- Monthly cashflow
- —
- DSCR
- —
- Eligible?
- —
Short-term bridge; refi at stabilization.
Rent comps 12 comps
| Address | Beds | Baths | Sqft | Rent | $/sqft | DOM | Units | Dist |
|---|---|---|---|---|---|---|---|---|
| 12884 Bacchus Rd Port Charlotte, FL | 3.0 | 2.0 | 1092 | $2,300 | $2.11 | 21d | 1 | 0.07mi |
| 12174 Terkelsen Ave Port Charlotte, FL | 3.0 | 2.0 | 1400 | $3,200 | $2.29 | 21d | 1 | 0.32mi |
| 12032 Edwards Rd Port Charlotte, FL | 3.0 | 2.0 | 1723 | $1,869 | $1.08 | 13d | 1 | 0.47mi |
| 3595 Gillot Blvd Port Charlotte, FL | 3.0 | 2.0 | 1612 | $1,766 | $1.10 | 13d | 1 | 0.48mi |
| 4154 Jennings Blvd Port Charlotte, FL | 3.0 | 2.0 | 1554 | $3,900 | $2.51 | 21d | 1 | 0.53mi |
| 3522 Gillot Blvd Port Charlotte, FL | 4.0 | 2.0 | 1499 | $1,799 | $1.20 | 21d | 1 | 0.62mi |
| 5311 Levy Ln Port Charlotte, FL | 3.0 | 2.0 | 1192 | $1,850 | $1.55 | 13d | 1 | 1.14mi |
| 6464 David Blvd Port Charlotte, FL | 3.0 | 2.0 | 1613 | $1,716 | $1.06 | 21d | 1 | 1.16mi |
| 12129 Grosspoint Ave Port Charlotte, FL | 3.0 | 2.0 | 1388 | $2,300 | $1.66 | 21d | 1 | 1.38mi |
| 5496 Brussels Ter Port Charlotte, FL | 3.0 | 2.0 | 1400 | $3,900 | $2.79 | 21d | 1 | 1.39mi |
| 5498 Montego Ln Port Charlotte, FL | 2.0 | 2.0 | 1070 | $1,695 | $1.58 | 21d | 1 | 1.40mi |
| 4604 Club Dr Port Charlotte, FL | 3.0 | 2.0 | 2041 | $2,795 | $1.37 | 21d | 1 | 1.43mi |
Listing history 11 events
-
2026-06-01statusdays on market $250,000 Pending 6 DOM
-
2026-05-31days on market $250,000 Active 5 DOM
-
2026-05-30days on market $250,000 Active 4 DOM
-
2026-05-26$250,000 Active
-
2012-01-31soldstatus $50,000 573-char remark
Show marketing remark (573 chars)
Priced and primed for renovation this ranch has views of the canal! Although it's not on the water, and does not offer boating access, there is a community boat ramp just minutes away. The large two car garage could house a small boat or a couple jetskis. Screened lanai is the perfect size for a hot tub. Lots of potential here for a handy buyer, the demo inside has already been done for you. Minutes to Gulf Beaches, Golf, Shopping and more! Perfect for a construction rehab loan where your improvements are built into the loan. See your loan professional for details.
-
2011-09-21$55,000 573-char remark
Show marketing remark (573 chars)
Priced and primed for renovation this ranch has views of the canal! Although it's not on the water, and does not offer boating access, there is a community boat ramp just minutes away. The large two car garage could house a small boat or a couple jetskis. Screened lanai is the perfect size for a hot tub. Lots of potential here for a handy buyer, the demo inside has already been done for you. Minutes to Gulf Beaches, Golf, Shopping and more! Perfect for a construction rehab loan where your improvements are built into the loan. See your loan professional for details.
-
2004-10-05soldstatus $196,900
-
2004-09-17soldstatus $196,900 136-char remark
Show marketing remark (136 chars)
* Beautiful Water View * Large corner lot, neat, clean, new carpet and tile, new Jacuzzi! Boat ramp community, Just Move In! E# 1562
-
2004-04-06$199,900 136-char remark
Show marketing remark (136 chars)
* Beautiful Water View * Large corner lot, neat, clean, new carpet and tile, new Jacuzzi! Boat ramp community, Just Move In! E# 1562
-
2001-04-23soldstatus $79,900
-
2001-03-02soldstatus $76,000
ⓘ Source: listings_history table (triggers on properties + properties_extension) + one-shot
backfill from property_details.listing_events for pre-trigger history.
Tax reassessment forecast FL · Resets to sale price
- Current annual tax
- $981 · $82/mo
- Projected year-2 tax
- $2,075 · $173/mo
- Expected delta
- +$1,094/yr (+$91/mo · 111.6%)
ⓘ Screening estimate from a state-policy table — verify with the county assessor before closing.
Climate risk First Street
- Flood 8/10 Severe FEMA zone X (shaded) · 97% chance over 30 yrs
- Wildfire 4/10 Moderate
- Heat 10/10 Extreme 7 d/yr ≥107°F today · 28 d/yr by 30 yrs out
- Wind 10/10 Extreme 99% chance of damaging wind over 30 yrs
- Air quality 3/10 Moderate 2 unhealthy d/yr today · 3 by 30 yrs out
Nearby sold comps map
Loading sold comps map…
Walkable amenities ~0.75 mi
Loading nearby amenities…
Taxation est. · year 1
- Rental income
- $29,651
- − Mortgage interest
- −$14,004
- − Property taxes
- −$981
- − Insurance
- −$2,048
- − Repairs & maintenance
- −$2,372
- − Management
- −$2,372
- − Depreciation
- −$7,273
- Taxable income
- $602
- Est. tax owed @ 24.0%
- −$145
- After-tax cash flow
- $4,520/yr
For passive investors: Depreciation is non-cash, so a rental often shows a tax loss while cash-flowing — sheltering income. Rental losses are passive: they offset passive income freely, and up to $25,000/yr can offset ordinary (W-2) income if you actively participate and your MAGI is under $100k (phasing out to $0 by $150k); unused losses carry forward. On sale, claimed depreciation is recaptured at up to 25%, and gains may owe capital-gains tax (a 1031 exchange can defer both). Figures are a year-1 estimate at your 24.0% rate — not tax advice; consult a CPA.
Schools (NCES district)
- District
- Charlotte
- NCES district ID
- 1200240
- Math proficiency
- 54% ▼ -6.00%
- Reading proficiency
- 54% ▼ -1.00%
- Median HH income
- $44,864
- Composite
- 45.62/100
- National rank
- #2586
- State rank
- #22 of 73 in FL
Livability — North Port
- Score
- 75/100
- State rank
- #252
- US rank
- #3975
Category grades
Schools grade is shown separately in the Schools card above.
Census & demographics
- County
- Charlotte County · 196,994 people
- City population
- 75,324
- Metro
- Punta Gorda, FL
- Population (ZIP)
- 15,622
- Household income
- $84,098
- Rent vs Own
- Severe rent burden
- 105.0
Population outlook (Charlotte County) Hauer SSP2
- Today (2025)
- 198,646 people
- By 2030
- 210,507 · +6.0%
- By 2040
- 230,857 · +16.2%
- By 2050
- 247,148 · +24.4%
- By 2075
- 281,777 · +41.8%
- By 2100
- 293,609 · +47.8%
Race, ethnicity, and origin ACS 2023
- Neighborhood character
- Predominantly White (89%)
- Race & ethnicity
- White 89% Two or more races 4% Hispanic / Latino 4% Black 2% Asian 1%
- Common ancestry
- Romanian 4% Lithuanian 3% Italian 2%
- Foreign-born
- 6% · Canada
- Languages at home
- 96% English-only · Spanish 1% German/W. Germanic 1% Tagalog/Filipino 1%
Political lean MEDSL · Charlotte
- 2024 margin
- Solid R (+34.0) · D 32.7% · R 66.7%
- 2008→2024 swing
- -26.7pp toward R · 2008: -7.2pp · 2024: -34.0pp
- All cycles
- 2024: R+34.0 2020: R+26.6 2016: R+27.8 2012: R+14.3 2008: R+7.2
Not yet ingested
- Civics
- —
Market trends
- HPI YoY
- ▼ -28.09%
- Current HPI
- 346.5247
- Rent YoY
- ▲ 5.29%
- Metro
- Punta Gorda, FL
- State GDP YoY
- ▲ 3.28%
- F500 in state
- 36
Industry mix (Fortune 500 HQ in FL)
| Industry | F500 HQs | Revenue |
|---|---|---|
| Industrial Technology | 2 | $29B |
|
||
| Insurance | 2 | $17B |
|
||
| Retail | 1 | $60B |
|
||
| Technology Distribution | 1 | $58B |
|
||
| Homebuilding | 1 | $35B |
|
||
| Technology Manufacturing | 1 | $35B |
|
||
Price history
+228.9% since first listed8 events — show timeline
- 2026-05-26 Listed $250,000 Stellar MLS as Distributed by MLS Grid
- 2012-01-31 Sold (MLS) $50,000 Stellar MLS as Distributed by MLS Grid
- 2011-09-21 Listed $55,000 Stellar MLS as Distributed by MLS Grid
- 2004-10-05 Sold (Public Records) $196,900 Public Records
- 2004-09-17 Sold (MLS) $196,900 Stellar MLS as Distributed by MLS Grid
- 2004-04-06 Listed $199,900 Stellar MLS as Distributed by MLS Grid
- 2001-04-23 Sold (Public Records) $79,900 Public Records
- 2001-03-02 Sold (Public Records) $76,000 Public Records
Property tax history
-2.4%/yrLatest (2025): $981 · +4.1% YoY. Source: county tax records.
Cash-flow waterfall
monthlySold comps — $/sqft
last 12 mo · ≤1 miLoading sold comps…