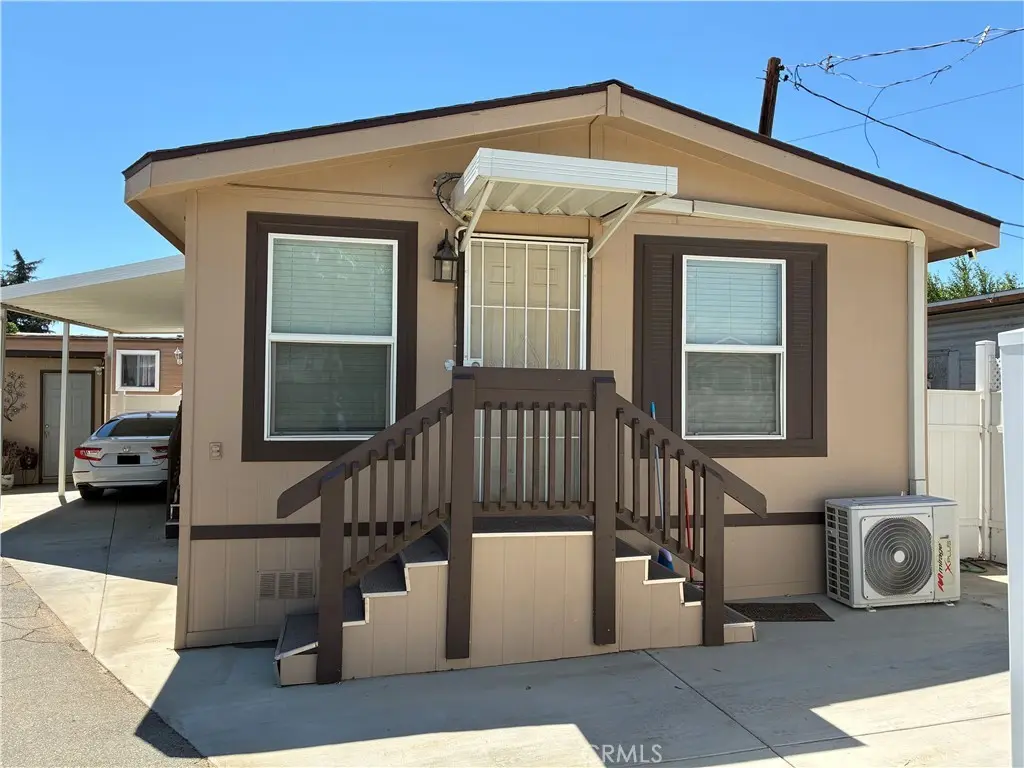
1460 E 6th St #4 · Beaumont, CA
Flood risk 1/10 · Minimal
- FEMA flood zone
- X (unshaded)
- Chance of flooding over 30 yrs
- 0.0%
- Est. flood insurance / yr
- $507 – $1,088
Fire risk 10/10 · Severe
- Est. fire insurance / yr
- $659 – $1,223
Heat risk 6/10 · Moderate
- Hot days now (above 101°F)
- 7 days/yr
- Hot days in 30 yrs
- 19 days/yr
Wind risk 1/10 · Minimal
- Chance of severe wind over 30 yrs
- —
Air-quality risk 7/10 · Major
- Unhealthy air days now
- 14 days/yr
- Unhealthy air days in 30 yrs
- 18 days/yr
Risk factors via First Street. Map © Google.
Why this score? — see what drove the B grade
The composite is a weighted blend of 9 inputs, each scored 0–100. Each bar is that input's sub-score; the figure is the points it added to the 100-point composite (weight × sub-score).
- Cash flow +30.0/30.0
- DSCR +10.0/10.0
- 1% rule +9.6/10.0
- ARV discount +7.5/15.0
- Schools +4.0/10.0
- Condition / age +3.8/5.0
- Rent growth +3.5/5.0
- Livability +3.2/5.0
- Appreciation +0.0/10.0
$135,000
🖨 Deal sheet 📄 Offer letter ✓ Due diligence
Listing remarks MLS
Welcome to this well-maintained 2-bedroom, 2-bathroom mobile home in the desirable community of Beaumont! This home is in great condition and offers a comfortable, functional layout perfect for everyday living. Enjoy the benefits of a low land lease, making this an affordable opportunity for homeowners or investors alike. Whether you’re looking to downsize, purchase your first home, or add to your portfolio, this property offers excellent value.
Key facts
- Built 2008
- Listed 72 days
Neighborhood map
What this means for you Summary
Snapshot
- This is a 2-bed/2.0-bath manufactured listed at $135k. Condition is rated good.
Deal economics
- At list price, monthly cash flow is $752 ($9k/yr) — positive.
- The deal already cash-flows at list — no discount required.
- Meets the 1% rule at list price ($2k rent vs $135k).
- Recommended offer: $127k (6.0% below list) — sets the bar for market timing.
- Cap rate 13.0% vs local median 3.5% in Beaumont — top-decile yield for the area; either an underpriced asset or a hidden risk that comps aren't pricing in. Stress-test before assuming the spread holds.
Location & tenants
- Location reads 64/100 on livability (#429 in CA) — a middle-class / working-renter tenant base. Strengths: employment A+, housing A+, crime A-; Watch: amenities F, commute F, cost of living F.
- Beaumont Unified (suburban): math 32% / reading 60% proficiency, ranked #168 of 517 in CA (top 32%) — families likely to look elsewhere, expect single-tenant / working-renter base with shorter leases.
- Market conditions: Rents rising (+3.9%/yr); 276 active listings in the ZIP; 10 comparable units currently listed for rent nearby; rentals at typical pace (median 20d on market — plan ~3-4 weeks tenant-placement turnaround); solid renter incomes; 9,195 units permitted in Riverside County in 2024 (1,512 in 5+ unit buildings).
Forward outlook
- Local home prices are declining (-3.0%/yr); year-one equity from $933 of loan paydown is wiped out by about $4k of value loss. Plan a longer hold.
- Riverside County population projected at +22% by 2050 — long-run rental-demand tailwind backs the buy-and-hold thesis.
- At projected returns (-3.0% appreciation + 3.9% rent growth), your $38k cash investment doubles in ~5 years — after that, you're playing with house money.
Negotiation context
- It's been on market 72 days — a 6% lower offer ($127k) is reasonable based on typical stale-listing flexibility.
- 2 sale attempts with the ask held roughly flat each time — persistent listings suggest the price (not the market) is what's stuck; bring a comps-based counter.
Risks & watch-outs
- Climate carrying-cost: severe wildfire risk; extreme-heat days projected 7→19/yr by 2055 (HVAC capex compounding) — expect insurance premiums to compound above CPI over the hold.
Questions for the listing agent
- It's been on market 72 days. Have you received any prior offers? Is the seller open to a 6% concession, seller financing, or rate buy-down credit?
- Why hasn't it sold? Are there any deal-killer items the seller is aware of (foundation, flood, title, zoning, code violations)?
- Is there a deadline driving the sale (1031 exchange, divorce, estate, relocation)? That informs how much negotiation room exists.
- What's the average days-on-market for RENTAL listings here right now (not sales)? A rising rental-DOM trend means longer vacancies and softer asking-rent achievability than the comps imply.
- What's the recent tenant-quality profile in this submarket — average credit score on applications, eviction rate, late-payment / NSF rate, and stable-employment percentage? A property-management company in the area should have these aggregated.
- How much new for-sale + rental construction is in the pipeline within 1–3 miles? Heavy new supply typically softens prices + rents 12–24 months out; constrained supply supports both.
Investment metrics
- 1% rule
- 1.46% ✓
- Cap rate
- 12.97%
- Cash-on-cash
- 23.86%
- DSCR
- 2.06
- GRM
- 5.7
CMA / ARV
No comps found within radius.
Projected returns pro-forma
-3.0% appreciation · 3.85% rent growth · sell at horizon
- IRR
- 17.9%
- Equity multiple
- 1.73×
- Total profit
- $27,644
- Equity at exit
- $20,129
- IRR
- 26.9%
- Equity multiple
- 3.45×
- Total profit
- $92,610
- Equity at exit
- $11,672
Cash invested: $37,800 (down + closing). Projections, not guarantees.
Landlord ↔ Tenant lean methodology
- Overall (STATE)
- 18 Strongly Tenant-Friendly
- State California
- 18 Strongly Tenant-Friendly · D+13
- County
- — inherits STATE
- City
- — inherits STATE
ZIP-level market 92223
- Rents YoY
- 3.9%
- Active inventory
- 276
- Price-to-rent
- 5.7×
Monthly cashflow live
- Estimated rent
- $1,971 high interval (Pro) →
- Mortgage (P&I)
- −$708
- Tax from tax record
- −$42 /mo · $499/yr
- Insurance
- −$56
- HOA
- −$0
- Vacancy / Maint / Mgmt
- −$414
- Net cashflow
- $752
Break-even live
UW: 25.0% down · 7.5% · 30yr · 1.5% tax · 5.0% vac · 8.0% maint · 8.0% mgmt
Financing live
Cash to close
- Down payment
- $33,750
- Closing costs
- $4,050
- Reserves months
- —
- Total cash needed
- —
Loan-product check · same deal, 3 products live
Conventional
25% down · 7.5% · 30yr
- Down + closing
- —
- Monthly P&I
- —
- Monthly cashflow
- —
- DSCR
- —
- Eligible?
- —
Personal DTI + credit; lowest rate.
DSCR
20% down · 8.5% · 30yr
- Down + closing
- —
- Monthly P&I
- —
- Monthly cashflow
- —
- DSCR
- —
- Eligible?
- —
No personal income docs; deal must DSCR.
Hard money
10% down · 12.0% · 12mo
- Down + closing
- —
- Monthly P&I
- —
- Monthly cashflow
- —
- DSCR
- —
- Eligible?
- —
Short-term bridge; refi at stabilization.
Rent comps 10 comps
| Address | Beds | Baths | Sqft | Rent | $/sqft | DOM | Units | Dist |
|---|---|---|---|---|---|---|---|---|
| 1498 E 6th St Unit 4 Beaumont, CA | 1.0 | 1.0 | 675 | $1,500 | $2.22 | 18d | 1 | 0.16mi |
| 845 E 6th St Unit 16 Beaumont, CA | 1.0 | 1.0 | 555 | $1,395 | $2.51 | 24d | 1 | 0.75mi |
| 845 E Sixth St Beaumont, CA | 1.0 | 1.0 | 555 | $1,395 | $2.51 | 43d | 1 | 0.75mi |
| 1145 Orange Ave Beaumont, CA | 1.0 | 1.0 | 840 | $1,975 | $2.35 | 24d | 1 | 1.12mi |
| 5464 Evelyn Dr Banning, CA | 2.0 | 1.0 | 851 | $1,900 | $2.23 | 43d | 1 | 1.22mi |
| 5464 Evelyn Dr Banning, CA | 2.0 | 1.0 | 851 | $1,900 | $2.23 | 15d | 1 | 1.22mi |
| 228 Janan Ct Banning, CA | 2.0 | 1.0 | 1100 | $2,100 | $1.91 | 1d | 1 | 1.28mi |
| 974 Edgar Ave Beaumont, CA | 2.0 | 1.5 | 900 | $2,400 | $2.67 | 10d | 1 | 1.28mi |
| 864 Wellwood Ave Unit 4 Beaumont, CA | 2.0 | 1.0 | 850 | $2,200 | $2.59 | 19d | 1 | 1.42mi |
| 876 Wellwood Ave Unit 878 Beaumont, CA | 2.0 | 1.0 | 850 | $1,725 | $2.03 | 10d | 1 | 1.42mi |
Listing history 19 events
-
2026-06-18days on market $135,000 Active 72 DOM
-
2026-06-17days on market $135,000 Active 71 DOM
-
2026-06-16days on market $135,000 Active 70 DOM
-
2026-06-15days on market $135,000 Active 69 DOM
-
2026-06-13days on market $135,000 Active 67 DOM
-
2026-06-13days on market $135,000 Active 66 DOM
-
2026-06-09days on market $135,000 Active 63 DOM
-
2026-06-08days on market $135,000 Active 62 DOM
-
2026-06-07days on market $135,000 Active 61 DOM
-
2026-06-04days on market $135,000 Active 58 DOM
-
2026-06-03days on market $135,000 Active 57 DOM
-
2026-06-02days on market $135,000 Active 56 DOM
-
2026-06-01days on market $135,000 Active 55 DOM
-
2026-05-31days on market $135,000 Active 54 DOM
-
2026-04-07$135,000 Active 455-char remark
Show marketing remark (455 chars)
Welcome to this well-maintained 2-bedroom, 2-bathroom mobile home in the desirable community of Beaumont! This home is in great condition and offers a comfortable, functional layout perfect for everyday living. Enjoy the benefits of a low land lease, making this an affordable opportunity for homeowners or investors alike. Whether you’re looking to downsize, purchase your first home, or add to your portfolio, this property offers excellent value.
-
2026-04-01historical $135,000 455-char remark
Show marketing remark (455 chars)
Welcome to this well-maintained 2-bedroom, 2-bathroom mobile home in the desirable community of Beaumont! This home is in great condition and offers a comfortable, functional layout perfect for everyday living. Enjoy the benefits of a low land lease, making this an affordable opportunity for homeowners or investors alike. Whether you’re looking to downsize, purchase your first home, or add to your portfolio, this property offers excellent value.
-
2026-02-13historical
-
2025-08-21$140,000 Active
-
2025-08-19historical
ⓘ Source: listings_history table (triggers on properties + properties_extension) + one-shot
backfill from property_details.listing_events for pre-trigger history.
Tax reassessment forecast CA · Resets to sale price
- Current annual tax
- $499 · $42/mo
- Projected year-2 tax
- $1,026 · $86/mo
- Expected delta
- +$527/yr (+$44/mo · 105.5%)
ⓘ Screening estimate from a state-policy table — verify with the county assessor before closing.
Climate risk First Street
- Flood 1/10 Low FEMA zone X (unshaded) · 0% chance over 30 yrs
- Wildfire 10/10 Extreme
- Heat 6/10 Major 7 d/yr ≥101°F today · 19 d/yr by 30 yrs out
- Wind 1/10 Low
- Air quality 7/10 Severe 14 unhealthy d/yr today · 18 by 30 yrs out
Nearby sold comps map
Loading sold comps map…
Walkable amenities ~0.75 mi
Loading nearby amenities…
Taxation est. · year 1
- Rental income
- $23,656
- − Mortgage interest
- −$7,562
- − Property taxes
- −$499
- − Insurance
- −$675
- − Repairs & maintenance
- −$1,893
- − Management
- −$1,893
- − Depreciation
- −$3,927
- Taxable income
- $7,208
- Est. tax owed @ 24.0%
- −$1,730
- After-tax cash flow
- $7,289/yr
For passive investors: Depreciation is non-cash, so a rental often shows a tax loss while cash-flowing — sheltering income. Rental losses are passive: they offset passive income freely, and up to $25,000/yr can offset ordinary (W-2) income if you actively participate and your MAGI is under $100k (phasing out to $0 by $150k); unused losses carry forward. On sale, claimed depreciation is recaptured at up to 25%, and gains may owe capital-gains tax (a 1031 exchange can defer both). Figures are a year-1 estimate at your 24.0% rate — not tax advice; consult a CPA.
Condition & rehab AI · 3 photos
This well-maintained mobile home in Beaumont offers a comfortable layout and is ready for minor cosmetic updates to enhance its resale and rental value.
Repairs flagged
- Minor Kitchen cabinets — Worn appearance
- Minor Bathroom fixtures — Signs of wear
Value-add opportunities
- Both Paint interior walls — Fresh paint enhances curb appeal and interior aesthetics
- Both Replace worn kitchen cabinets — New cabinets improve functionality and appearance
- Both Upgrade bathroom fixtures — Modern fixtures increase appeal and functionality
Renovation cost estimate screening
| Repair item | Severity | Est. cost |
|---|---|---|
| Kitchen cabinets · Worn appearance | Minor | $500–3,000 |
| Bathroom fixtures · Signs of wear | Minor | $500–3,000 |
| Total estimated repair cost · 2 items | $1,000–6,000 |
Value-add ROI direction
- Both Paint interior walls — Fresh paint enhances curb appeal and interior aesthetics ↑
- Both Replace worn kitchen cabinets — New cabinets improve functionality and appearance ↑
- Both Upgrade bathroom fixtures — Modern fixtures increase appeal and functionality ↑
ⓘ Cost ranges are severity-bucket heuristics (US national rule-of-thumb). Get contractor quotes + a written scope before underwriting a rehab budget.
Schools (NCES district)
- District
- Beaumont Unified
- NCES district ID
- 0604290
- Math proficiency
- 32% ▼ -4.00%
- Reading proficiency
- 60% ▲ 11.00%
- Median HH income
- $60,635
- Composite
- 40.37/100
- National rank
- #3736
- State rank
- #168 of 517 in CA
Livability — Beaumont
- Score
- 64/100
- State rank
- #429
- US rank
- #14526
Category grades
Schools grade is shown separately in the Schools card above.
Census & demographics
- Census place
- Beaumont, CA
- County
- Riverside County · 2,287,001 people
- City population
- 63,833
- Metro
- Riverside-San Bernardino-Ontario, CA
- Population (ZIP)
- 63,833
- Household income
- $102,761
- Rent vs Own
- Severe rent burden
- 1096.0
Population outlook (Riverside County) Hauer SSP2
- Today (2025)
- 2,664,475 people
- By 2030
- 2,802,692 · +5.2%
- By 2040
- 3,050,904 · +14.5%
- By 2050
- 3,256,783 · +22.2%
- By 2075
- 3,655,058 · +37.2%
- By 2100
- 3,766,594 · +41.4%
Race, ethnicity, and origin ACS 2023
- Neighborhood character
- Diverse neighborhood (Simpson 0.65)
- Race & ethnicity
- Hispanic / Latino 45% White 37% Two or more races 16% Black 8% Asian 7% Native American 1%
- Hispanic origin (detail)
- Mexican 40%
- Common ancestry
- Lithuanian 1% Romanian 1% Italian 1%
- Foreign-born
- 15% · Canada, China
- Languages at home
- 70% English-only · Spanish 23% Tagalog/Filipino 2% Chinese 1%
Political lean MEDSL · Riverside
- 2024 margin
- Toss-up / Even · D 48.0% · R 49.3% · Other 2.6%
- 2008→2024 swing
- -3.6pp toward R · 2008: 2.3pp · 2024: -1.3pp
- All cycles
- 2024: R+1.3 2020: D+8.0 2016: D+4.3 2012: R+0.4 2008: D+2.3
Not yet ingested
- Civics
- —
Market trends
- HPI YoY
- ▼ -395.13%
- Current HPI
- 373.4608
- Rent YoY
- ▲ 3.85%
- Metro
- Riverside-San Bernardino-Ontario, CA
- State GDP YoY
- ▲ 3.21%
- F500 in state
- 116
Industry mix (Fortune 500 HQ in CA)
| Industry | F500 HQs | Revenue |
|---|---|---|
| Technology | 27 | $1,492B |
|
||
| Financial Services | 3 | $174B |
|
||
| Retail | 3 | $44B |
|
||
| Insurance | 3 | $26B |
|
||
| Media / Entertainment | 2 | $115B |
|
||
| Pharmaceuticals / Biotech | 2 | $62B |
|
||
Price history
-3.6% since first listed5 events — show timeline
- 2026-04-07 Listed $135,000 CRMLS
- 2026-04-01 Coming Soon $135,000 CRMLS
- 2026-02-13 Listing Removed — CRMLS
- 2025-08-21 Listed $140,000 CRMLS
- 2025-08-19 Coming Soon — CRMLS
Property tax history
+1.2%/yrLatest (2025): $499 · +1.7% YoY. Source: county tax records.
Cash-flow waterfall
monthlySold comps — $/sqft
last 12 mo · ≤1 miLoading sold comps…