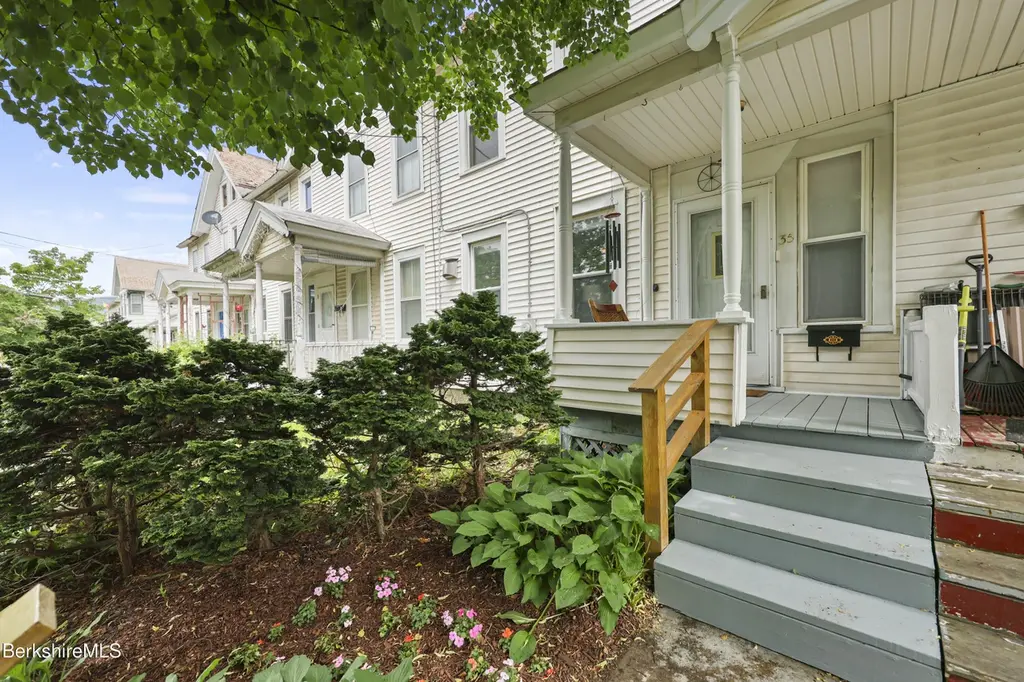
35 Summer St · Adams, MA
Flood risk 7/10 · Major
- FEMA flood zone
- X
- Chance of flooding over 30 yrs
- 0.97%
- Est. flood insurance / yr
- $473 – $860
Fire risk 1/10 · Minimal
- Est. fire insurance / yr
- $915 – $1,699
Heat risk 3/10 · Minor
- Hot days now (above 90°F)
- 8 days/yr
- Hot days in 30 yrs
- 18 days/yr
Wind risk 4/10 · Minor
- Chance of severe wind over 30 yrs
- 10.0%
Air-quality risk 2/10 · Minimal
- Unhealthy air days now
- 1 days/yr
- Unhealthy air days in 30 yrs
- 1 days/yr
Risk factors via First Street. Map © Google.
Why this score? — see what drove the C grade
The composite is a weighted blend of 9 inputs, each scored 0–100. Each bar is that input's sub-score; the figure is the points it added to the 100-point composite (weight × sub-score).
- ARV discount +15.0/15.0
- Cash flow +14.3/30.0
- Appreciation +8.3/10.0
- DSCR +4.4/10.0
- Livability +3.6/5.0
- 1% rule +3.4/10.0
- Rent growth +2.5/5.0
- Condition / age +2.5/5.0
- Schools +2.0/10.0
$179,000
🖨 Deal sheet (PDF) 📄 Offer letter ✓ Due diligence
Listing remarks MLS
Why rent when you can buy! Beautiful well maintained row house. Wood floors through out this 3 bed, 1 bath home. Currently 2 bedrooms are opened up to make a larger bedroom with a sitting area. Basement is large and dry for storage or crafting/work area. Bonus space in walk-up attic. This home also has a fenced in yard and off street parking. Close to downtown restaurants, coffee shops, theater and shopping. Walk the Ashuwillticook Rail Trail or take a short drive to Mt. Greylock, MCLA, Mass MoCA! Explore the Berkshires from this quaint home.
Key facts
- Hardwood flooring
- Remodeled bathroom
- Downtown location
Tags
Property features AI
Exterior
- Parking: Off-street parking
- Utilities: 100 Amp electric service; Public sewer
- Home design: Slate roof
- Construction: Slate roof (roof material listed)
- Exterior features: Porch; Patio; Fenced yard; Mature landscaping; Public transportation within 1/2 mile (bus service nearby)
Interior
- Kitchen: Microwave; Refrigerator
- Bedrooms: Total of 6 rooms (includes bedrooms and living spaces)
- Flooring: Carpet; Linoleum; Wood
- Bathrooms: 1 full bathroom
- Heating & cooling: Natural gas heating
- Interior features: Hardwood flooring in living area; Porch (listed under exterior features but provides sheltered entry)
- Laundry & utility: Washer; Dryer
Neighborhood map
What this means for you Summary
Snapshot
- This is a 3-bed/1.0-bath single-family listed at $179k.
Deal economics
- At list price, monthly cash flow is $-22 ($-269/yr) — negative.
- To cash-flow at today's rent, offer at most $175k (2.2% below list).
- To meet the 1% rule (rent ≥ 1% of price), the offer needs to be $150k (16.1% below list).
- Recommended offer: $150k (16.1% below list) — sets the bar for 1% rule.
Location & tenants
- Location reads 71/100 on livability (#131 in MA) — a middle-class / working-renter tenant base. Strengths: health & safety A+, housing A, cost of living A-; Watch: amenities F, commute F, employment D-.
- Adams-Cheshire (rural): math 14% / reading 31% proficiency, ranked #285 of 302 in MA (top 94%) — low school quality limits family demand, transient renter base, plan for 1-2y turnover.
- Zoned schools: Hoosac Valley Elementary School (math 27% / reading 42%, grade F, #577 of 938 statewide, top 65%, 374 students, 0% FRL); Hoosac Valley Middle School (math 8% / reading 28%, grade F, #264 of 305 statewide, top 87%, 288 students, 0% FRL); Hoosac Valley High School (math 22% / reading 37%, grade F, #270 of 343 statewide, top 80%, 324 students, 0% FRL) — zoned schools average 0% FRL vs 36% district-wide (36 pts lower); this property's tenant base skews higher-income than the district average.
- Market conditions: 62 active listings in the ZIP; 2 comparable units currently listed for rent nearby; 130 units permitted in Berkshire County in 2024 (10 in 5+ unit buildings).
Forward outlook
- In year one you build about $13k of equity ($1k loan paydown + $12k appreciation (6.7% local appreciation)).
- Berkshire County population projected at -24% by 2050 — secular population decline; favor cash flow + early exit over multi-decade hold.
- At projected returns (6.7% appreciation + 3.0% rent growth), your $50k cash investment doubles in ~4 years — after that, you're playing with house money.
- By year 3, paydown + projected appreciation supports a ~$33k cash-out refi (75% LTV) — recoverable capital for the next deal without selling this one.
Negotiation context
- Only 3 days on market — expect competitive offers; lowballing is unlikely to land.
- 6 sale attempts since 25y ago with the ask held roughly flat each time — persistent listings suggest the price (not the market) is what's stuck; bring a comps-based counter.
- Current owner paid $122k; 46% above their basis — modest negotiation headroom, anchor on the comps not their cost.
Risks & watch-outs
- Watch-outs: flood insurance adds $56/mo; built in 1900 — expect roof / HVAC / electrical / plumbing capex.
- Climate carrying-cost: major flood risk — expect insurance premiums to compound above CPI over the hold.
Questions for the listing agent
- What do current leases actually rent for vs. the listed asking? Can we see a recent rent roll and the last 12 months of T-12 income?
- Built in 1900 — when were the roof, HVAC, electrical panel, plumbing, and water heater last replaced?
- What's the actual annual flood-insurance premium (NFIP or private), and is the property in a SFHA with mandatory coverage?
- Is there a deadline driving the sale (1031 exchange, divorce, estate, relocation)? That informs how much negotiation room exists.
- Schools are D-rated, which usually means shorter tenancies and higher turnover. Who's the typical renter profile here, and what's been the actual vacancy rate?
- What's the average days-on-market for RENTAL listings here right now (not sales)? A rising rental-DOM trend means longer vacancies and softer asking-rent achievability than the comps imply.
- What's the recent tenant-quality profile in this submarket — average credit score on applications, eviction rate, late-payment / NSF rate, and stable-employment percentage? A property-management company in the area should have these aggregated.
- How much new for-sale + rental construction is in the pipeline within 1–3 miles? Heavy new supply typically softens prices + rents 12–24 months out; constrained supply supports both.
Investment metrics
- 1% rule
- 0.84% ✗
- Cap rate
- 6.51%
- Cash-on-cash
- 0.79%
- DSCR
- 1.04
- GRM
- 9.9
CMA / ARV
- ARV (on-the-fly)
- $218,080
- Comps found
- 12
Show comp detail 12 sales within ~0.75 mi
| Address | Dist | Beds/Ba | Sqft | Sold | Price | $/sf | Match |
|---|---|---|---|---|---|---|---|
| 12 2nd St | 0.15mi | 3/1.5 | 1,225 (+6%) | 1mo | $282,000 | $230 | 81 |
| 15 2nd St | 0.17mi | 3/1.0 | 1,104 (-5%) | 8mo | $248,575 | $225 | 78 |
| 8 School St | 0.23mi | 3/1.0 | 1,234 (+6%) | 3mo | $210,000 | $170 | 76 |
| 40 Victory Ter | 0.26mi | 3/1.0 | 1,080 (-7%) | 3mo | $250,000 | $231 | 74 |
| 2 Crotteau St | 0.56mi | 3/1.0 | 1,144 (-1%) | 4mo | $215,000 | $188 | 69 |
| 2 Kittler Ave | 0.68mi | 3/1.5 | 1,144 (-1%) | 0mo | $119,500 | $104 | 64 |
| 6 Meadow Ln | 0.37mi | 3/1.0 | 1,312 (+13%) | 4mo | $227,900 | $174 | 58 |
| 5 North St | 0.21mi | 3/1.0 | 1,326 (+14%) | 11mo | $255,000 | $192 | 57 |
| 1 Richmond Ln | 0.42mi | 3/1.0 | 1,024 (-12%) | 6mo | $142,000 | $139 | 56 |
| 82 Maple St | 0.69mi | 3/1.5 | 1,224 (+6%) | 8mo | $280,000 | $229 | 50 |
| 10 Enterprise St | 0.74mi | 2/1.0 (-1) | 1,010 (-13%) | 5mo | $165,000 | $163 | 35 |
| 15 Kerr Ave | 0.70mi | 4/2.0 (+1) | 1,310 (+13%) | 8mo | $240,000 | $183 | 30 |
Match score weights: distance 35% · size 25% · config 20% · recency 20%. Top-matched comps best support the ARV.
Projected returns pro-forma
6.66% appreciation · 3.0% rent growth · sell at horizon
- IRR
- 16.5%
- Equity multiple
- 2.15×
- Total profit
- $57,391
- Equity at exit
- $120,116
- IRR
- 16.2%
- Equity multiple
- 4.36×
- Total profit
- $168,351
- Equity at exit
- $224,696
Cash invested: $50,120 (down + closing). Projections, not guarantees.
Landlord ↔ Tenant lean methodology
- Overall (STATE)
- 20 Strongly Tenant-Friendly
- State Massachusetts
- 20 Strongly Tenant-Friendly · D+15
- County
- — inherits STATE
- City
- — inherits STATE
ZIP-level market 01220
- Home prices YoY
- 2.3%
- Active inventory
- 62
- Price-to-rent
- 9.9×
Monthly cashflow live
- Estimated rent
- $1,503 medium interval (Pro) →
- Mortgage (P&I)
- −$939
- Tax from tax record
- −$141 /mo · $1,688/yr
- Insurance
- −$75
- Flood insurance flood zone
- −$56 /mo · $666/yr
- HOA
- −$0
- Vacancy / Maint / Mgmt
- −$316
- Net cashflow
- $-22
Break-even live
Sensitivity live
| Price | -10% $79 | -5% $28 | +0% $-22 | +5% $-73 | +10% $-124 |
|---|---|---|---|---|---|
| Rent | -10% $-141 | -5% $-82 | +0% $-22 | +5% $37 | +10% $96 |
| Rate | -1.0pp $68 | -0.5pp $23 | base $-22 | +0.5pp $-69 | +1.0pp $-116 |
UW: 25.0% down · 7.5% · 30yr · 1.5% tax · 5.0% vac · 8.0% maint · 8.0% mgmt
Financing live
Cash to close
- Down payment
- $44,750
- Closing costs
- $5,370
- Reserves months
- —
- Total cash needed
- —
Loan-product check · same deal, 3 products live
Conventional
25% down · 7.5% · 30yr
- Down + closing
- —
- Monthly P&I
- —
- Monthly cashflow
- —
- DSCR
- —
- Eligible?
- —
Personal DTI + credit; lowest rate.
DSCR
20% down · 8.5% · 30yr
- Down + closing
- —
- Monthly P&I
- —
- Monthly cashflow
- —
- DSCR
- —
- Eligible?
- —
No personal income docs; deal must DSCR.
Hard money
10% down · 12.0% · 12mo
- Down + closing
- —
- Monthly P&I
- —
- Monthly cashflow
- —
- DSCR
- —
- Eligible?
- —
Short-term bridge; refi at stabilization.
Rent comps 2 comps
| Address | Beds | Baths | Sqft | Rent | $/sqft | DOM | Units | Dist |
|---|---|---|---|---|---|---|---|---|
| 7 Allen St Adams, MA | 2.0 | 1.0 | 1000 | $1,350 | $1.35 | 23d | 1 | 0.38mi |
| 98 Columbia St Adams, MA | 4.0 | 1.5 | 1300 | $1,800 | $1.38 | 45d | 1 | 0.76mi |
Listing history 4 events
-
2026-06-21days on market $179,000 Active 3 DOM
-
2026-06-21days on market $179,000 Active 2 DOM
-
2026-06-18remarks 699-char remark
-
2026-06-18$179,000 Active 1 DOM
ⓘ Source: listings_history table (triggers on properties + properties_extension) + one-shot
backfill from property_details.listing_events for pre-trigger history.
Tax reassessment forecast MA · Partial reset (capped growth)
- Current annual tax
- $1,688 · $141/mo
- Projected year-2 tax
- $1,945 · $162/mo
- Expected delta
- +$257/yr (+$21/mo · 15.2%)
ⓘ Screening estimate from a state-policy table — verify with the county assessor before closing.
Climate risk First Street
- Flood 7/10 Severe FEMA zone X · 97% chance over 30 yrs
- Wildfire 1/10 Low
- Heat 3/10 Moderate 8 d/yr ≥90°F today · 18 d/yr by 30 yrs out
- Wind 4/10 Moderate 10% chance of damaging wind over 30 yrs
- Air quality 2/10 Low 1 unhealthy d/yr today · 1 by 30 yrs out
Nearby sold comps map
Loading sold comps map…
Walkable amenities ~0.75 mi
Loading nearby amenities…
Taxation est. · year 1
- Rental income
- $18,031
- − Mortgage interest
- −$10,027
- − Property taxes
- −$1,688
- − Insurance
- −$1,562
- − Repairs & maintenance
- −$1,442
- − Management
- −$1,442
- − Depreciation
- −$5,207
- Taxable loss
- −$3,337
- Est. tax savings @ 24.0%
- +$801
- After-tax cash flow
- $532/yr
For passive investors: Depreciation is non-cash, so a rental often shows a tax loss while cash-flowing — sheltering income. Rental losses are passive: they offset passive income freely, and up to $25,000/yr can offset ordinary (W-2) income if you actively participate and your MAGI is under $100k (phasing out to $0 by $150k); unused losses carry forward. On sale, claimed depreciation is recaptured at up to 25%, and gains may owe capital-gains tax (a 1031 exchange can defer both). Figures are a year-1 estimate at your 24.0% rate — not tax advice; consult a CPA.
Schools (NCES district)
- District
- Adams-Cheshire
- NCES district ID
- 2501780
- Math proficiency
- 14% ▼ -13.00%
- Reading proficiency
- 31% ▼ -4.00%
- Median HH income
- $45,956
- Composite
- 19.53/100
- National rank
- #8765
- State rank
- #285 of 302 in MA
Livability — Adams
- Score
- 71/100
- State rank
- #131
- US rank
- #7262
Category grades
Schools grade is shown separately in the Schools card above.
Census & demographics
- Census place
- Adams, MA
- City population
- 8,106
- Population (ZIP)
- 8,106
Population outlook (Berkshire County) Hauer SSP2
- Today (2025)
- 119,723 people
- By 2030
- 114,608 · -4.3%
- By 2040
- 102,806 · -14.1%
- By 2050
- 91,305 · -23.7%
- By 2075
- 71,517 · -40.3%
- By 2100
- 57,988 · -51.6%
Race, ethnicity, and origin ACS 2023
- Neighborhood character
- Predominantly White (94%)
- Race & ethnicity
- White 94% Two or more races 3% Hispanic / Latino 2%
- Common ancestry
- Romanian 18% Lithuanian 16% Slovak 1%
- Foreign-born
- 2% · Vietnam
- Languages at home
- 96% English-only · Spanish 2% Russian/Polish/Slavic 2% Vietnamese 1%
Political lean MEDSL · Berkshire
- 2024 margin
- Solid D (+39.9) · D 68.9% · R 29.0% · Other 2.1%
- 2008→2024 swing
- -12.5pp toward R · 2008: 52.4pp · 2024: 39.9pp
- All cycles
- 2024: D+39.9 2020: D+47.1 2016: D+41.5 2012: D+53.7 2008: D+52.4
Not yet ingested
- Civics
- —
Market trends
- HPI YoY
- ▲ 6.66%
- Current HPI
- 295.6616
- Rent YoY
- —
- Metro
- —
- State GDP YoY
- ▲ 2.28%
- F500 in state
- 38
Industry mix (Fortune 500 HQ in MA)
| Industry | F500 HQs | Revenue |
|---|---|---|
| Technology | 3 | $17B |
|
||
| Insurance | 2 | $84B |
|
||
| Retail | 2 | $76B |
|
||
| Life Sciences | 1 | $43B |
|
||
| Energy Technology | 1 | $31B |
|
||
| Aerospace / Defense | 1 | $18B |
|
||
Price history
+258.7% since first listed14 events — show timeline
- 2026-06-17 Listed $179,000 BCMLS
- 2023-07-28 Sold (MLS) $122,500 BCMLS
- 2023-07-18 Pending — BCMLS
- 2023-06-22 Listed $124,800 BCMLS
- 2018-07-30 Sold (MLS) $67,500 BCMLS
- 2018-05-25 Listed $69,900 BCMLS
- 2010-04-29 Sold (MLS) $65,000 BCMLS
- 2010-03-22 Listed $69,900 BCMLS
- 2002-09-30 Sold (Public Records) $58,000 Public Records
- 2002-09-30 Sold (MLS) $58,000 BCMLS
- 2002-04-12 Listing Removed — BCMLS
- 2001-10-12 Listed $59,900 BCMLS
- 2001-10-12 Listed $59,900 BCMLS
- 1992-07-01 Sold (Public Records) $49,900 Public Records
Property tax history
+3.4%/yrLatest (2023): $1,688 · +2.8% YoY. Source: county tax records.
Cash-flow waterfall
monthlySold comps — $/sqft
last 12 mo · ≤1 miLoading sold comps…