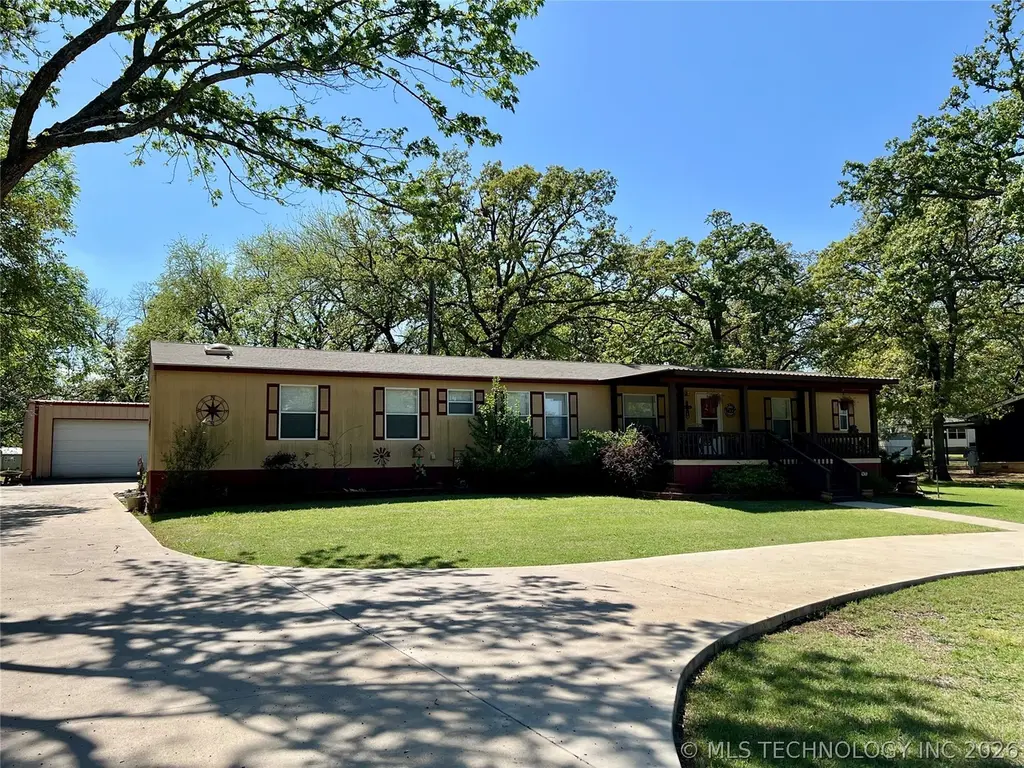
4369 Lookout Dr · McBride, OK
Flood risk 1/10 · Minimal
- FEMA flood zone
- X
- Chance of flooding over 30 yrs
- 0.0%
- Est. flood insurance / yr
- $507 – $1,088
Fire risk 4/10 · Minor
- Est. fire insurance / yr
- $2,463 – $4,575
Heat risk 6/10 · Moderate
- Hot days now (above 109°F)
- 7 days/yr
- Hot days in 30 yrs
- 21 days/yr
Wind risk 4/10 · Minor
- Chance of severe wind over 30 yrs
- 16.0%
Air-quality risk 3/10 · Minor
- Unhealthy air days now
- 2 days/yr
- Unhealthy air days in 30 yrs
- 3 days/yr
Risk factors via First Street. Map © Google.
Why this score? — see what drove the D+ grade
The composite is a weighted blend of 9 inputs, each scored 0–100. Each bar is that input's sub-score; the figure is the points it added to the 100-point composite (weight × sub-score).
- Cash flow +14.7/30.0
- Appreciation +10.0/10.0
- ARV discount +7.5/15.0
- DSCR +4.5/10.0
- 1% rule +2.8/10.0
- Rent growth +2.5/5.0
- Schools +2.5/10.0
- Livability +2.5/5.0
- Condition / age +2.5/5.0
$299,000
🖨 Deal sheet 📄 Offer letter ✓ Due diligence
Listing remarks
Don't miss out on this nice 3 bedroom, 2 bath lake home, located in the desirable Washita Point area of Lake Texoma! This home was constructed by Solitaire, one of the top brands in the business! This property offers great outdoor living space with a covered front porch & spacious covered back deck, perfect for relaxing or entertaining. Other features include a large insulated shop, RV port, above-ground storm shelter, plus a circle drive for easy access and ample parking! This one would be absolutely perfect for full-time living or a weekend retreat! Call soon!
Key facts
- Covered front porch
- Lake home
- Large insulated shop
Tags
Property features AI
Exterior
- Parking: Detached garage with workshop and storage (2 garage spaces); RV access/parking; Boat parking
- Security: Smoke detector(s); Storm shelter
- Utilities: Electricity available; Water available (rural); Septic tank
- Home design: Manufactured double-wide home; Single-story; Faces north; Permanent foundation
- Construction: Vinyl siding; Asphalt/fiberglass roof
- Exterior features: Covered porch; Shed(s); Mature trees; Storm shelter; Smoke detector(s)
Interior
- Kitchen: Electric oven; Range; Dishwasher; Refrigerator
- Flooring: Carpet; Laminate
- Bathrooms: 2 full bathrooms
- Heating & cooling: Central heating (electric); Central air conditioning
- Interior features: Laminate counters; Ceiling fan(s); Programmable thermostat; Vinyl window frames
- Laundry & utility: Washer hookup; Electric dryer hookup; Washer; Dryer; Electric water heater
Neighborhood map
What this means for you Summary
Snapshot
- This is a 3-bed/2.0-bath manufactured listed at $299k.
Deal economics
- At list price, monthly cash flow is $78 ($942/yr) — positive.
- The deal already cash-flows at list — no discount required.
- To meet the 1% rule (rent ≥ 1% of price), the offer needs to be $232k (22.3% below list).
- Recommended offer: $232k (22.3% below list) — sets the bar for 1% rule.
Location & tenants
- Location reads: area grade D — affects rentability + tenant quality, not the cash-flow math above.
- Kingston (rural): math 27% / reading 32% proficiency, ranked #70 of 270 in OK (top 26%) — low school quality limits family demand, transient renter base, plan for 1-2y turnover; 76% free/reduced lunch — lower-income household profile, screen leases tightly.
- Market conditions: 435 active listings in the ZIP; 42 units permitted in Marshall County in 2024 (0 in 5+ unit buildings).
Forward outlook
- In year one you build about $32k of equity ($2k loan paydown + $30k appreciation (10.0% local appreciation)).
- Marshall County population projected at +22% by 2050 — long-run rental-demand tailwind backs the buy-and-hold thesis.
- At projected returns (10.0% appreciation + 3.0% rent growth), your $84k cash investment doubles in ~3 years — after that, you're playing with house money.
- By year 2, paydown + projected appreciation supports a ~$51k cash-out refi (75% LTV) — recoverable capital for the next deal without selling this one.
Negotiation context
- It's been on market 77 days — a 6% lower offer ($281k) is reasonable based on typical stale-listing flexibility.
- Current owner paid $50k; list at $299k implies a 498% gain — meaningful room to come down on a strong offer.
Risks & watch-outs
- Climate carrying-cost: extreme-heat days projected 7→21/yr by 2055 (HVAC capex compounding) — expect insurance premiums to compound above CPI over the hold.
Questions for the listing agent
- It's been on market 77 days. Have you received any prior offers? Is the seller open to a 22% concession, seller financing, or rate buy-down credit?
- Why hasn't it sold? Are there any deal-killer items the seller is aware of (foundation, flood, title, zoning, code violations)?
- Is there a deadline driving the sale (1031 exchange, divorce, estate, relocation)? That informs how much negotiation room exists.
- The area grade is low — what's the realistic commute time and amenity access for the typical tenant pool here? Any planned neighborhood developments (good or bad) we should know about?
- What's the average days-on-market for RENTAL listings here right now (not sales)? A rising rental-DOM trend means longer vacancies and softer asking-rent achievability than the comps imply.
- What's the recent tenant-quality profile in this submarket — average credit score on applications, eviction rate, late-payment / NSF rate, and stable-employment percentage? A property-management company in the area should have these aggregated.
- How much new for-sale + rental construction is in the pipeline within 1–3 miles? Heavy new supply typically softens prices + rents 12–24 months out; constrained supply supports both.
Investment metrics
- 1% rule
- 0.78% ✗
- Cap rate
- 6.61%
- Cash-on-cash
- 1.13%
- DSCR
- 1.05
- GRM
- 10.7
CMA / ARV
- ARV (on-the-fly)
- $198,764
- Comps found
- 5
Show comp detail 5 sales within ~0.75 mi
| Address | Dist | Beds/Ba | Sqft | Sold | Price | $/sf | Match |
|---|---|---|---|---|---|---|---|
| 7831 War Path Trl | 0.12mi | 3/2.0 | 1,289 (+2%) | 14mo | $215,000 | $167 | 78 |
| 4695 Golden Way | 0.24mi | 3/2.0 | 1,216 (-3%) | 11mo | $162,599 | $134 | 74 |
| 7722 Winding Path | 0.14mi | 2/2.0 (-1) | 1,120 (-11%) | 20mo | $135,000 | $121 | 53 |
| 4098 Tranquil Ln | 0.45mi | 3/2.0 | 1,360 (+8%) | 16mo | $235,000 | $173 | 52 |
| 7597 Winding Path | 0.29mi | 3/2.0 | 1,440 (+14%) | 21mo | $228,000 | $158 | 45 |
Match score weights: distance 35% · size 25% · config 20% · recency 20%. Top-matched comps best support the ARV.
Projected returns pro-forma
10.0% appreciation · 3.0% rent growth · sell at horizon
- IRR
- 25.1%
- Equity multiple
- 3.00×
- Total profit
- $167,688
- Equity at exit
- $269,363
- IRR
- 22.1%
- Equity multiple
- 6.85×
- Total profit
- $489,575
- Equity at exit
- $580,891
Cash invested: $83,720 (down + closing). Projections, not guarantees.
Landlord ↔ Tenant lean methodology
- Overall (STATE)
- 83 Strongly Landlord-Friendly
- State Oklahoma
- 83 Strongly Landlord-Friendly · R+20
- County
- — inherits STATE
- City
- — inherits STATE
ZIP-level market 73439
- Home prices YoY
- 12.3%
- Active inventory
- 435
- Price-to-rent
- 10.7×
Monthly cashflow live
- Estimated rent
- $2,324 medium interval (Pro) →
- Mortgage (P&I)
- −$1,568
- Tax from tax record
- −$65 /mo · $782/yr
- Insurance
- −$125
- HOA
- −$0
- Vacancy / Maint / Mgmt
- −$488
- Net cashflow
- $78
Break-even live
UW: 25.0% down · 7.5% · 30yr · 1.5% tax · 5.0% vac · 8.0% maint · 8.0% mgmt
Financing live
Cash to close
- Down payment
- $74,750
- Closing costs
- $8,970
- Reserves months
- —
- Total cash needed
- —
Loan-product check · same deal, 3 products live
Conventional
25% down · 7.5% · 30yr
- Down + closing
- —
- Monthly P&I
- —
- Monthly cashflow
- —
- DSCR
- —
- Eligible?
- —
Personal DTI + credit; lowest rate.
DSCR
20% down · 8.5% · 30yr
- Down + closing
- —
- Monthly P&I
- —
- Monthly cashflow
- —
- DSCR
- —
- Eligible?
- —
No personal income docs; deal must DSCR.
Hard money
10% down · 12.0% · 12mo
- Down + closing
- —
- Monthly P&I
- —
- Monthly cashflow
- —
- DSCR
- —
- Eligible?
- —
Short-term bridge; refi at stabilization.
Listing history 18 events
-
2026-06-19days on market $299,000 Active 77 DOM
-
2026-06-18days on market $299,000 Active 76 DOM
-
2026-06-17days on market $299,000 Active 75 DOM
-
2026-06-16days on market $299,000 Active 74 DOM
-
2026-06-15days on market $299,000 Active 73 DOM
-
2026-06-14days on market $299,000 Active 71 DOM
-
2026-06-13days on market $299,000 Active 70 DOM
-
2026-06-10days on market $299,000 Active 68 DOM
-
2026-06-09days on market $299,000 Active 67 DOM
-
2026-06-08days on market $299,000 Active 66 DOM
-
2026-06-07days on market $299,000 Active 65 DOM
-
2026-06-05days on market $299,000 Active 62 DOM
-
2026-06-02days on market $299,000 Active 60 DOM
-
2026-06-01days on market $299,000 Active 59 DOM
-
2026-05-31days on market $299,000 Active 58 DOM
-
2026-05-30days on market $299,000 Active 57 DOM
-
2026-04-01$299,000 Active
-
2002-11-12soldstatus $50,000
ⓘ Source: listings_history table (triggers on properties + properties_extension) + one-shot
backfill from property_details.listing_events for pre-trigger history.
Tax reassessment forecast OK · Resets to sale price
- Current annual tax
- $782 · $65/mo
- Projected year-2 tax
- $2,691 · $224/mo
- Expected delta
- +$1,909/yr (+$159/mo · 244.1%)
ⓘ Screening estimate from a state-policy table — verify with the county assessor before closing.
Climate risk First Street
- Flood 1/10 Low FEMA zone X · 0% chance over 30 yrs
- Wildfire 4/10 Moderate
- Heat 6/10 Major 7 d/yr ≥109°F today · 21 d/yr by 30 yrs out
- Wind 4/10 Moderate 16% chance of damaging wind over 30 yrs
- Air quality 3/10 Moderate 2 unhealthy d/yr today · 3 by 30 yrs out
Nearby sold comps map
Loading sold comps map…
Walkable amenities ~0.75 mi
Loading nearby amenities…
Taxation est. · year 1
- Rental income
- $27,892
- − Mortgage interest
- −$16,749
- − Property taxes
- −$782
- − Insurance
- −$1,495
- − Repairs & maintenance
- −$2,231
- − Management
- −$2,231
- − Depreciation
- −$8,698
- Taxable loss
- −$4,294
- Est. tax savings @ 24.0%
- +$1,031
- After-tax cash flow
- $1,973/yr
For passive investors: Depreciation is non-cash, so a rental often shows a tax loss while cash-flowing — sheltering income. Rental losses are passive: they offset passive income freely, and up to $25,000/yr can offset ordinary (W-2) income if you actively participate and your MAGI is under $100k (phasing out to $0 by $150k); unused losses carry forward. On sale, claimed depreciation is recaptured at up to 25%, and gains may owe capital-gains tax (a 1031 exchange can defer both). Figures are a year-1 estimate at your 24.0% rate — not tax advice; consult a CPA.
Schools (NCES district)
- District
- Kingston
- NCES district ID
- 4016590
- Math proficiency
- 27% ▼ -7.00%
- Reading proficiency
- 32% ▼ -7.00%
- Median HH income
- $40,655
- Composite
- 24.88/100
- National rank
- #7585
- State rank
- #70 of 270 in OK
Livability — McBride
No livability data for this city. (Only ~50 U.S. cities are tracked.)
Census & demographics
- Population (ZIP)
- 7,011
Population outlook (Marshall County) Hauer SSP2
- Today (2025)
- 17,405 people
- By 2030
- 18,038 · +3.6%
- By 2040
- 19,513 · +12.1%
- By 2050
- 21,283 · +22.3%
- By 2075
- 27,884 · +60.2%
- By 2100
- 35,435 · +103.6%
Race, ethnicity, and origin ACS 2023
- Neighborhood character
- Predominantly White (75%)
- Race & ethnicity
- White 75% Two or more races 16% Native American 5% Hispanic / Latino 4%
- Common ancestry
- Lithuanian 3% Italian 2% Serbian 1%
- Foreign-born
- 1% · Canada
- Languages at home
- 97% English-only · Spanish 3%
Political lean MEDSL · Marshall
- 2024 margin
- Solid R (+63.4) · D 17.7% · R 81.2% · Other 1.1%
- 2008→2024 swing
- -24.6pp toward R · 2008: -38.8pp · 2024: -63.4pp
- All cycles
- 2024: R+63.4 2020: R+62.5 2016: R+56.6 2012: R+45.7 2008: R+38.8
Not yet ingested
- Civics
- —
Market trends
- HPI YoY
- ▲ 26.96%
- Current HPI
- 246.2253
- Rent YoY
- —
- Metro
- —
- State GDP YoY
- ▲ 1.55%
- F500 in state
- 6
Industry mix (Fortune 500 HQ in OK)
| Industry | F500 HQs | Revenue |
|---|---|---|
| Energy | 3 | $48B |
|
||
Price history
+498.0% since first listed2 events — show timeline
- 2026-04-01 Listed $299,000 MLS Technology, Inc.
- 2002-11-12 Sold (Public Records) $50,000 Public Records
Property tax history
+4.0%/yrLatest (2025): $782 · +4.3% YoY. Source: county tax records.
Cash-flow waterfall
monthlySold comps — $/sqft
last 12 mo · ≤1 miLoading sold comps…