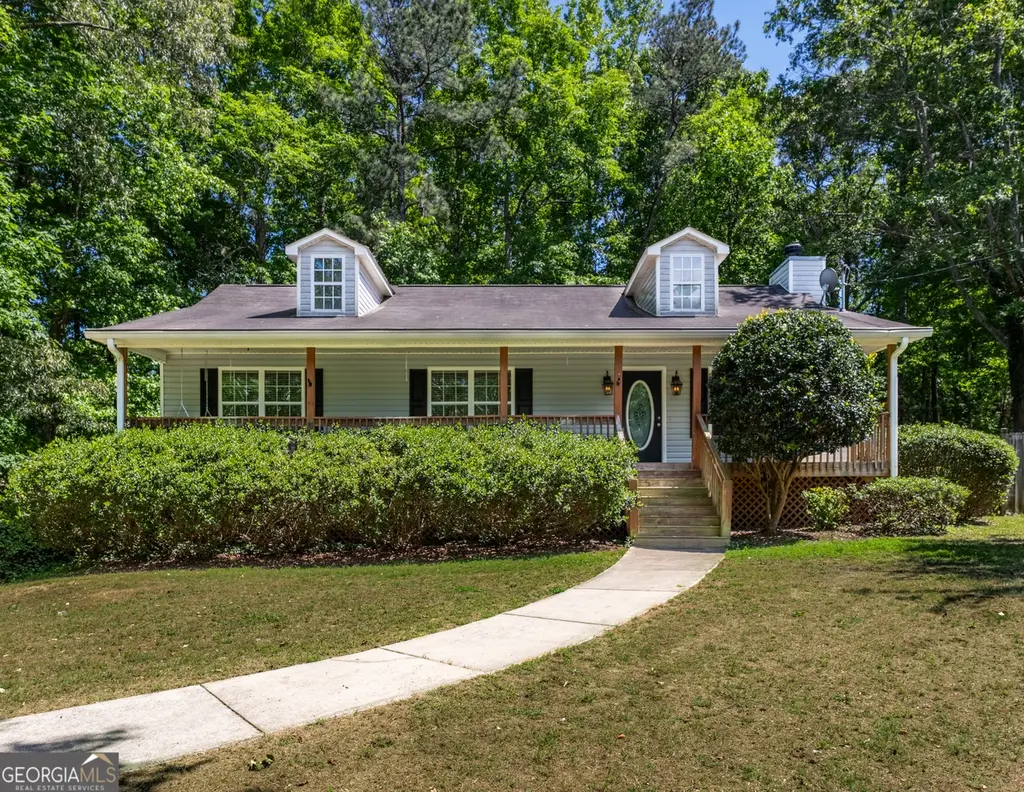
80 Alloway Dr · Fairfield Plantation, GA
Flood risk 1/10 · Minimal
- FEMA flood zone
- X (unshaded)
- Chance of flooding over 30 yrs
- 0.0%
- Est. flood insurance / yr
- $473 – $860
Fire risk 4/10 · Minor
- Est. fire insurance / yr
- $963 – $1,789
Heat risk 5/10 · Moderate
- Hot days now (above 102°F)
- 7 days/yr
- Hot days in 30 yrs
- 19 days/yr
Wind risk 6/10 · Moderate
- Chance of severe wind over 30 yrs
- 27.0%
Air-quality risk 3/10 · Minor
- Unhealthy air days now
- 3 days/yr
- Unhealthy air days in 30 yrs
- 4 days/yr
Risk factors via First Street. Map © Google.
Why this score? — see what drove the D grade
The composite is a weighted blend of 9 inputs, each scored 0–100. Each bar is that input's sub-score; the figure is the points it added to the 100-point composite (weight × sub-score).
- Cash flow +12.4/30.0
- ARV discount +10.2/15.0
- DSCR +3.7/10.0
- Schools +3.6/10.0
- Rent growth +3.1/5.0
- 1% rule +2.8/10.0
- Livability +2.5/5.0
- Condition / age +2.5/5.0
- Appreciation +0.0/10.0
$260,000
🖨 Deal sheet (PDF) 📄 Offer letter ✓ Due diligence
Listing remarks
Welcome home to this charming one-level residence tucked away on a quiet cul-de-sac in Villa Rica! Featuring 3 bedrooms and 2 bathrooms on the main level, this well-maintained home offers a functional and inviting layout perfect for everyday living. Step inside to find beautiful hardwood flooring and a cozy living area highlighted by a wood-burning fireplace-ideal for relaxing evenings at home. The kitchen comes equipped with stainless steel appliances, including a refrigerator, microwave, and oven/range combo, making it both stylish and practical. The tile baths add a clean, updated touch, while the convenient in-hall laundry enhances ease of living. Enjoy outdoor living on the welcoming p
Key facts
- 0.5 acre lot
- Garage
- Built 2004
Property features AI
Finance
- HOA & community: No association
Exterior
- Parking: Attached garage; Garage; Parking pad; Open parking
- Utilities: Public water; Septic tank
- Home design: Single family house; Residential resale
- Construction: Built in 2004; Vinyl siding; Composition roof
- Exterior features: Cul-de-sac lot
Interior
- Kitchen: Dishwasher; Microwave; Refrigerator; Stainless steel appliances
- Bedrooms: 3 bedrooms on the main level
- Flooring: Vinyl; Other
- Bathrooms: 2 full bathrooms (both on the main level)
- Heating & cooling: Central heating; Central air conditioning
- Interior features: Double vanity; Family room; One level; Fireplace (1)
- Laundry & utility: Laundry in hall
Neighborhood map
What this means for you Summary
Snapshot
- This is a 3-bed/2.0-bath single-family listed at $260k.
Deal economics
- At list price, monthly cash flow is $-44 ($-533/yr) — negative.
- To cash-flow at today's rent, offer at most $252k (3.0% below list).
- To meet the 1% rule (rent ≥ 1% of price), the offer needs to be $203k (22.0% below list).
- Recommended offer: $203k (22.0% below list) — sets the bar for 1% rule.
- Cap rate 6.1% vs local median 2.8% in Fairfield Plantation — top-decile yield for the area; either an underpriced asset or a hidden risk that comps aren't pricing in. Stress-test before assuming the spread holds.
Location & tenants
- Location reads: area grade D — affects rentability + tenant quality, not the cash-flow math above.
- Carroll County (rural): math 42% / reading 41% proficiency, ranked #38 of 174 in GA (top 22%) — families likely to look elsewhere, expect single-tenant / working-renter base with shorter leases.
- Zoned schools: Sand Hill Elementary School (math 48% / reading 33%, grade F, #419 of 1,228 statewide, top 35%, 696 students, 58% FRL); Bay Springs Middle School (math 42% / reading 42%, grade D-, #126 of 470 statewide, top 28%, 930 students, 57% FRL); Villa Rica High School (math 16% / reading 34%, grade F, #181 of 424 statewide, top 43%, 1,807 students, 56% FRL) — zoned schools at 57% FRL track the district average.
- Market conditions: Rents rising (+2.4%/yr); 669 active listings in the ZIP; 1 comparable units currently listed for rent nearby; solid renter incomes; 876 units permitted in Carroll County in 2024 (150 in 5+ unit buildings).
Forward outlook
- Local home prices are declining (-3.0%/yr); year-one equity from $2k of loan paydown is wiped out by about $8k of value loss. Plan a longer hold.
- Carroll County population projected at +12% by 2050 — modest demand growth; plan on rents tracking national, not racing it.
Negotiation context
- Only 14 days on market — expect competitive offers; lowballing is unlikely to land.
- Current owner paid $16k; list at $260k implies a 1525% gain — meaningful room to come down on a strong offer.
Risks & watch-outs
- Climate carrying-cost: major wind risk, 27% chance of damaging wind over 30y; extreme-heat days projected 7→19/yr by 2055 (HVAC capex compounding) — expect insurance premiums to compound above CPI over the hold.
Questions for the listing agent
- What do current leases actually rent for vs. the listed asking? Can we see a recent rent roll and the last 12 months of T-12 income?
- Is there a deadline driving the sale (1031 exchange, divorce, estate, relocation)? That informs how much negotiation room exists.
- The area grade is low — what's the realistic commute time and amenity access for the typical tenant pool here? Any planned neighborhood developments (good or bad) we should know about?
- What's the average days-on-market for RENTAL listings here right now (not sales)? A rising rental-DOM trend means longer vacancies and softer asking-rent achievability than the comps imply.
- What's the recent tenant-quality profile in this submarket — average credit score on applications, eviction rate, late-payment / NSF rate, and stable-employment percentage? A property-management company in the area should have these aggregated.
- How much new for-sale + rental construction is in the pipeline within 1–3 miles? Heavy new supply typically softens prices + rents 12–24 months out; constrained supply supports both.
Investment metrics
- 1% rule
- 0.78% ✗
- Cap rate
- 6.09%
- Cash-on-cash
- -0.73%
- DSCR
- 0.97
- GRM
- 10.7
CMA / ARV
- ARV (median comp)
- $276,761
- List price
- $260,000
- Delta
- -6.06%
- Verdict
- FAIR
- Comps
- 20 within 1.0 mi
Show comp detail 5 sales within ~0.75 mi
| Address | Dist | Beds/Ba | Sqft | Sold | Price | $/sf | Match |
|---|---|---|---|---|---|---|---|
| 80 Alloway Dr | 0.00mi | 3/2.0 | 1,344 (0%) | 0mo | $250,000 | $186 | 100 |
| 3078 Essex Dr | 0.32mi | 3/2.0 | 1,282 (-5%) | 4mo | $237,500 | $185 | 75 |
| 180 Fairfield Rd | 0.14mi | 3/2.0 | 1,264 (-6%) | 18mo | $279,900 | $221 | 68 |
| 227 Taylor Ridge Trl | 0.12mi | 3/2.0 | 1,457 (+8%) | 15mo | $293,835 | $202 | 68 |
| 4032 Golfview Dr | 0.62mi | 3/2.0 | 1,319 (-2%) | 10mo | $260,000 | $197 | 60 |
Match score weights: distance 35% · size 25% · config 20% · recency 20%. Top-matched comps best support the ARV.
Projected returns pro-forma
-3.0% appreciation · 2.42% rent growth · sell at horizon
- IRR
- -18.1%
- Equity multiple
- 0.37×
- Total profit
- $-46,198
- Equity at exit
- $38,767
- IRR
- -11.5%
- Equity multiple
- 0.33×
- Total profit
- $-48,894
- Equity at exit
- $22,480
Cash invested: $72,800 (down + closing). Projections, not guarantees.
Landlord ↔ Tenant lean methodology
- Overall (STATE)
- 90 Strongly Landlord-Friendly
- State Georgia
- 90 Strongly Landlord-Friendly · R+3
- County
- — inherits STATE
- City
- — inherits STATE
ZIP-level market 30180
- Home prices YoY
- -12.8%
- Rents YoY
- 2.4%
- Active inventory
- 669
- Price-to-rent
- 10.7×
Monthly cashflow live
- Estimated rent
- $2,029 medium interval (Pro) →
- Mortgage (P&I)
- −$1,363
- Tax from tax record
- −$175 /mo · $2,102/yr
- Insurance
- −$108
- HOA
- −$0
- Vacancy / Maint / Mgmt
- −$426
- Net cashflow
- $-44
Break-even live
Sensitivity live
| Price | -10% $103 | -5% $29 | +0% $-44 | +5% $-118 | +10% $-192 |
|---|---|---|---|---|---|
| Rent | -10% $-205 | -5% $-125 | +0% $-44 | +5% $36 | +10% $116 |
| Rate | -1.0pp $87 | -0.5pp $22 | base $-44 | +0.5pp $-112 | +1.0pp $-180 |
UW: 25.0% down · 7.5% · 30yr · 1.5% tax · 5.0% vac · 8.0% maint · 8.0% mgmt
Financing live
Cash to close
- Down payment
- $65,000
- Closing costs
- $7,800
- Reserves months
- —
- Total cash needed
- —
Loan-product check · same deal, 3 products live
Conventional
25% down · 7.5% · 30yr
- Down + closing
- —
- Monthly P&I
- —
- Monthly cashflow
- —
- DSCR
- —
- Eligible?
- —
Personal DTI + credit; lowest rate.
DSCR
20% down · 8.5% · 30yr
- Down + closing
- —
- Monthly P&I
- —
- Monthly cashflow
- —
- DSCR
- —
- Eligible?
- —
No personal income docs; deal must DSCR.
Hard money
10% down · 12.0% · 12mo
- Down + closing
- —
- Monthly P&I
- —
- Monthly cashflow
- —
- DSCR
- —
- Eligible?
- —
Short-term bridge; refi at stabilization.
Rent comps 1 comps
| Address | Beds | Baths | Sqft | Rent | $/sqft | DOM | Units | Dist |
|---|---|---|---|---|---|---|---|---|
| 37 Abbotsford Dr Villa Rica, GA | 3.0 | 3.0 | 1602 | $2,099 | $1.31 | 7d | 1 | 0.07mi |
Listing history 5 events
-
2026-04-28$260,000 New 1084-char remark
-
2003-10-07soldstatus $16,000
-
2003-01-09soldstatus $617,773
-
1995-12-18soldstatus $560,000
-
1994-08-24soldstatus $700,000
ⓘ Source: listings_history table (triggers on properties + properties_extension) + one-shot
backfill from property_details.listing_events for pre-trigger history.
Tax reassessment forecast GA · Resets to sale price
- Current annual tax
- $2,102 · $175/mo
- Projected year-2 tax
- $2,392 · $199/mo
- Expected delta
- +$290/yr (+$24/mo · 13.8%)
ⓘ Screening estimate from a state-policy table — verify with the county assessor before closing.
Climate risk First Street
- Flood 1/10 Low FEMA zone X (unshaded) · 0% chance over 30 yrs
- Wildfire 4/10 Moderate
- Heat 5/10 Major 7 d/yr ≥102°F today · 19 d/yr by 30 yrs out
- Wind 6/10 Major 27% chance of damaging wind over 30 yrs
- Air quality 3/10 Moderate 3 unhealthy d/yr today · 4 by 30 yrs out
Nearby sold comps map
Loading sold comps map…
Walkable amenities ~0.75 mi
Loading nearby amenities…
Taxation est. · year 1
- Rental income
- $24,342
- − Mortgage interest
- −$14,564
- − Property taxes
- −$2,102
- − Insurance
- −$1,300
- − Repairs & maintenance
- −$1,947
- − Management
- −$1,947
- − Depreciation
- −$7,564
- Taxable loss
- −$5,082
- Est. tax savings @ 24.0%
- +$1,220
- After-tax cash flow
- $687/yr
For passive investors: Depreciation is non-cash, so a rental often shows a tax loss while cash-flowing — sheltering income. Rental losses are passive: they offset passive income freely, and up to $25,000/yr can offset ordinary (W-2) income if you actively participate and your MAGI is under $100k (phasing out to $0 by $150k); unused losses carry forward. On sale, claimed depreciation is recaptured at up to 25%, and gains may owe capital-gains tax (a 1031 exchange can defer both). Figures are a year-1 estimate at your 24.0% rate — not tax advice; consult a CPA.
Schools (NCES district)
- District
- Carroll County
- NCES district ID
- 1300840
- Math proficiency
- 42% ▼ -7.00%
- Reading proficiency
- 41% ▼ -8.00%
- Median HH income
- $48,692
- Composite
- 35.62/100
- National rank
- #4888
- State rank
- #38 of 174 in GA
Livability — Fairfield Plantation
No livability data for this city. (Only ~50 U.S. cities are tracked.)
Census & demographics
- Census place
- Fairfield Plantation, GA
- County
- Carroll County · 124,888 people
- Metro
- Atlanta-Sandy Springs-Alpharetta, GA
- Population (ZIP)
- 43,013
- Household income
- $88,514
- Rent vs Own
- Severe rent burden
- 853.0
Population outlook (Carroll County) Hauer SSP2
- Today (2025)
- 123,370 people
- By 2030
- 127,186 · +3.1%
- By 2040
- 133,534 · +8.2%
- By 2050
- 137,612 · +11.5%
- By 2075
- 142,892 · +15.8%
- By 2100
- 136,294 · +10.5%
Race, ethnicity, and origin ACS 2023
- Neighborhood character
- Diverse neighborhood (Simpson 0.59)
- Race & ethnicity
- White 57% Black 29% Hispanic / Latino 7% Two or more races 7% Asian 2%
- Hispanic origin (detail)
- Mexican 5% Puerto Rican 1%
- Common ancestry
- German 1% Slovak 1% Italian 1%
- Foreign-born
- 8% · Canada
- Languages at home
- 92% English-only · Spanish 5% Other Indo-European 2% French/Haitian/Cajun 1%
Political lean MEDSL · Carroll
- 2024 margin
- Solid R (+41.2) · D 29.1% · R 70.3%
- 2008→2024 swing
- -8.2pp toward R · 2008: -32.9pp · 2024: -41.2pp
- All cycles
- 2024: R+41.2 2020: R+39.0 2016: R+40.1 2012: R+37.7 2008: R+32.9
Not yet ingested
- Civics
- —
Market trends
- HPI YoY
- ▼ -46.97%
- Current HPI
- 321.1874
- Rent YoY
- ▲ 2.42%
- Metro
- Atlanta-Sandy Springs-Alpharetta, GA
- State GDP YoY
- ▲ 2.66%
- F500 in state
- 28
Industry mix (Fortune 500 HQ in GA)
| Industry | F500 HQs | Revenue |
|---|---|---|
| Paper / Packaging | 2 | $29B |
|
||
| Retail | 1 | $160B |
|
||
| Transportation / Logistics | 1 | $91B |
|
||
| Airlines | 1 | $62B |
|
||
| Consumer Goods | 1 | $47B |
|
||
| Utilities | 1 | $25B |
|
||
Price history
-62.9% since first listed6 events — show timeline
- 2026-05-21 Pending — GAMLS
- 2026-04-28 Listed $260,000 GAMLS
- 2003-10-07 Sold (Public Records) $16,000 Public Records
- 2003-01-09 Sold (Public Records) $617,773 Public Records
- 1995-12-18 Sold (Public Records) $560,000 Public Records
- 1994-08-24 Sold (Public Records) $700,000 Public Records
Property tax history
+3.1%/yrLatest (2025): $2,102 · +2.1% YoY. Source: county tax records.
Cash-flow waterfall
monthlySold comps — $/sqft
last 12 mo · ≤1 miLoading sold comps…