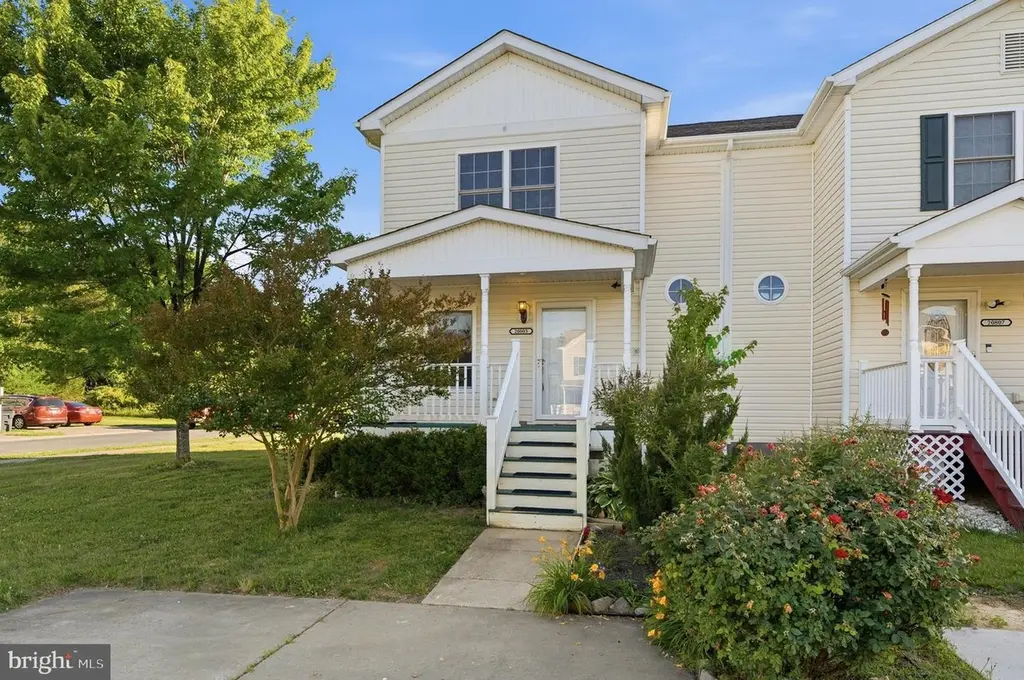
20803 Primrose Ct · Lexington Park, MD
Flood risk 1/10 · Minimal
- FEMA flood zone
- X (unshaded)
- Chance of flooding over 30 yrs
- 0.0%
- Est. flood insurance / yr
- $507 – $1,088
Fire risk 4/10 · Minor
- Est. fire insurance / yr
- $755 – $1,403
Heat risk 9/10 · Severe
- Hot days now (above 100°F)
- 7 days/yr
- Hot days in 30 yrs
- 18 days/yr
Wind risk 6/10 · Moderate
- Chance of severe wind over 30 yrs
- 68.0%
Air-quality risk 2/10 · Minimal
- Unhealthy air days now
- 1 days/yr
- Unhealthy air days in 30 yrs
- 1 days/yr
Risk factors via First Street. Map © Google.
Why this score? — see what drove the D+ grade
The composite is a weighted blend of 9 inputs, each scored 0–100. Each bar is that input's sub-score; the figure is the points it added to the 100-point composite (weight × sub-score).
- Cash flow +17.8/30.0
- ARV discount +7.5/15.0
- DSCR +5.6/10.0
- 1% rule +4.6/10.0
- Appreciation +3.2/10.0
- Livability +3.1/5.0
- Schools +3.0/10.0
- Rent growth +2.6/5.0
- Condition / age +2.5/5.0
$230,000
🖨 Deal sheet 📄 Offer letter ✓ Due diligence
Listing remarks
CHARMING end-unit townhome tucked away in a convenient Lexington Park location. Offering 3 bedrooms, 2 full baths, and a thoughtfully designed layout, this home combines comfort, functionality, and value in one inviting package. Step onto the covered front porch and into a bright, spacious living room filled with natural light. The main level flows effortlessly into the dining area and kitchen, creating an ideal space for both everyday living and entertaining. Just beyond the kitchen, a rear deck overlooks the fenced backyard, providing the perfect setting for summer cookouts, morning coffee, or relaxing evenings outdoors. A storage shed adds extra space for tools, lawn equipment, and seaso
Key facts
- Covered front porch
- End-unit
- Natural light
Tags
Property features AI
Finance
- Other: Not in a federal flood zone; Pets allowed with no specific restrictions; Ground rent paid annually
- HOA & community: HOA fee of $196 charged quarterly
Exterior
- Parking: Two total garage/parking spaces; Driveway with two spaces; On-street parking; Concrete driveway
- Utilities: Public water; Public sewer; Electric hot water
- Home design: End-of-row townhouse; Fee simple ownership; Good condition; Year built (per assessor)
- Construction: Vinyl siding; Architectural shingle roof; Crawl space foundation
- Exterior features: Deck(s); Fully fenced yard with vinyl picket fencing; Corner, level, cleared lot; Shed
Interior
- Kitchen: Electric oven/range; Range hood; Stove; Exhaust fan; Dishwasher
- Bedrooms: Three bedrooms on the lower level
- Flooring: Carpet; Laminate
- Bathrooms: Two full bathrooms (one on main level, one on lower level)
- Heating & cooling: Heat pump heating; Central air conditioning; Ceiling fans; Electric heating and cooling
- Interior features: Attic; Tub with shower; Ceiling fans; Dining area; Traditional floor plan; Formal dining room; Walk-in closets; Window treatments; Storm doors; Drywall walls and ceilings
- Laundry & utility: Washer and dryer (front-loading) in unit; Main floor laundry; Water heater
Neighborhood map
What this means for you Summary
Snapshot
- This is a 3-bed/2.0-bath townhouse listed at $230k.
Deal economics
- At list price, monthly cash flow is $188 ($2k/yr) — positive.
- The deal already cash-flows at list — no discount required.
- To meet the 1% rule (rent ≥ 1% of price), the offer needs to be $220k (4.3% below list).
- Recommended offer: $220k (4.3% below list) — sets the bar for 1% rule.
- Cap rate 7.3% vs local median 4.0% in Lexington Park — top-decile yield for the area; either an underpriced asset or a hidden risk that comps aren't pricing in. Stress-test before assuming the spread holds.
Location & tenants
- Location reads 61/100 on livability (#331 in MD) — a middle-class / working-renter tenant base. Strengths: employment A+, housing A; Watch: crime F, amenities F, commute F.
- St. Mary'S County Public Schools (rural): math 23% / reading 38% proficiency, ranked #8 of 24 in MD (top 33%) — families likely to look elsewhere, expect single-tenant / working-renter base with shorter leases.
- Zoned schools: Park Hall Elementary (math 12% / reading 17%, grade F, #477 of 860 statewide, top 59%, 501 students, 63% FRL); Spring Ridge Middle (math 15% / reading 39%, grade F, #81 of 225 statewide, top 38%, 987 students, 60% FRL); Great Mills High (math 42% / reading 55%, grade D, #111 of 222 statewide, top 50%, 1,779 students, 55% FRL) — zoned schools average 60% FRL vs 28% district-wide (32 pts higher); higher-poverty schools than district average — tighter screening recommended.
- Market conditions: Rents flat; 91 active listings in the ZIP; solid renter incomes; 265 units permitted in St. Mary's County in 2024 (0 in 5+ unit buildings).
Forward outlook
- Local home prices are declining (-3.0%/yr); year-one equity from $2k of loan paydown is wiped out by about $7k of value loss. Plan a longer hold.
- St. Mary's County population projected at +16% by 2050 — long-run rental-demand tailwind backs the buy-and-hold thesis.
Negotiation context
- Only 3 days on market — expect competitive offers; lowballing is unlikely to land.
Risks & watch-outs
- Climate carrying-cost: major wind risk, 68% chance of damaging wind over 30y; extreme-heat days projected 7→18/yr by 2055 (HVAC capex compounding) — expect insurance premiums to compound above CPI over the hold.
Questions for the listing agent
- What does the HOA fee cover, when was the last increase, and are there any pending special assessments or reserve-fund shortfalls?
- Is there a deadline driving the sale (1031 exchange, divorce, estate, relocation)? That informs how much negotiation room exists.
- Schools are D-rated, which usually means shorter tenancies and higher turnover. Who's the typical renter profile here, and what's been the actual vacancy rate?
- Crime grade is F in this area — have there been break-ins, vandalism, or insurance claims at this property in the last 3 years? What carrier currently insures it and at what premium?
- The area grade is low — what's the realistic commute time and amenity access for the typical tenant pool here? Any planned neighborhood developments (good or bad) we should know about?
- What's the average days-on-market for RENTAL listings here right now (not sales)? A rising rental-DOM trend means longer vacancies and softer asking-rent achievability than the comps imply.
- What's the recent tenant-quality profile in this submarket — average credit score on applications, eviction rate, late-payment / NSF rate, and stable-employment percentage? A property-management company in the area should have these aggregated.
- How much new for-sale + rental construction is in the pipeline within 1–3 miles? Heavy new supply typically softens prices + rents 12–24 months out; constrained supply supports both.
Investment metrics
- 1% rule
- 0.96% ✗
- Cap rate
- 7.28%
- Cash-on-cash
- 3.51%
- DSCR
- 1.16
- GRM
- 8.7
CMA / ARV
No comps found within radius.
Projected returns pro-forma
-3.0% appreciation · 0.49% rent growth · sell at horizon
- IRR
- -13.6%
- Equity multiple
- 0.52×
- Total profit
- $-30,688
- Equity at exit
- $34,294
- IRR
- -9.1%
- Equity multiple
- 0.50×
- Total profit
- $-32,401
- Equity at exit
- $19,886
Cash invested: $64,400 (down + closing). Projections, not guarantees.
Landlord ↔ Tenant lean methodology
- Overall (STATE)
- 27 Tenant-Leaning
- State Maryland
- 27 Tenant-Leaning · D+14
- County
- — inherits STATE
- City
- — inherits STATE
ZIP-level market 20653
- Home prices YoY
- -1.4%
- Rents YoY
- 0.5%
- Active inventory
- 91
- Price-to-rent
- 8.7×
Monthly cashflow live
- Estimated rent
- $2,201 medium interval (Pro) →
- Mortgage (P&I)
- −$1,206
- Tax from tax record
- −$184 /mo · $2,204/yr
- Insurance
- −$96
- HOA
- −$65
- Vacancy / Maint / Mgmt
- −$462
- Net cashflow
- $188
Break-even live
UW: 25.0% down · 7.5% · 30yr · 1.5% tax · 5.0% vac · 8.0% maint · 8.0% mgmt
Financing live
Cash to close
- Down payment
- $57,500
- Closing costs
- $6,900
- Reserves months
- —
- Total cash needed
- —
Loan-product check · same deal, 3 products live
Conventional
25% down · 7.5% · 30yr
- Down + closing
- —
- Monthly P&I
- —
- Monthly cashflow
- —
- DSCR
- —
- Eligible?
- —
Personal DTI + credit; lowest rate.
DSCR
20% down · 8.5% · 30yr
- Down + closing
- —
- Monthly P&I
- —
- Monthly cashflow
- —
- DSCR
- —
- Eligible?
- —
No personal income docs; deal must DSCR.
Hard money
10% down · 12.0% · 12mo
- Down + closing
- —
- Monthly P&I
- —
- Monthly cashflow
- —
- DSCR
- —
- Eligible?
- —
Short-term bridge; refi at stabilization.
HOA detail
- Monthly dues
- $65 · $780/yr
Listing history 4 events
-
2026-06-15pricestatusdays on market $230,000 Pending 3 DOM
-
2026-06-14days on market $209,900 Active 2 DOM
-
2026-06-12remarks 699-char remark
-
2026-06-12$209,900 Active 1 DOM
ⓘ Source: listings_history table (triggers on properties + properties_extension) + one-shot
backfill from property_details.listing_events for pre-trigger history.
Tax reassessment forecast MD · Partial reset (capped growth)
- Current annual tax
- $2,204 · $184/mo
- Projected year-2 tax
- $2,356 · $196/mo
- Expected delta
- +$151/yr (+$13/mo · 6.9%)
ⓘ Screening estimate from a state-policy table — verify with the county assessor before closing.
Climate risk First Street
- Flood 1/10 Low FEMA zone X (unshaded) · 0% chance over 30 yrs
- Wildfire 4/10 Moderate
- Heat 9/10 Extreme 7 d/yr ≥100°F today · 18 d/yr by 30 yrs out
- Wind 6/10 Major 68% chance of damaging wind over 30 yrs
- Air quality 2/10 Low 1 unhealthy d/yr today · 1 by 30 yrs out
Nearby sold comps map
Loading sold comps map…
Walkable amenities ~0.75 mi
Loading nearby amenities…
Taxation est. · year 1
- Rental income
- $26,415
- − Mortgage interest
- −$12,884
- − Property taxes
- −$2,204
- − Insurance
- −$1,150
- − Repairs & maintenance
- −$2,113
- − Management
- −$2,113
- − HOA
- −$780
- − Depreciation
- −$6,691
- Taxable loss
- −$1,520
- Est. tax savings @ 24.0%
- +$365
- After-tax cash flow
- $2,625/yr
For passive investors: Depreciation is non-cash, so a rental often shows a tax loss while cash-flowing — sheltering income. Rental losses are passive: they offset passive income freely, and up to $25,000/yr can offset ordinary (W-2) income if you actively participate and your MAGI is under $100k (phasing out to $0 by $150k); unused losses carry forward. On sale, claimed depreciation is recaptured at up to 25%, and gains may owe capital-gains tax (a 1031 exchange can defer both). Figures are a year-1 estimate at your 24.0% rate — not tax advice; consult a CPA.
Schools (NCES district)
- District
- St. Mary'S County Public Schools
- NCES district ID
- 2400600
- Math proficiency
- 23% ▼ -23.00%
- Reading proficiency
- 38% ▼ -12.00%
- Median HH income
- $83,240
- Composite
- 29.74/100
- National rank
- #6444
- State rank
- #8 of 24 in MD
Livability — Lexington Park
- Score
- 61/100
- State rank
- #331
- US rank
- #17418
Category grades
Schools grade is shown separately in the Schools card above.
Census & demographics
- County
- Saint Marys County · 48,152 people
- City population
- 14,212
- Metro
- California-Lexington Park, MD
- Population (ZIP)
- 26,852
- Household income
- $103,048
- Rent vs Own
- Severe rent burden
- 1571.0
Population outlook (St. Mary's County) Hauer SSP2
- Today (2025)
- 123,125 people
- By 2030
- 128,374 · +4.3%
- By 2040
- 137,305 · +11.5%
- By 2050
- 143,065 · +16.2%
- By 2075
- 153,408 · +24.6%
- By 2100
- 151,790 · +23.3%
Race, ethnicity, and origin ACS 2023
- Neighborhood character
- Diverse neighborhood (Simpson 0.63)
- Race & ethnicity
- White 54% Black 28% Two or more races 11% Hispanic / Latino 6% Asian 4%
- Hispanic origin (detail)
- Mexican 3% Puerto Rican 1%
- Common ancestry
- Romanian 2% Slovak 2% Italian 1%
- Foreign-born
- 6% · Canada, Jamaica
- Languages at home
- 92% English-only · Spanish 3% Tagalog/Filipino 3% Other Asian/Pacific 1%
Political lean MEDSL · St. Mary's
- 2024 margin
- R (+17.2) · D 40.2% · R 57.4% · Other 2.4%
- 2008→2024 swing
- -4.4pp toward R · 2008: -12.8pp · 2024: -17.2pp
- All cycles
- 2024: R+17.2 2020: R+13.8 2016: R+24.6 2012: R+16.1 2008: R+12.8
Not yet ingested
- Civics
- —
Market trends
- HPI YoY
- ▼ -3.67%
- Current HPI
- 256.5435
- Rent YoY
- ▲ 0.49%
- Metro
- California-Lexington Park, MD
- State GDP YoY
- ▲ 2.97%
- F500 in state
- 12
Industry mix (Fortune 500 HQ in MD)
| Industry | F500 HQs | Revenue |
|---|---|---|
| Aerospace / Defense | 1 | $71B |
|
||
| Utilities | 1 | $25B |
|
||
| Hotels | 1 | $24B |
|
||
| Consumer Goods | 1 | $7B |
|
||
| Real Estate | 1 | $6B |
|
||
| Chemicals | 1 | $2B |
|
||
Price history
1 event — show timeline
- 2026-06-11 Listed $209,900 BRIGHT MLS
Property tax history
+8.1%/yrLatest (2025): $2,204 · +3.3% YoY. Source: county tax records.
Cash-flow waterfall
monthlySold comps — $/sqft
last 12 mo · ≤1 miLoading sold comps…