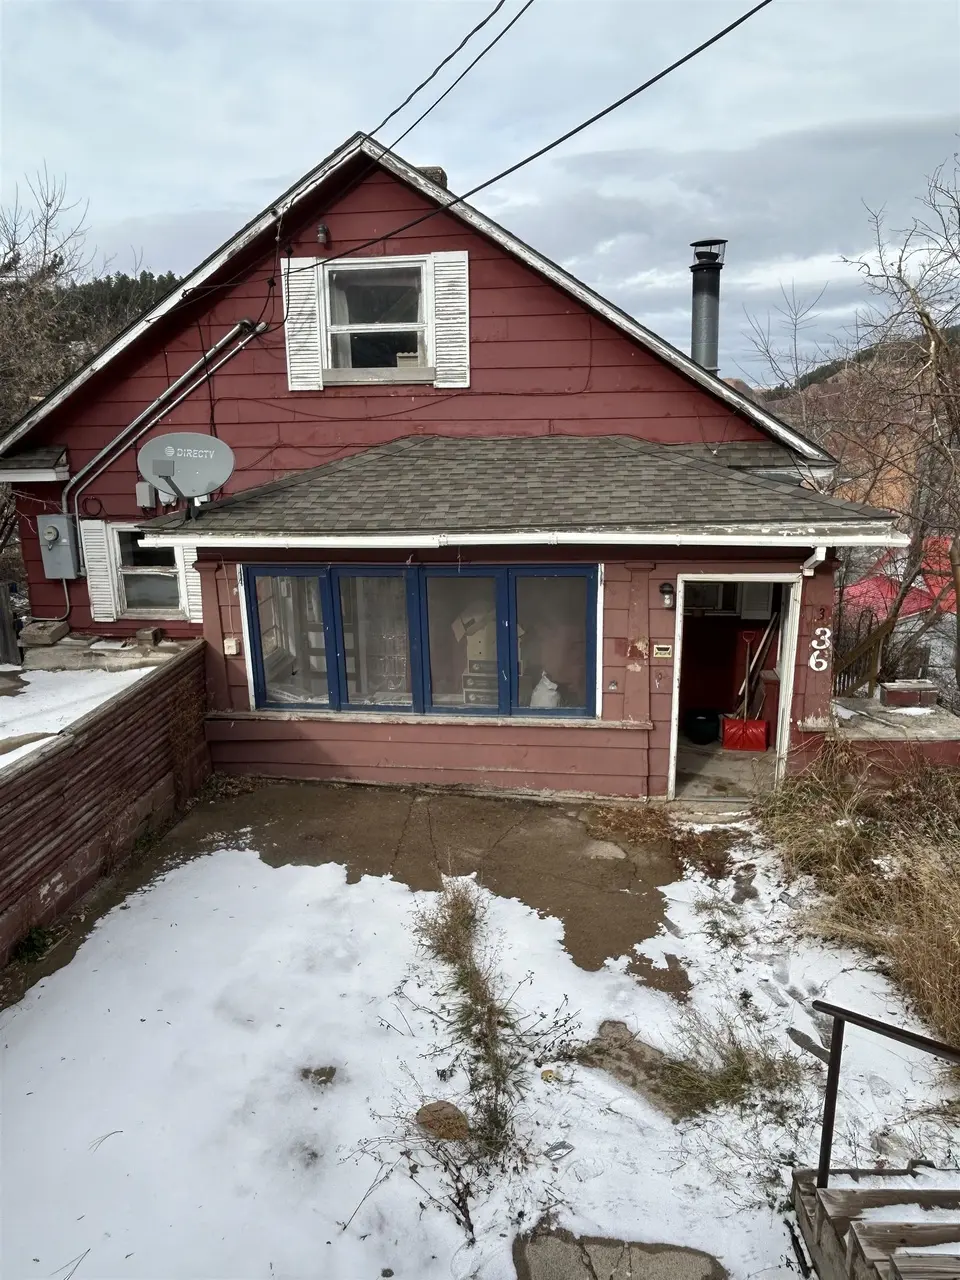
336 W Addie St · Lead, SD
Flood risk 1/10 · Minimal
- FEMA flood zone
- X (unshaded)
- Chance of flooding over 30 yrs
- 0.0%
- Est. flood insurance / yr
- $507 – $1,088
Fire risk 7/10 · Major
- Est. fire insurance / yr
- $1,342 – $2,492
Heat risk 1/10 · Minimal
- Hot days now (above 86°F)
- 7 days/yr
- Hot days in 30 yrs
- 17 days/yr
Wind risk 2/10 · Minimal
- Chance of severe wind over 30 yrs
- —
Air-quality risk 2/10 · Minimal
- Unhealthy air days now
- 1 days/yr
- Unhealthy air days in 30 yrs
- 2 days/yr
Risk factors via First Street. Map © Google.
Why this score? — see what drove the C- grade
The composite is a weighted blend of 9 inputs, each scored 0–100. Each bar is that input's sub-score; the figure is the points it added to the 100-point composite (weight × sub-score).
- Cash flow +16.0/30.0
- ARV discount +15.0/15.0
- DSCR +4.9/10.0
- 1% rule +3.8/10.0
- Livability +3.5/5.0
- Schools +3.4/10.0
- Rent growth +2.5/5.0
- Condition / age +2.5/5.0
- Appreciation +0.0/10.0
$130,000
🖨 Deal sheet (PDF) 📄 Offer letter ✓ Due diligence
Key facts
- 3,049 sq ft lot
- Built 1905
- Listed 203 days
Neighborhood map
What this means for you Summary
Snapshot
- This is a 3-bed/4.0-bath single-family listed at $130k.
Deal economics
- At list price, monthly cash flow is $65 ($775/yr) — positive.
- The deal already cash-flows at list — no discount required.
- To meet the 1% rule (rent ≥ 1% of price), the offer needs to be $115k (11.8% below list).
- Recommended offer: $114k (12.0% below list) — sets the bar for market timing.
- Cap rate 6.9% vs local median 0.4% in Lead — top-decile yield for the area; either an underpriced asset or a hidden risk that comps aren't pricing in. Stress-test before assuming the spread holds.
Location & tenants
- Location reads 69/100 on livability (#69 in SD) — a middle-class / working-renter tenant base. Strengths: crime A+, cost of living A+, housing A+; Watch: employment D, amenities F, commute F.
- Lead-Deadwood School District 40-1 (town): math 35% / reading 45% proficiency, ranked #51 of 59 in SD (top 86%) — families likely to look elsewhere, expect single-tenant / working-renter base with shorter leases.
- Zoned schools: Lead-Deadwood Elementary - 03 (math 37% / reading 42%, grade F, #169 of 253 statewide, top 71%, 293 students, 33% FRL); Lead-Deadwood Middle School - 02 (math 37% / reading 47%, grade D-, #93 of 143 statewide, top 67%, 159 students, 37% FRL); Lead-Deadwood High School - 01 (math 24% / reading 54%, grade F, #123 of 151 statewide, top 83%, 222 students, 20% FRL).
- Market conditions: 334 active listings in the ZIP; 217 units permitted in Lawrence County in 2024 (11 in 5+ unit buildings).
Forward outlook
- Local home prices are declining (-3.0%/yr); year-one equity from $899 of loan paydown is wiped out by about $4k of value loss. Plan a longer hold.
- Lawrence County population projected at +17% by 2050 — long-run rental-demand tailwind backs the buy-and-hold thesis.
Negotiation context
- It's been on market 203 days — a 12% lower offer ($114k) is reasonable based on typical stale-listing flexibility.
- 7 sale attempts since 4y ago; this cycle's ask has dropped $29k (18%) from the opening price — seller is motivated, your offer sets the floor, not the list.
Risks & watch-outs
- Watch-outs: built in 1905 — expect roof / HVAC / electrical / plumbing capex.
- Climate carrying-cost: major wildfire risk — expect insurance premiums to compound above CPI over the hold.
Questions for the listing agent
- It's been on market 203 days. Have you received any prior offers? Is the seller open to a 12% concession, seller financing, or rate buy-down credit?
- Built in 1905 — when were the roof, HVAC, electrical panel, plumbing, and water heater last replaced?
- Why hasn't it sold? Are there any deal-killer items the seller is aware of (foundation, flood, title, zoning, code violations)?
- Is there a deadline driving the sale (1031 exchange, divorce, estate, relocation)? That informs how much negotiation room exists.
- Schools are D-rated, which usually means shorter tenancies and higher turnover. Who's the typical renter profile here, and what's been the actual vacancy rate?
- What's the average days-on-market for RENTAL listings here right now (not sales)? A rising rental-DOM trend means longer vacancies and softer asking-rent achievability than the comps imply.
- What's the recent tenant-quality profile in this submarket — average credit score on applications, eviction rate, late-payment / NSF rate, and stable-employment percentage? A property-management company in the area should have these aggregated.
- How much new for-sale + rental construction is in the pipeline within 1–3 miles? Heavy new supply typically softens prices + rents 12–24 months out; constrained supply supports both.
Investment metrics
- 1% rule
- 0.88% ✗
- Cap rate
- 6.89%
- Cash-on-cash
- 2.13%
- DSCR
- 1.09
- GRM
- 9.5
CMA / ARV
- ARV (on-the-fly)
- $187,740
- Comps found
- 12
Show comp detail 12 sales within ~0.75 mi
| Address | Dist | Beds/Ba | Sqft | Sold | Price | $/sf | Match |
|---|---|---|---|---|---|---|---|
| 403 W Mcclellan St | 0.10mi | 3/1.5 | 1,341 (+6%) | 11mo | $290,000 | $216 | 65 |
| 113 Alert St | 0.23mi | 3/1.0 | 1,305 (+4%) | 8mo | $174,900 | $134 | 65 |
| 107 1/2 Spark St | 0.03mi | 3/1.0 | 1,130 (-10%) | 10mo | $47,000 | $42 | 61 |
| 810 Sunnyhill Rd | 0.35mi | 2/1.0 (-1) | 1,295 (+3%) | 2mo | $255,000 | $197 | 61 |
| 217 Gold St | 0.21mi | 3/2.0 | 1,350 (+7%) | 13mo | $255,000 | $189 | 60 |
| 121 S Stone St | 0.06mi | 3/1.0 | 1,100 (-13%) | 10mo | $140,000 | $127 | 56 |
| 121 S Other | 0.05mi | 3/1.0 | 1,100 (-13%) | 10mo | $140,000 | $127 | 56 |
| 16 W Mcclellan St | 0.23mi | 3/2.0 | 1,367 (+8%) | 14mo | $230,000 | $168 | 56 |
| 213 Terraville Ave | 0.49mi | 3/1.0 | 1,262 (+0%) | 14mo | $188,000 | $149 | 54 |
| 626 Prospect Ave | 0.23mi | 2/1.0 (-1) | 1,180 (-6%) | 10mo | $97,000 | $82 | 53 |
| 403 Mcquillan Ave | 0.04mi | 2/1.0 (-1) | 1,082 (-14%) | 9mo | $139,320 | $129 | 50 |
| 720 Barclay Ave | 0.53mi | 2/1.5 (-1) | 1,352 (+7%) | 14mo | $225,900 | $167 | 37 |
Match score weights: distance 35% · size 25% · config 20% · recency 20%. Top-matched comps best support the ARV.
Projected returns pro-forma
-3.0% appreciation · 3.0% rent growth · sell at horizon
- IRR
- -12.9%
- Equity multiple
- 0.53×
- Total profit
- $-16,968
- Equity at exit
- $19,383
- IRR
- -4.0%
- Equity multiple
- 0.74×
- Total profit
- $-9,550
- Equity at exit
- $11,240
Cash invested: $36,400 (down + closing). Projections, not guarantees.
Landlord ↔ Tenant lean methodology
- Overall (STATE)
- 83 Strongly Landlord-Friendly
- State South Dakota
- 83 Strongly Landlord-Friendly · R+16
- County
- — inherits STATE
- City
- — inherits STATE
ZIP-level market 57754
- Home prices YoY
- -33.7%
- Active inventory
- 334
- Price-to-rent
- 9.5×
Monthly cashflow live
- Estimated rent
- $1,146 medium interval (Pro) →
- Mortgage (P&I)
- −$682
- Tax from tax record
- −$105 /mo · $1,260/yr
- Insurance
- −$54
- HOA
- −$0
- Vacancy / Maint / Mgmt
- −$241
- Net cashflow
- $65
Break-even live
Sensitivity live
| Price | -10% $138 | -5% $101 | +0% $65 | +5% $28 | +10% $-9 |
|---|---|---|---|---|---|
| Rent | -10% $-26 | -5% $19 | +0% $65 | +5% $110 | +10% $155 |
| Rate | -1.0pp $130 | -0.5pp $98 | base $65 | +0.5pp $31 | +1.0pp $-3 |
UW: 25.0% down · 7.5% · 30yr · 1.5% tax · 5.0% vac · 8.0% maint · 8.0% mgmt
Financing live
Cash to close
- Down payment
- $32,500
- Closing costs
- $3,900
- Reserves months
- —
- Total cash needed
- —
Loan-product check · same deal, 3 products live
Conventional
25% down · 7.5% · 30yr
- Down + closing
- —
- Monthly P&I
- —
- Monthly cashflow
- —
- DSCR
- —
- Eligible?
- —
Personal DTI + credit; lowest rate.
DSCR
20% down · 8.5% · 30yr
- Down + closing
- —
- Monthly P&I
- —
- Monthly cashflow
- —
- DSCR
- —
- Eligible?
- —
No personal income docs; deal must DSCR.
Hard money
10% down · 12.0% · 12mo
- Down + closing
- —
- Monthly P&I
- —
- Monthly cashflow
- —
- DSCR
- —
- Eligible?
- —
Short-term bridge; refi at stabilization.
Listing history 13 events
-
2023-05-29status Pending
-
2023-01-02price $130,000
-
2022-12-09status Active
-
2022-12-09price $140,000
-
2022-11-10historical Active Under Contract
-
2022-10-26$159,000 Active
-
2022-09-19status Active
-
2022-09-19status Active
-
2022-09-12historical Active Under Contract
-
2022-09-12historical Active Under Contract
-
2022-06-16$159,000 Active
-
2022-06-16$159,000 Active
-
2022-02-01$159,000
ⓘ Source: listings_history table (triggers on properties + properties_extension) + one-shot
backfill from property_details.listing_events for pre-trigger history.
Tax reassessment forecast SD · Resets to sale price
- Current annual tax
- $1,260 · $105/mo
- Projected year-2 tax
- $1,703 · $142/mo
- Expected delta
- +$443/yr (+$37/mo · 35.1%)
ⓘ Screening estimate from a state-policy table — verify with the county assessor before closing.
Climate risk First Street
- Flood 1/10 Low FEMA zone X (unshaded) · 0% chance over 30 yrs
- Wildfire 7/10 Severe
- Heat 1/10 Low 7 d/yr ≥86°F today · 17 d/yr by 30 yrs out
- Wind 2/10 Low
- Air quality 2/10 Low 1 unhealthy d/yr today · 2 by 30 yrs out
Nearby sold comps map
Loading sold comps map…
Walkable amenities ~0.75 mi
Loading nearby amenities…
Taxation est. · year 1
- Rental income
- $13,755
- − Mortgage interest
- −$7,282
- − Property taxes
- −$1,260
- − Insurance
- −$650
- − Repairs & maintenance
- −$1,100
- − Management
- −$1,100
- − Depreciation
- −$3,782
- Taxable loss
- −$1,420
- Est. tax savings @ 24.0%
- +$341
- After-tax cash flow
- $1,116/yr
For passive investors: Depreciation is non-cash, so a rental often shows a tax loss while cash-flowing — sheltering income. Rental losses are passive: they offset passive income freely, and up to $25,000/yr can offset ordinary (W-2) income if you actively participate and your MAGI is under $100k (phasing out to $0 by $150k); unused losses carry forward. On sale, claimed depreciation is recaptured at up to 25%, and gains may owe capital-gains tax (a 1031 exchange can defer both). Figures are a year-1 estimate at your 24.0% rate — not tax advice; consult a CPA.
Schools (NCES district)
- District
- Lead-Deadwood School District 40-1
- NCES district ID
- 4641300
- Math proficiency
- 35% ▲ 3.00%
- Reading proficiency
- 45% ▬ 0.00%
- Median HH income
- $45,939
- Composite
- 34.07/100
- National rank
- #5299
- State rank
- #51 of 59 in SD
Livability — Lead
- Score
- 69/100
- State rank
- #69
- US rank
- #8236
Category grades
Schools grade is shown separately in the Schools card above.
Census & demographics
- Census place
- Lead, SD
- Population (ZIP)
- 3,605
Population outlook (Lawrence County) Hauer SSP2
- Today (2025)
- 27,092 people
- By 2030
- 28,137 · +3.9%
- By 2040
- 29,908 · +10.4%
- By 2050
- 31,789 · +17.3%
- By 2075
- 38,917 · +43.6%
- By 2100
- 50,407 · +86.1%
Race, ethnicity, and origin ACS 2023
- Neighborhood character
- Predominantly White (95%)
- Race & ethnicity
- White 95% Two or more races 3% Hispanic / Latino 3%
- Common ancestry
- Portuguese 7% Slovak 4% Scotch-Irish 3%
- Foreign-born
- 1%
- Languages at home
- 97% English-only · Other Indo-European 1% French/Haitian/Cajun 1% Spanish 1%
Political lean MEDSL · Lawrence
- 2024 margin
- Solid R (+31.3) · D 32.9% · R 64.3% · Other 2.8%
- 2008→2024 swing
- -15.9pp toward R · 2008: -15.4pp · 2024: -31.3pp
- All cycles
- 2024: R+31.3 2020: R+30.5 2016: R+34.2 2012: R+26.9 2008: R+15.4
Not yet ingested
- Civics
- —
Market trends
- HPI YoY
- ▼ -105.94%
- Current HPI
- 208.8064
- Rent YoY
- —
- Metro
- —
- State GDP YoY
- ▲ 0.70%
- F500 in state
- 2
Industry mix (Fortune 500 HQ in SD)
| Industry | F500 HQs | Revenue |
|---|---|---|
| Utilities | 1 | $1B |
|
||
Price history
-18.2% since first listed13 events — show timeline
- 2023-05-29 Pending — MRAOR
- 2023-01-02 Price Changed $130,000 MRAOR
- 2022-12-09 Relisted — MRAOR
- 2022-12-09 Price Changed $140,000 MRAOR
- 2022-11-10 Contingent — MRAOR
- 2022-10-26 Listed $159,000 MRAOR
- 2022-09-19 Relisted — MRAOR
- 2022-09-19 Relisted — BHMLS
- 2022-09-12 Contingent — MRAOR
- 2022-09-12 Contingent — BHMLS
- 2022-06-16 Listed $159,000 MRAOR
- 2022-06-16 Listed $159,000 BHMLS
- 2022-02-01 Listed $159,000 MRAOR
Property tax history
+0.1%/yrLatest (2025): $1,260 · -14.8% YoY. Source: county tax records.
Cash-flow waterfall
monthlySold comps — $/sqft
last 12 mo · ≤1 miLoading sold comps…