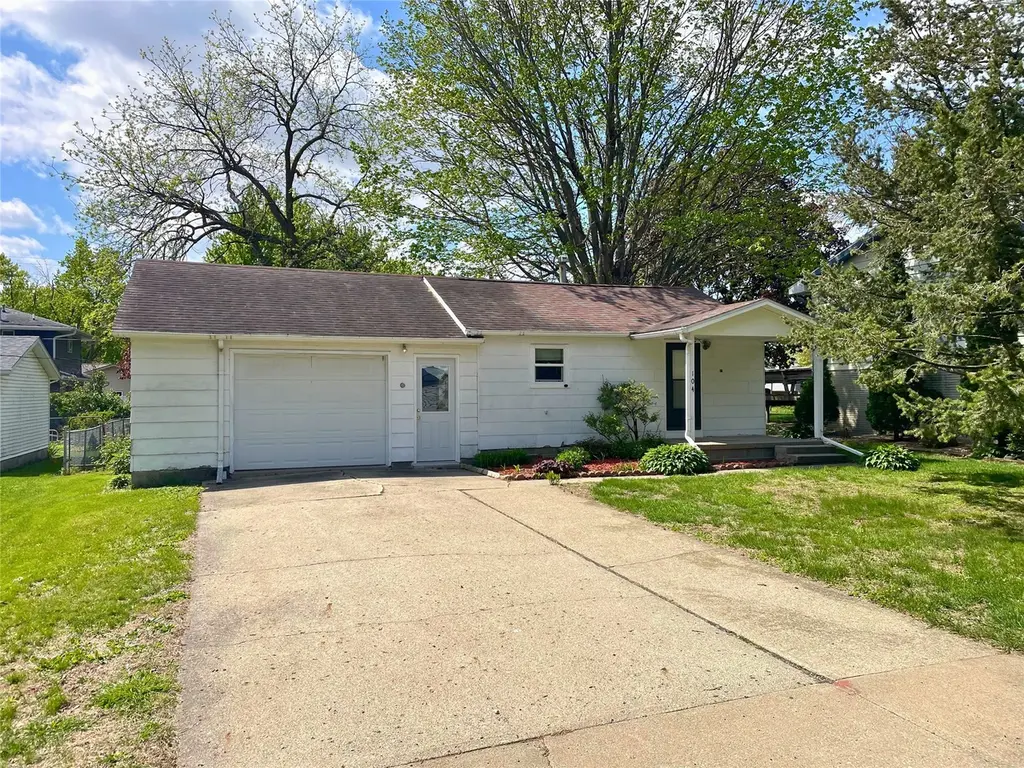
104 W Zickel St · Monroe, IA
Flood risk 1/10 · Minimal
- FEMA flood zone
- X (unshaded)
- Chance of flooding over 30 yrs
- 0.0%
- Est. flood insurance / yr
- $473 – $860
Fire risk 3/10 · Minor
- Est. fire insurance / yr
- $902 – $1,676
Heat risk 3/10 · Minor
- Hot days now (above 105°F)
- 7 days/yr
- Hot days in 30 yrs
- 15 days/yr
Wind risk 2/10 · Minimal
- Chance of severe wind over 30 yrs
- —
Air-quality risk 1/10 · Minimal
- Unhealthy air days now
- 0 days/yr
- Unhealthy air days in 30 yrs
- 0 days/yr
Risk factors via First Street. Map © Google.
Why this score? — see what drove the D grade
The composite is a weighted blend of 9 inputs, each scored 0–100. Each bar is that input's sub-score; the figure is the points it added to the 100-point composite (weight × sub-score).
- Appreciation +9.6/10.0
- Cash flow +7.5/30.0
- ARV discount +7.5/15.0
- Schools +6.0/10.0
- Livability +4.0/5.0
- Rent growth +2.5/5.0
- Condition / age +2.5/5.0
- DSCR +1.6/10.0
- 1% rule +1.4/10.0
$125,000
🖨 Deal sheet 📄 Offer letter ✓ Due diligence
Listing remarks
This 1930 ranch offers one bedroom, a 3/4 bath, and a functional kitchen with included gas range and refrigerator. The living space is efficient, but the attached garage tells a different story. At 528 square feet, it's nearly as large as the home itself and ready for a vehicle, workshop, or serious storage. The fully fenced backyard features mature trees. The unfinished basement adds another 440 square feet of storage. Home is being sold "as-is" with inspection for buyer knowledge only. If you're looking for an affordable entry point in a small Iowa town, this one is worth a look. Reach out and schedule a showing today!
Key facts
- Functional kitchen
- Attached garage
- Unfinished basement
Tags
Property features AI
Finance
- Financial info: Annual tax amount listed
Exterior
- Parking: Attached one-car garage
- Security: Smoke detector(s)
- Utilities: Public water; Public sewer; Natural gas available
- Home design: Single-story home; Cement siding; Block foundation; Asphalt shingle roof; Zoned R
- Construction: Cement siding construction; Built with block foundation; Asphalt shingle roof
- Exterior features: Fully fenced yard; Chain-link full fence; Rectangular lot (60 x 114)
Interior
- Kitchen: Refrigerator; Stove
- Bedrooms: One main-level bedroom
- Bathrooms: One three-quarter bathroom
- Heating & cooling: Forced air heating (natural gas); Window cooling unit(s)
- Interior features: Unfinished basement; Smoke detector(s)
Neighborhood map
What this means for you Summary
Snapshot
- This is a 2-bed/1.0-bath single-family listed at $125k.
Deal economics
- At list price, monthly cash flow is $-155 ($-2k/yr) — negative.
- To cash-flow at today's rent, offer at most $98k (22.0% below list).
- To meet the 1% rule (rent ≥ 1% of price), the offer needs to be $80k (35.8% below list).
- Recommended offer: $80k (35.8% below list) — sets the bar for 1% rule.
Location & tenants
- Location reads 79/100 on livability (#118 in IA, #2,215 nationally) — a middle-class / working-renter tenant base. Strengths: schools A+, crime A+, cost of living A+; Watch: amenities F, commute F.
- Pcm Community School District (rural): math 65% / reading 75% proficiency, ranked #124 of 289 in IA (top 43%) — strong family-tenant draw, lease renewals of 3-5y typical; only 18% free/reduced lunch — higher-income household profile.
- Market conditions: 36 active listings in the ZIP; 16 units permitted in Jasper County in 2024 (0 in 5+ unit buildings).
Forward outlook
- In year one you build about $12k of equity ($864 loan paydown + $12k appreciation (9.3% local appreciation)).
- Jasper County population projected to shrink 7% by 2050 — rents likely to lag national; underwrite the cash flow, not the appreciation.
- By year 3, paydown + projected appreciation supports a ~$31k cash-out refi (75% LTV) — recoverable capital for the next deal without selling this one.
Negotiation context
- It's been on market 30 days — a 2% lower offer ($123k) is reasonable based on typical stale-listing flexibility.
Risks & watch-outs
- Watch-outs: built in 1930 — expect roof / HVAC / electrical / plumbing capex.
Questions for the listing agent
- What do current leases actually rent for vs. the listed asking? Can we see a recent rent roll and the last 12 months of T-12 income?
- Built in 1930 — when were the roof, HVAC, electrical panel, plumbing, and water heater last replaced?
- Is there a deadline driving the sale (1031 exchange, divorce, estate, relocation)? That informs how much negotiation room exists.
- Schools are A-rated — typically a magnet for longer-tenancy family renters. What's the average tenant stay here, and is there a school-zone premium baked into asking?
- The area grade is low — what's the realistic commute time and amenity access for the typical tenant pool here? Any planned neighborhood developments (good or bad) we should know about?
- What's the average days-on-market for RENTAL listings here right now (not sales)? A rising rental-DOM trend means longer vacancies and softer asking-rent achievability than the comps imply.
- What's the recent tenant-quality profile in this submarket — average credit score on applications, eviction rate, late-payment / NSF rate, and stable-employment percentage? A property-management company in the area should have these aggregated.
- How much new for-sale + rental construction is in the pipeline within 1–3 miles? Heavy new supply typically softens prices + rents 12–24 months out; constrained supply supports both.
Investment metrics
- 1% rule
- 0.64% ✗
- Cap rate
- 4.80%
- Cash-on-cash
- -5.33%
- DSCR
- 0.76
- GRM
- 13.0
CMA / ARV
No comps found within radius.
Projected returns pro-forma
9.3% appreciation · 3.0% rent growth · sell at horizon
- IRR
- 18.9%
- Equity multiple
- 2.49×
- Total profit
- $52,183
- Equity at exit
- $106,263
- IRR
- 17.6%
- Equity multiple
- 5.57×
- Total profit
- $160,042
- Equity at exit
- $222,727
Cash invested: $35,000 (down + closing). Projections, not guarantees.
Landlord ↔ Tenant lean methodology
- Overall (STATE)
- 83 Strongly Landlord-Friendly
- State Iowa
- 83 Strongly Landlord-Friendly · R+6
- County
- — inherits STATE
- City
- — inherits STATE
ZIP-level market 50170
- Home prices YoY
- 3.6%
- Active inventory
- 36
- Price-to-rent
- 13.0×
Monthly cashflow live
- Estimated rent
- $803 medium interval (Pro) →
- Mortgage (P&I)
- −$656
- Tax from tax record
- −$82 /mo · $984/yr
- Insurance
- −$52
- HOA
- −$0
- Vacancy / Maint / Mgmt
- −$169
- Net cashflow
- $-155
Break-even live
UW: 25.0% down · 7.5% · 30yr · 1.5% tax · 5.0% vac · 8.0% maint · 8.0% mgmt
Financing live
Cash to close
- Down payment
- $31,250
- Closing costs
- $3,750
- Reserves months
- —
- Total cash needed
- —
Loan-product check · same deal, 3 products live
Conventional
25% down · 7.5% · 30yr
- Down + closing
- —
- Monthly P&I
- —
- Monthly cashflow
- —
- DSCR
- —
- Eligible?
- —
Personal DTI + credit; lowest rate.
DSCR
20% down · 8.5% · 30yr
- Down + closing
- —
- Monthly P&I
- —
- Monthly cashflow
- —
- DSCR
- —
- Eligible?
- —
No personal income docs; deal must DSCR.
Hard money
10% down · 12.0% · 12mo
- Down + closing
- —
- Monthly P&I
- —
- Monthly cashflow
- —
- DSCR
- —
- Eligible?
- —
Short-term bridge; refi at stabilization.
Listing history 17 events
-
2026-06-19days on market $125,000 Active 30 DOM
-
2026-06-18days on market $125,000 Active 29 DOM
-
2026-06-17days on market $125,000 Active 28 DOM
-
2026-06-16days on market $125,000 Active 27 DOM
-
2026-06-15days on market $125,000 Active 26 DOM
-
2026-06-14days on market $125,000 Active 24 DOM
-
2026-06-12days on market $125,000 Active 23 DOM
-
2026-06-09days on market $125,000 Active 20 DOM
-
2026-06-08days on market $125,000 Active 19 DOM
-
2026-06-07days on market $125,000 Active 18 DOM
-
2026-06-07days on market $125,000 Active 17 DOM
-
2026-06-03days on market $125,000 Active 14 DOM
-
2026-06-02days on market $125,000 Active 13 DOM
-
2026-06-01days on market $125,000 Active 12 DOM
-
2026-05-31days on market $125,000 Active 11 DOM
-
2026-05-30days on market $125,000 Active 10 DOM
-
2026-05-20$125,000 Active
ⓘ Source: listings_history table (triggers on properties + properties_extension) + one-shot
backfill from property_details.listing_events for pre-trigger history.
Tax reassessment forecast IA · Partial reset (capped growth)
- Current annual tax
- $984 · $82/mo
- Projected year-2 tax
- $1,473 · $123/mo
- Expected delta
- +$489/yr (+$41/mo · 49.7%)
ⓘ Screening estimate from a state-policy table — verify with the county assessor before closing.
Climate risk First Street
- Flood 1/10 Low FEMA zone X (unshaded) · 0% chance over 30 yrs
- Wildfire 3/10 Moderate
- Heat 3/10 Moderate 7 d/yr ≥105°F today · 15 d/yr by 30 yrs out
- Wind 2/10 Low
- Air quality 1/10 Low 0 unhealthy d/yr today · 0 by 30 yrs out
Nearby sold comps map
Loading sold comps map…
Walkable amenities ~0.75 mi
Loading nearby amenities…
Taxation est. · year 1
- Rental income
- $9,634
- − Mortgage interest
- −$7,002
- − Property taxes
- −$984
- − Insurance
- −$625
- − Repairs & maintenance
- −$771
- − Management
- −$771
- − Depreciation
- −$3,636
- Taxable loss
- −$4,155
- Est. tax savings @ 24.0%
- +$997
- After-tax cash flow
- $-867/yr
For passive investors: Depreciation is non-cash, so a rental often shows a tax loss while cash-flowing — sheltering income. Rental losses are passive: they offset passive income freely, and up to $25,000/yr can offset ordinary (W-2) income if you actively participate and your MAGI is under $100k (phasing out to $0 by $150k); unused losses carry forward. On sale, claimed depreciation is recaptured at up to 25%, and gains may owe capital-gains tax (a 1031 exchange can defer both). Figures are a year-1 estimate at your 24.0% rate — not tax advice; consult a CPA.
Schools (NCES district)
- District
- Pcm Community School District
- NCES district ID
- 1999017
- Math proficiency
- 65% ▼ -6.00%
- Reading proficiency
- 75% ▲ 2.00%
- Median HH income
- $60,380
- Composite
- 60.32/100
- National rank
- #851
- State rank
- #124 of 289 in IA
Livability — Monroe
- Score
- 79/100
- State rank
- #118
- US rank
- #2215
Category grades
Schools grade is shown separately in the Schools card above.
Census & demographics
- Census place
- Monroe, IA
- Population (ZIP)
- 2,914
Population outlook (Jasper County) Hauer SSP2
- Today (2025)
- 36,216 people
- By 2030
- 35,730 · -1.3%
- By 2040
- 34,727 · -4.1%
- By 2050
- 33,802 · -6.7%
- By 2075
- 33,382 · -7.8%
- By 2100
- 32,761 · -9.5%
Race, ethnicity, and origin ACS 2023
- Neighborhood character
- Predominantly White (97%)
- Race & ethnicity
- White 97% Two or more races 1% Asian 1%
- Common ancestry
- Iranian 12% Italian 6% Romanian 3%
- Foreign-born
- 1%
- Languages at home
- 99% English-only · Spanish 1%
Political lean MEDSL · Jasper
- 2024 margin
- Strong R (+27.6) · D 35.4% · R 63.0% · Other 1.5%
- 2008→2024 swing
- -35.1pp toward R · 2008: 7.5pp · 2024: -27.6pp
- All cycles
- 2024: R+27.6 2020: R+21.5 2016: R+18.4 2012: D+7.1 2008: D+7.5
Not yet ingested
- Civics
- —
Market trends
- HPI YoY
- ▲ 9.30%
- Current HPI
- 266.6155
- Rent YoY
- —
- Metro
- —
- State GDP YoY
- ▲ 2.48%
- F500 in state
- 4
Industry mix (Fortune 500 HQ in IA)
| Industry | F500 HQs | Revenue |
|---|---|---|
| Financial Services | 1 | $16B |
|
||
| Retail / Convenience | 1 | $15B |
|
||
Price history
1 event — show timeline
- 2026-05-20 Listed $125,000 DMMLS
Property tax history
+3.3%/yrLatest (2025): $984 · +0.0% YoY. Source: county tax records.
Cash-flow waterfall
monthlySold comps — $/sqft
last 12 mo · ≤1 miLoading sold comps…