 Multi-family
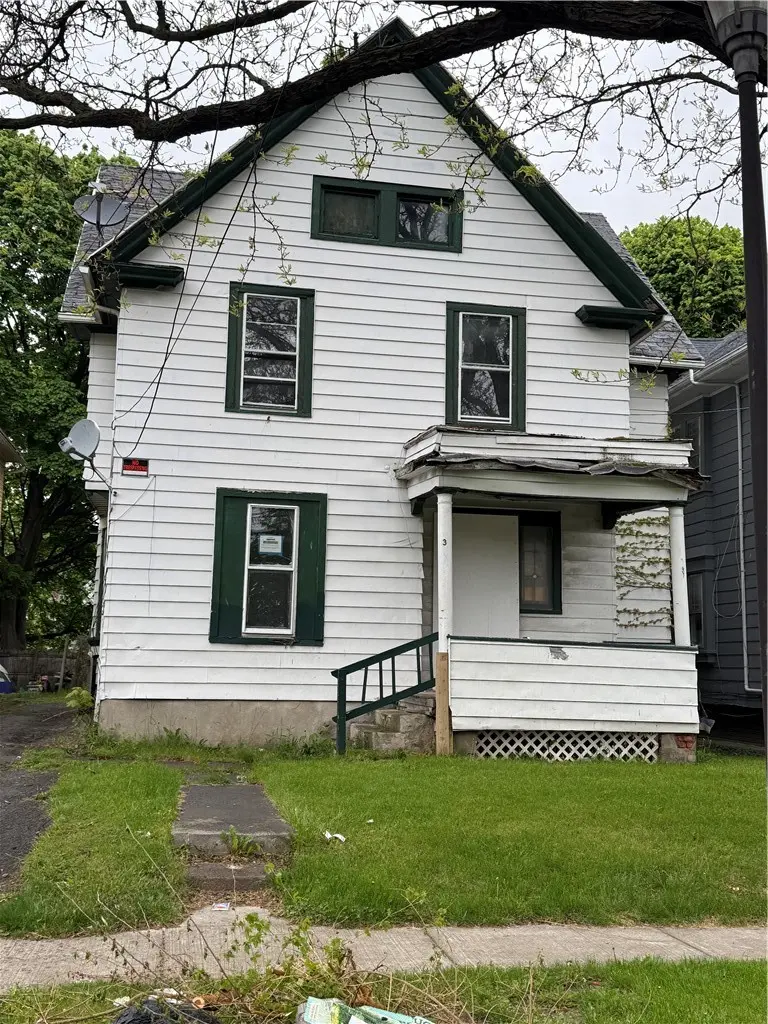
36 Avenue A · Rochester, NY
Flood risk 1/10 · Minimal
- FEMA flood zone
- X (unshaded)
- Chance of flooding over 30 yrs
- 0.0%
- Est. flood insurance / yr
- $473 – $860
Fire risk 1/10 · Minimal
- Est. fire insurance / yr
- $691 – $1,283
Heat risk 2/10 · Minimal
- Hot days now (above 95°F)
- 7 days/yr
- Hot days in 30 yrs
- 15 days/yr
Wind risk 1/10 · Minimal
- Chance of severe wind over 30 yrs
- —
Air-quality risk 2/10 · Minimal
- Unhealthy air days now
- 1 days/yr
- Unhealthy air days in 30 yrs
- 2 days/yr
Risk factors via First Street. Map © Google.
Why this score? — see what drove the B grade
The composite is a weighted blend of 9 inputs, each scored 0–100. Each bar is that input's sub-score; the figure is the points it added to the 100-point composite (weight × sub-score).
- Cash flow +30.0/30.0
- 1% rule +10.0/10.0
- DSCR +10.0/10.0
- ARV discount +7.5/15.0
- Rent growth +4.7/5.0
- Livability +3.8/5.0
- Condition / age +2.5/5.0
- Schools +1.9/10.0
- Appreciation +0.0/10.0
$89,900
🖨 Deal sheet 📄 Offer letter ✓ Due diligence
Multi-family units
County records classify this as Multi-Family (2-4 Unit). Listing-text estimate: 1 unit. estimate disagrees with records
Listing remarks MLS
Freshly painted exterior, refinished hardwood floors, updated plumbing, updated electric, Fully tenanted to long term tenants, Transfer C of O supplied
Key facts
- 4,809 sq ft lot
- Built 1900
- Listed 34 days
Property features AI
Finance
- Other: Two separate gas meters; Two separate electric meters; Two total units in the building
- Financial info: Operating expense details: see remarks; Owner pays: other (see remarks); Rent includes: see remarks
Exterior
- Parking: Paved parking
- Utilities: Public water connected; Sewer connected
- Home design: Two-story multifamily building; Resale property
- Construction: Aluminum siding; Built existing (year built details listed as existing)
- Exterior features: Near public transit; Rectangular residential lot; City street frontage
Interior
- Kitchen: Eat-in kitchens; One unit includes a formal dining room; the other lists a dining area combined with the living room
- Bedrooms: Two 2-bedroom units (each unit has 2 bedrooms)
- Flooring: Hardwood; Varies by room
- Bathrooms: Two full bathrooms (one in each unit)
- Heating & cooling: Gas forced-air heating
- Interior features: Hardwood and varied flooring throughout; Full basement
- Laundry & utility: Gas water heater
Neighborhood map
What this means for you Summary
Snapshot
- This is a 4-bed/2.0-bath multifamily listed at $90k.
Deal economics
- At list price, monthly cash flow is $791 ($9k/yr) — positive.
- The deal already cash-flows at list — no discount required.
- Meets the 1% rule at list price ($2k rent vs $90k).
- Recommended offer: $87k (3.0% below list) — sets the bar for market timing.
- Cap rate 16.9% vs local median 9.3% in Rochester — top-decile yield for the area; either an underpriced asset or a hidden risk that comps aren't pricing in. Stress-test before assuming the spread holds.
Location & tenants
- Location reads 76/100 on livability (#222 in NY, #3,482 nationally) — a middle-class / working-renter tenant base. Strengths: commute A+, cost of living A+, housing A+; Watch: schools D+, crime F, employment F.
- Rochester City School District (urban): math 21% / reading 26% proficiency, ranked #589 of 590 in NY (top 100%) — low school quality limits family demand, transient renter base, plan for 1-2y turnover; 82% free/reduced lunch — lower-income household profile, screen leases tightly.
- Market conditions: Rents rising fast (+8.9%/yr); 114 active listings in the ZIP; 5 comparable units currently listed for rent nearby; rentals at typical pace (median 24d on market — plan ~3-4 weeks tenant-placement turnaround); 40% of comp listings sitting > 30 days — soft ceiling on asking rent; lower-income renter base — watch delinquency; 1,169 units permitted in Monroe County in 2024 (591 in 5+ unit buildings).
- At $1,741/mo this rent would consume 59% of the median local household income ($35k/yr) (locally 2756% of renters already pay >50% of income on rent) — very limited rent-growth headroom before tenants either downsize or default.
Forward outlook
- Local home prices are declining (-3.0%/yr); year-one equity from $622 of loan paydown is wiped out by about $3k of value loss. Plan a longer hold.
- Monroe County population projected to shrink 6% by 2050 — rents likely to lag national; underwrite the cash flow, not the appreciation.
- At projected returns (-3.0% appreciation + 8.0% rent growth), your $25k cash investment doubles in ~3 years — after that, you're playing with house money.
Negotiation context
- It's been on market 34 days — a 3% lower offer ($87k) is reasonable based on typical stale-listing flexibility.
- 2 sale attempts since 11y ago; this cycle's ask has dropped $10k (10%) from the opening price — seller is motivated, your offer sets the floor, not the list.
- Current owner paid $53k; list at $90k implies a 70% gain — meaningful room to come down on a strong offer.
Risks & watch-outs
- Watch-outs: built in 1900 — expect roof / HVAC / electrical / plumbing capex.
Questions for the listing agent
- It's been on market 34 days. Have you received any prior offers? Is the seller open to a 3% concession, seller financing, or rate buy-down credit?
- Built in 1900 — when were the roof, HVAC, electrical panel, plumbing, and water heater last replaced?
- Is there a deadline driving the sale (1031 exchange, divorce, estate, relocation)? That informs how much negotiation room exists.
- Schools are D-rated, which usually means shorter tenancies and higher turnover. Who's the typical renter profile here, and what's been the actual vacancy rate?
- Crime grade is F in this area — have there been break-ins, vandalism, or insurance claims at this property in the last 3 years? What carrier currently insures it and at what premium?
- What's the average days-on-market for RENTAL listings here right now (not sales)? A rising rental-DOM trend means longer vacancies and softer asking-rent achievability than the comps imply.
- What's the recent tenant-quality profile in this submarket — average credit score on applications, eviction rate, late-payment / NSF rate, and stable-employment percentage? A property-management company in the area should have these aggregated.
- How much new apartment / multifamily construction is in the pipeline within 1–3 miles? Heavy new supply (>2% of stock underway) typically softens rents 12–24 months out; light construction supports rent growth.
Investment metrics
- 1% rule
- 1.94% ✓
- Cap rate
- 16.85%
- Cash-on-cash
- 37.71%
- DSCR
- 2.68
- GRM
- 4.3
CMA / ARV
- ARV (median comp)
- $182,925
- List price
- $89,900
- Delta
- -45.39%
- Verdict
- UNDERPRICED
- Comps
- 20 within 1.0 mi
Show comp detail 12 sales within ~0.75 mi
| Address | Dist | Beds/Ba | Sqft | Sold | Price | $/sf | Match |
|---|---|---|---|---|---|---|---|
| 163 Conkey Ave | 0.22mi | 4/2.0 | 2,256 (+3%) | 13mo | $94,000 | $42 | 74 |
| 60 Locust St | 0.64mi | 4/2.0 | 2,250 (+2%) | 3mo | $65,000 | $29 | 64 |
| 1227 N Clinton Ave #1221 | 0.58mi | 4/2.0 | 2,131 (-3%) | 7mo | $126,500 | $59 | 62 |
| 205-207 Ravine Ave | 0.58mi | 4/2.0 | 2,240 (+2%) | 11mo | $190,000 | $85 | 61 |
| 12 Nielson St | 0.20mi | 4/2.0 | 1,908 (-13%) | 12mo | $67,500 | $35 | 58 |
| 1624 St Paul St | 0.56mi | 5/2.0 (+1) | 2,120 (-4%) | 9mo | $160,000 | $75 | 56 |
| 2 Costar St | 0.64mi | 4/2.0 | 2,122 (-3%) | 12mo | $125,000 | $59 | 54 |
| 204 Fulton Ave | 0.41mi | 4/2.0 | 1,938 (-12%) | 12mo | $68,000 | $35 | 51 |
| 395 Remington St | 0.74mi | 4/2.0 | 2,016 (-8%) | 4mo | $85,000 | $42 | 48 |
| 220 Glenwood Ave | 0.59mi | 5/2.0 (+1) | 2,016 (-8%) | 11mo | $170,000 | $84 | 45 |
| 15-17 Wilkins St | 0.70mi | 4/2.0 | 1,920 (-13%) | 6mo | $101,070 | $53 | 41 |
| 32 Laforce St | 0.67mi | 3/2.0 (-1) | 1,980 (-10%) | 9mo | $2,500 | $1 | 40 |
Match score weights: distance 35% · size 25% · config 20% · recency 20%. Top-matched comps best support the ARV.
Projected returns pro-forma
-3.0% appreciation · 8.0% rent growth · sell at horizon
- IRR
- 39.1%
- Equity multiple
- 2.79×
- Total profit
- $45,017
- Equity at exit
- $13,404
- IRR
- 47.9%
- Equity multiple
- 6.80×
- Total profit
- $145,962
- Equity at exit
- $7,773
Cash invested: $25,172 (down + closing). Projections, not guarantees.
Landlord ↔ Tenant lean methodology
- Overall (STATE)
- 15 Strongly Tenant-Friendly
- State New York
- 15 Strongly Tenant-Friendly · D+10
- County
- — inherits STATE
- City
- — inherits STATE
ZIP-level market 14621
- Home prices YoY
- -4.0%
- Rents YoY
- 8.9%
- Active inventory
- 114
- Price-to-rent
- 4.3×
Monthly cashflow live
- Estimated rent
- $1,741 high interval (Pro) →
- Mortgage (P&I)
- −$471
- Tax from tax record
- −$75 /mo · $905/yr
- Insurance
- −$37
- HOA
- −$0
- Vacancy / Maint / Mgmt
- −$366
- Net cashflow
- $791
Break-even live
UW: 25.0% down · 7.5% · 30yr · 1.5% tax · 5.0% vac · 8.0% maint · 8.0% mgmt
Financing live
Cash to close
- Down payment
- $22,475
- Closing costs
- $2,697
- Reserves months
- —
- Total cash needed
- —
Loan-product check · same deal, 3 products live
Conventional
25% down · 7.5% · 30yr
- Down + closing
- —
- Monthly P&I
- —
- Monthly cashflow
- —
- DSCR
- —
- Eligible?
- —
Personal DTI + credit; lowest rate.
DSCR
20% down · 8.5% · 30yr
- Down + closing
- —
- Monthly P&I
- —
- Monthly cashflow
- —
- DSCR
- —
- Eligible?
- —
No personal income docs; deal must DSCR.
Hard money
10% down · 12.0% · 12mo
- Down + closing
- —
- Monthly P&I
- —
- Monthly cashflow
- —
- DSCR
- —
- Eligible?
- —
Short-term bridge; refi at stabilization.
Rent comps 5 comps
| Address | Beds | Baths | Sqft | Rent | $/sqft | DOM | Units | Dist |
|---|---|---|---|---|---|---|---|---|
| 28-30 Carthage Dr Unit 28 Rochester, NY | 3.0 | 1.0 | 1415 | $1,600 | $1.13 | 23d | 1 | 0.13mi |
| 98 Pierpont St Rochester, NY | 3.0 | 1.0 | 1973 | $1,295 | $0.66 | 44d | 1 | 0.68mi |
| 327 Glenwood Ave Rochester, NY | 3.0 | 1.0 | 2012 | $1,690 | $0.84 | 3d | 1 | 0.76mi |
| 235 Flower City Park Rochester, NY | 3.0 | 1.0 | 2000 | $1,360 | $0.68 | 44d | 1 | 1.06mi |
| 649 Jay St Rochester, NY | 5.0 | 2.0 | 2144 | $2,000 | $0.93 | 3d | 1 | 1.47mi |
Listing history 22 events
-
2026-06-18days on market $89,900 Active 34 DOM
-
2026-06-17price $89,900 Active 33 DOM
-
2026-06-17days on market $99,900 Active 33 DOM
-
2026-06-16days on market $99,900 Active 32 DOM
-
2026-06-15days on market $99,900 Active 31 DOM
-
2026-06-13days on market $99,900 Active 29 DOM
-
2026-06-13days on market $99,900 Active 28 DOM
-
2026-06-10days on market $99,900 Active 26 DOM
-
2026-06-09days on market $99,900 Active 25 DOM
-
2026-06-09days on market $99,900 Active 24 DOM
-
2026-06-07days on market $99,900 Active 23 DOM
-
2026-06-05days on market $99,900 Active 20 DOM
-
2026-06-03days on market $99,900 Active 19 DOM
-
2026-06-03days on market $99,900 Active 18 DOM
-
2026-06-01days on market $99,900 Active 17 DOM
-
2026-05-31days on market $99,900 Active 16 DOM
-
2026-05-15$99,900 Active 127-char remark
-
2015-12-17soldstatus $53,000 Closed Sale or Rented 151-char remark
Show marketing remark (151 chars)
Freshly painted exterior, refinished hardwood floors, updated plumbing, updated electric, Fully tenanted to long term tenants, Transfer C of O supplied
-
2015-07-28status Pending Sale 151-char remark
Show marketing remark (151 chars)
Freshly painted exterior, refinished hardwood floors, updated plumbing, updated electric, Fully tenanted to long term tenants, Transfer C of O supplied
-
2015-07-25$59,900 Active 151-char remark
Show marketing remark (151 chars)
Freshly painted exterior, refinished hardwood floors, updated plumbing, updated electric, Fully tenanted to long term tenants, Transfer C of O supplied
-
2014-06-26soldstatus $710,000
-
2007-08-06soldstatus $29,900
ⓘ Source: listings_history table (triggers on properties + properties_extension) + one-shot
backfill from property_details.listing_events for pre-trigger history.
Tax reassessment forecast NY · Partial reset (capped growth)
- Current annual tax
- $905 · $75/mo
- Projected year-2 tax
- $1,212 · $101/mo
- Expected delta
- +$307/yr (+$26/mo · 34.0%)
ⓘ Screening estimate from a state-policy table — verify with the county assessor before closing.
Climate risk First Street
- Flood 1/10 Low FEMA zone X (unshaded) · 0% chance over 30 yrs
- Wildfire 1/10 Low
- Heat 2/10 Low 7 d/yr ≥95°F today · 15 d/yr by 30 yrs out
- Wind 1/10 Low
- Air quality 2/10 Low 1 unhealthy d/yr today · 2 by 30 yrs out
Nearby sold comps map
Loading sold comps map…
Walkable amenities ~0.75 mi
Loading nearby amenities…
Taxation est. · year 1
- Rental income
- $20,891
- − Mortgage interest
- −$5,036
- − Property taxes
- −$905
- − Insurance
- −$450
- − Repairs & maintenance
- −$1,671
- − Management
- −$1,671
- − Depreciation
- −$2,615
- Taxable income
- $8,543
- Est. tax owed @ 24.0%
- −$2,050
- After-tax cash flow
- $7,442/yr
For passive investors: Depreciation is non-cash, so a rental often shows a tax loss while cash-flowing — sheltering income. Rental losses are passive: they offset passive income freely, and up to $25,000/yr can offset ordinary (W-2) income if you actively participate and your MAGI is under $100k (phasing out to $0 by $150k); unused losses carry forward. On sale, claimed depreciation is recaptured at up to 25%, and gains may owe capital-gains tax (a 1031 exchange can defer both). Figures are a year-1 estimate at your 24.0% rate — not tax advice; consult a CPA.
Schools (NCES district)
- District
- Rochester City School District
- NCES district ID
- 3624750
- Math proficiency
- 21% ▬ 0.00%
- Reading proficiency
- 26% ▲ 4.00%
- Median HH income
- $30,923
- Composite
- 18.98/100
- National rank
- #8850
- State rank
- #589 of 590 in NY
Livability — Rochester
- Score
- 76/100
- State rank
- #222
- US rank
- #3482
Category grades
Schools grade is shown separately in the Schools card above.
Census & demographics
- Census place
- Rochester, NY
- County
- Monroe County · 674,131 people
- City population
- 432,803
- Metro
- Rochester, NY
- Population (ZIP)
- 32,381
- Household income
- $35,383
- Rent vs Own
- Severe rent burden
- 2756.0
Population outlook (Monroe County) Hauer SSP2
- Today (2025)
- 759,460 people
- By 2030
- 757,154 · -0.3%
- By 2040
- 740,644 · -2.5%
- By 2050
- 714,443 · -5.9%
- By 2075
- 645,883 · -15.0%
- By 2100
- 547,084 · -28.0%
Race, ethnicity, and origin ACS 2023
- Neighborhood character
- Diverse neighborhood (Simpson 0.66)
- Race & ethnicity
- Hispanic / Latino 40% Black 40% White 14% Two or more races 12% Asian 1%
- Hispanic origin (detail)
- Mexican 1% Puerto Rican 32% Dominican 3%
- Common ancestry
- Romanian 1% Lithuanian 1% Serbian 1%
- Foreign-born
- 8% · Canada, Jamaica
- Languages at home
- 65% English-only · Spanish 30% Other Asian/Pacific 2% French/Haitian/Cajun 1%
Political lean MEDSL · Monroe
- 2024 margin
- D (+19.1) · D 59.5% · R 40.5%
- 2008→2024 swing
- +1.4pp toward D · 2008: 17.7pp · 2024: 19.1pp
- All cycles
- 2024: D+19.1 2020: D+21.0 2016: D+14.1 2012: D+17.4 2008: D+17.7
Not yet ingested
- Civics
- —
Market trends
- HPI YoY
- ▼ -10.66%
- Current HPI
- 254.1805
- Rent YoY
- ▲ 8.88%
- Metro
- Rochester, NY
- State GDP YoY
- ▲ 2.60%
- F500 in state
- 92
Industry mix (Fortune 500 HQ in NY)
| Industry | F500 HQs | Revenue |
|---|---|---|
| Financial Services | 10 | $950B |
|
||
| Consumer Goods | 9 | $162B |
|
||
| Insurance | 4 | $225B |
|
||
| Telecommunications | 2 | $144B |
|
||
| Pharmaceuticals | 2 | $112B |
|
||
| Media / Entertainment | 2 | $69B |
|
||
Price history
+200.7% since first listed7 events — show timeline
- 2026-06-17 Price Changed $89,900 UNYREIS
- 2026-05-15 Listed $99,900 UNYREIS
- 2015-12-17 Sold (MLS) $53,000 UNYREIS
- 2015-07-28 Pending — UNYREIS
- 2015-07-25 Listed $59,900 UNYREIS
- 2014-06-26 Sold (Public Records) $710,000 Public Records
- 2007-08-06 Sold (Public Records) $29,900 Public Records
Property tax history
+2.1%/yrLatest (2025): $905 · -26.1% YoY. Source: county tax records.
Cash-flow waterfall
monthlySold comps — $/sqft
last 12 mo · ≤1 miLoading sold comps…