 🏷️ Likely Rental
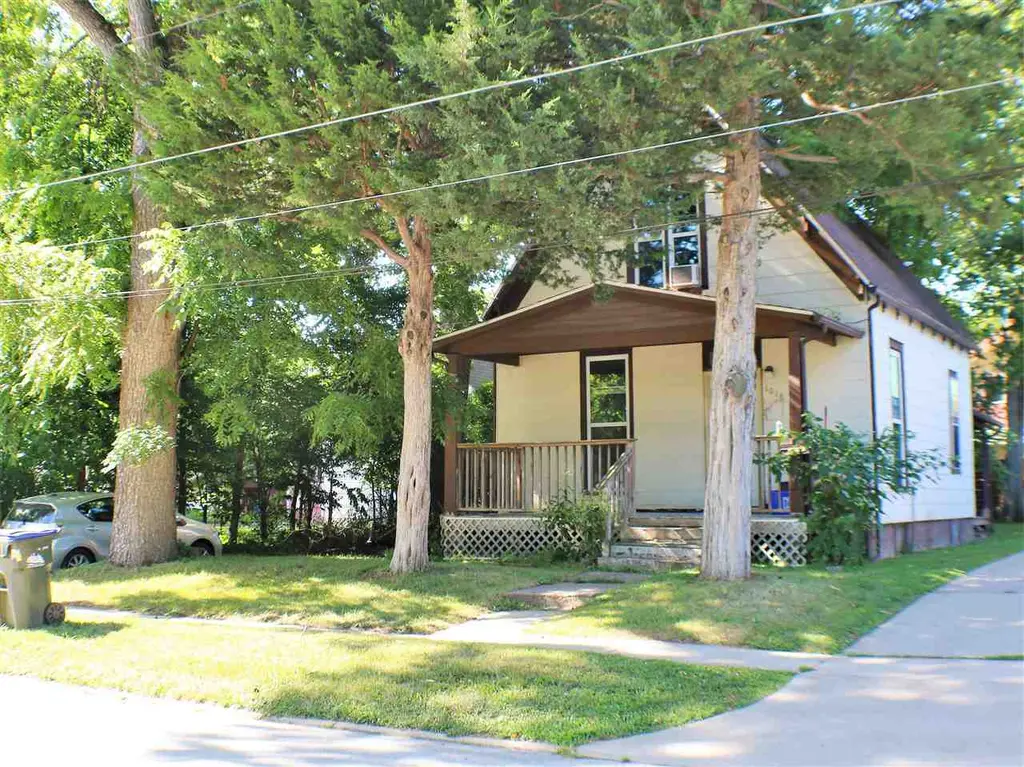
1016 Rochester Ave · Iowa City, IA
Flood risk 1/10 · Minimal
- FEMA flood zone
- X (unshaded)
- Chance of flooding over 30 yrs
- 0.0%
- Est. flood insurance / yr
- $473 – $860
Fire risk 1/10 · Minimal
- Est. fire insurance / yr
- $902 – $1,676
Heat risk 3/10 · Minor
- Hot days now (above 105°F)
- 7 days/yr
- Hot days in 30 yrs
- 16 days/yr
Wind risk 2/10 · Minimal
- Chance of severe wind over 30 yrs
- —
Air-quality risk 2/10 · Minimal
- Unhealthy air days now
- 1 days/yr
- Unhealthy air days in 30 yrs
- 2 days/yr
Risk factors via First Street. Map © Google.
Why this score? — see what drove the C grade
The composite is a weighted blend of 9 inputs, each scored 0–100. Each bar is that input's sub-score; the figure is the points it added to the 100-point composite (weight × sub-score).
- Cash flow +15.9/30.0
- ARV discount +15.0/15.0
- Schools +5.7/10.0
- DSCR +4.9/10.0
- 1% rule +4.4/10.0
- Livability +4.3/5.0
- Rent growth +4.1/5.0
- Condition / age +2.5/5.0
- Appreciation +0.0/10.0
$189,000
🖨 Deal sheet 📄 Offer letter ✓ Due diligence
Listing remarks
Well located rental unit on Rochester Ave. Rents for $1475 but increases to $1600 in August 2026. Leased until Aug 2027. Tenant rights apply.
Key facts
- 3,920 sq ft lot
- 2 parking spots
- Built 1900
Property features AI
Finance
- HOA & community: Annual association fee
Exterior
- Parking: Off-street parking for 2 vehicles
- Utilities: Public water; Public sewer
- Home design: Residential income/investment property; 2 stories
- Construction: Wood siding and frame construction
- Exterior features: Front porch; Sidewalks; Street lights
Interior
- Kitchen: Refrigerator
- Flooring: Carpet; Vinyl
- Bathrooms: 1 full bathroom
- Heating & cooling: Natural gas heating with forced air; Wall/window cooling units
- Interior features: Other
- Laundry & utility: Washer; Dryer; Laundry located on lower level; Full, unfinished basement
Neighborhood map
What this means for you Summary
Snapshot
- This is a 3-bed/2.0-bath single-family listed at $189k.
Deal economics
- At list price, monthly cash flow is $89 ($1k/yr) — positive.
- The deal already cash-flows at list — no discount required.
- To meet the 1% rule (rent ≥ 1% of price), the offer needs to be $178k (5.8% below list).
- Recommended offer: $178k (5.8% below list) — sets the bar for 1% rule.
- Cap rate 6.9% vs local median 2.7% in Iowa City — top-decile yield for the area; either an underpriced asset or a hidden risk that comps aren't pricing in. Stress-test before assuming the spread holds.
Location & tenants
- Location reads 86/100 on livability (#13 in IA, #450 nationally) — a professional / high-income tenant draw. Strengths: amenities A+, commute A+, cost of living A+.
- Iowa City Community School District (urban): math 65% / reading 70% proficiency, ranked #174 of 289 in IA (top 60%) — acceptable for families but not a draw, mixed tenant base, ~2y average lease.
- Zoned schools: Horace Mann Elementary School (math 57% / reading 67%, grade B, #363 of 616 statewide, top 62%, 213 students, 35% FRL); Southeast Junior High School (math 64% / reading 68%, grade A-, #152 of 246 statewide, top 62%, 812 students, 50% FRL); Iowa City High School (math 62% / reading 73%, grade B, #186 of 336 statewide, top 57%, 1,599 students, 40% FRL).
- Market conditions: Rents rising fast (+6.3%/yr); 260 active listings in the ZIP; 15 comparable units currently listed for rent nearby; rentals lingering (median 44d on market — plan ~5-8 weeks vacancy on turnover, expect pricing pressure); 87% of comp listings sitting > 30 days — soft ceiling on asking rent; 714 units permitted in Johnson County in 2024 (158 in 5+ unit buildings).
- This rent runs 40% of the median local income ($53k/yr) — at the standard rent-burdened threshold; future hikes will face affordability resistance.
Forward outlook
- Local home prices are declining (-3.0%/yr); year-one equity from $1k of loan paydown is wiped out by about $6k of value loss. Plan a longer hold.
- Johnson County population projected at +60% by 2050 — long-run rental-demand tailwind backs the buy-and-hold thesis.
Negotiation context
- It's been on market 29 days — a 2% lower offer ($186k) is reasonable based on typical stale-listing flexibility.
- 4 sale attempts since 4y ago with the ask held roughly flat each time — persistent listings suggest the price (not the market) is what's stuck; bring a comps-based counter.
- Current owner paid $125k; list at $189k implies a 51% gain — meaningful room to come down on a strong offer.
Risks & watch-outs
- Watch-outs: built in 1900 — expect roof / HVAC / electrical / plumbing capex.
Questions for the listing agent
- Built in 1900 — when were the roof, HVAC, electrical panel, plumbing, and water heater last replaced?
- Is there a deadline driving the sale (1031 exchange, divorce, estate, relocation)? That informs how much negotiation room exists.
- Schools are A-rated — typically a magnet for longer-tenancy family renters. What's the average tenant stay here, and is there a school-zone premium baked into asking?
- What's the average days-on-market for RENTAL listings here right now (not sales)? A rising rental-DOM trend means longer vacancies and softer asking-rent achievability than the comps imply.
- What's the recent tenant-quality profile in this submarket — average credit score on applications, eviction rate, late-payment / NSF rate, and stable-employment percentage? A property-management company in the area should have these aggregated.
- How much new for-sale + rental construction is in the pipeline within 1–3 miles? Heavy new supply typically softens prices + rents 12–24 months out; constrained supply supports both.
Investment metrics
- 1% rule
- 0.94% ✗
- Cap rate
- 6.86%
- Cash-on-cash
- 2.01%
- DSCR
- 1.09
- GRM
- 8.9
CMA / ARV
- ARV (on-the-fly)
- $246,402
- Comps found
- 12
Show comp detail 12 sales within ~0.75 mi
| Address | Dist | Beds/Ba | Sqft | Sold | Price | $/sf | Match |
|---|---|---|---|---|---|---|---|
| 1116 Rochester Ave | 0.06mi | 2/1.5 (-1) | 936 (-8%) | 5mo | $250,000 | $267 | 74 |
| 804 E Davenport St | 0.21mi | 3/2.0 | 1,100 (+8%) | 14mo | $310,000 | $282 | 64 |
| 912 E Bloomington St | 0.10mi | 3/1.0 | 864 (-15%) | 8mo | $210,000 | $243 | 60 |
| 828 Church St | 0.31mi | 3/1.0 | 1,120 (+10%) | 5mo | $217,500 | $194 | 60 |
| 941 E Davenport St | 0.10mi | 2/1.0 (-1) | 1,095 (+8%) | 16mo | $187,500 | $171 | 60 |
| 906 E Davenport St | 0.16mi | 3/1.0 | 1,162 (+15%) | 6mo | $185,000 | $159 | 60 |
| 621 Reno St | 0.32mi | 2/1.0 (-1) | 948 (-6%) | 11mo | $182,000 | $192 | 56 |
| 311 Brown St | 0.67mi | 3/1.5 | 1,118 (+10%) | 2mo | $325,000 | $291 | 48 |
| 332 N Johnson St | 0.34mi | 2/1.0 (-1) | 1,092 (+8%) | 18mo | $221,000 | $202 | 48 |
| 30 Montrose Ave | 0.43mi | 3/1.5 | 1,152 (+14%) | 12mo | $285,000 | $247 | 45 |
| 323 Brown St | 0.66mi | 2/1.0 (-1) | 942 (-7%) | 8mo | $295,000 | $313 | 42 |
| 515 E Ronalds St | 0.50mi | 2/1.0 (-1) | 1,160 (+14%) | 18mo | $223,500 | $193 | 29 |
Match score weights: distance 35% · size 25% · config 20% · recency 20%. Top-matched comps best support the ARV.
Projected returns pro-forma
-3.0% appreciation · 6.32% rent growth · sell at horizon
- IRR
- -9.4%
- Equity multiple
- 0.64×
- Total profit
- $-18,796
- Equity at exit
- $28,181
- IRR
- 4.1%
- Equity multiple
- 1.34×
- Total profit
- $18,037
- Equity at exit
- $16,341
Cash invested: $52,920 (down + closing). Projections, not guarantees.
Landlord ↔ Tenant lean methodology
- Overall (STATE)
- 83 Strongly Landlord-Friendly
- State Iowa
- 83 Strongly Landlord-Friendly · R+6
- County
- — inherits STATE
- City
- — inherits STATE
ZIP-level market 52240
- Rents YoY
- 6.3%
- Active inventory
- 260
- Price-to-rent
- 8.9×
Monthly cashflow live
- Estimated rent
- $1,780 high interval (Pro) →
- Mortgage (P&I)
- −$991
- Tax from tax record
- −$247 /mo · $2,966/yr
- Insurance
- −$79
- HOA
- −$0
- Vacancy / Maint / Mgmt
- −$374
- Net cashflow
- $89
Break-even live
UW: 25.0% down · 7.5% · 30yr · 1.5% tax · 5.0% vac · 8.0% maint · 8.0% mgmt
Financing live
Cash to close
- Down payment
- $47,250
- Closing costs
- $5,670
- Reserves months
- —
- Total cash needed
- —
Loan-product check · same deal, 3 products live
Conventional
25% down · 7.5% · 30yr
- Down + closing
- —
- Monthly P&I
- —
- Monthly cashflow
- —
- DSCR
- —
- Eligible?
- —
Personal DTI + credit; lowest rate.
DSCR
20% down · 8.5% · 30yr
- Down + closing
- —
- Monthly P&I
- —
- Monthly cashflow
- —
- DSCR
- —
- Eligible?
- —
No personal income docs; deal must DSCR.
Hard money
10% down · 12.0% · 12mo
- Down + closing
- —
- Monthly P&I
- —
- Monthly cashflow
- —
- DSCR
- —
- Eligible?
- —
Short-term bridge; refi at stabilization.
Rent comps 15 comps
| Address | Beds | Baths | Sqft | Rent | $/sqft | DOM | Units | Dist |
|---|---|---|---|---|---|---|---|---|
| 1154 Hotz Ave Iowa City, IA | 2.0 | 2.5 | 1482 | $2,450 | $1.65 | 43d | 1 | 0.20mi |
| 12 N Dodge St Iowa City, IA | 4.0 | 2.0 | 1120 | $2,695 | $2.41 | 43d | 1 | 0.28mi |
| 321 N Johnson St Unit 321-02 Iowa City, IA | 2.0 | 1.0 | 945 | $1,050 | $1.11 | 43d | 1 | 0.35mi |
| 520 Church St Iowa City, IA | 3.0 | 1.5 | 1359 | $2,250 | $1.66 | 43d | 1 | 0.45mi |
| 909 N Governor St Iowa City, IA | 4.0 | 1.0 | 1484 | $2,400 | $1.62 | 43d | 1 | 0.52mi |
| 902 N Dodge St Iowa City, IA | 2.0 | 1.0 | 900 | $1,150 | $1.28 | 43d | 1 | 0.55mi |
| 906 N Dodge St Iowa City, IA | 2.0 | 1.0 | 900 | $1,150 | $1.28 | 43d | 1 | 0.57mi |
| 426 S Johnson St Iowa City, IA | 3.0 | 2.0 | 1000 | $1,350 | $1.35 | 43d | 1 | 0.62mi |
| 413 S Johnson St Iowa City, IA | 2.0 | 1.0 | 700 | $1,200 | $1.71 | 20d | 1 | 0.64mi |
| 704 Bowery St Iowa City, IA | 3.0 | 1.5 | 1400 | $1,500 | $1.07 | 43d | 1 | 0.71mi |
| 316 S Madison St Iowa City, IA | 1.0–2.0 | 1.0–2.0 | 673 | $2,300 | $3.42 | 43d | 1 | 0.95mi |
| 629 S Riverside Dr Iowa City, IA | 2.0–3.0 | 2.0 | 1040 | $2,170 | $2.09 | 20d | 1 | 1.32mi |
| 629 S Riverside Dr Iowa City, IA | 2.0–3.0 | 2.0 | 1010 | $2,170 | $2.15 | 43d | 2 | 1.32mi |
| 49 Arbor Hill Cir #23 Iowa City, IA | 2.0 | 2.0 | 1128 | $1,215 | $1.08 | 43d | 1 | 1.40mi |
| 215 Melrose Ct Iowa City, IA | 3.0 | 1.0 | 1400 | $2,400 | $1.71 | 43d | 1 | 1.44mi |
Listing history 26 events
-
2026-06-19days on market $189,000 Active 29 DOM
-
2026-06-18days on market $189,000 Active 28 DOM
-
2026-06-17days on market $189,000 Active 27 DOM
-
2026-06-16days on market $189,000 Active 26 DOM
-
2026-06-15days on market $189,000 Active 25 DOM
-
2026-06-14days on market $189,000 Active 23 DOM
-
2026-06-13days on market $189,000 Active 22 DOM
-
2026-06-10days on market $189,000 Active 20 DOM
-
2026-06-09days on market $189,000 Active 19 DOM
-
2026-06-08days on market $189,000 Active 18 DOM
-
2026-06-07days on market $189,000 Active 17 DOM
-
2026-06-05days on market $189,000 Active 14 DOM
-
2026-06-03days on market $189,000 Active 13 DOM
-
2026-06-02days on market $189,000 Active 12 DOM
-
2026-06-01days on market $189,000 Active 11 DOM
-
2026-05-31days on market $189,000 Active 10 DOM
-
2026-05-30days on market $189,000 Active 9 DOM
-
2026-05-21$189,000 Active
-
2026-01-01historical $1,600
-
2025-11-05$189,000 Active
-
2025-11-01price $1,600
-
2025-10-30$1,550
-
2022-08-29historical Active Under Contract
-
2022-08-05price $159,900
-
2022-07-01$165,000 Active
-
2012-11-30soldstatus $125,000
ⓘ Source: listings_history table (triggers on properties + properties_extension) + one-shot
backfill from property_details.listing_events for pre-trigger history.
Tax reassessment forecast IA · Partial reset (capped growth)
- Current annual tax
- $2,966 · $247/mo
- Projected year-2 tax
- $2,967 · $247/mo
- Expected delta
- +$1/yr ($0/mo · 0.0%)
ⓘ Screening estimate from a state-policy table — verify with the county assessor before closing.
Climate risk First Street
- Flood 1/10 Low FEMA zone X (unshaded) · 0% chance over 30 yrs
- Wildfire 1/10 Low
- Heat 3/10 Moderate 7 d/yr ≥105°F today · 16 d/yr by 30 yrs out
- Wind 2/10 Low
- Air quality 2/10 Low 1 unhealthy d/yr today · 2 by 30 yrs out
Nearby sold comps map
Loading sold comps map…
Walkable amenities ~0.75 mi
Loading nearby amenities…
Taxation est. · year 1
- Rental income
- $21,354
- − Mortgage interest
- −$10,587
- − Property taxes
- −$2,966
- − Insurance
- −$945
- − Repairs & maintenance
- −$1,708
- − Management
- −$1,708
- − Depreciation
- −$5,498
- Taxable loss
- −$2,058
- Est. tax savings @ 24.0%
- +$494
- After-tax cash flow
- $1,559/yr
For passive investors: Depreciation is non-cash, so a rental often shows a tax loss while cash-flowing — sheltering income. Rental losses are passive: they offset passive income freely, and up to $25,000/yr can offset ordinary (W-2) income if you actively participate and your MAGI is under $100k (phasing out to $0 by $150k); unused losses carry forward. On sale, claimed depreciation is recaptured at up to 25%, and gains may owe capital-gains tax (a 1031 exchange can defer both). Figures are a year-1 estimate at your 24.0% rate — not tax advice; consult a CPA.
Schools (NCES district)
- District
- Iowa City Community School District
- NCES district ID
- 1914700
- Math proficiency
- 65% ▼ -6.00%
- Reading proficiency
- 70% ▲ 2.00%
- Median HH income
- $50,229
- Composite
- 57.3/100
- National rank
- #1088
- State rank
- #174 of 289 in IA
Livability — Iowa City
- Score
- 86/100
- State rank
- #13
- US rank
- #450
Category grades
Schools grade is shown separately in the Schools card above.
Census & demographics
- Census place
- Iowa City, IA
- County
- Johnson County · 132,710 people
- City population
- 80,235
- Metro
- Iowa City, IA
- Population (ZIP)
- 35,074
- Household income
- $52,960
- Rent vs Own
- Severe rent burden
- 2852.0
Population outlook (Johnson County) Hauer SSP2
- Today (2025)
- 180,405 people
- By 2030
- 200,014 · +10.9%
- By 2040
- 241,428 · +33.8%
- By 2050
- 288,144 · +59.7%
- By 2075
- 420,009 · +132.8%
- By 2100
- 546,596 · +203.0%
Race, ethnicity, and origin ACS 2023
- Neighborhood character
- Predominantly White (71%)
- Race & ethnicity
- White 71% Hispanic / Latino 11% Black 9% Two or more races 8% Asian 5%
- Hispanic origin (detail)
- Mexican 6% Puerto Rican 1%
- Common ancestry
- Portuguese 3% Romanian 2% Iranian 2%
- Foreign-born
- 12% · Canada, Vietnam, China
- Languages at home
- 81% English-only · Spanish 8% French/Haitian/Cajun 2% Arabic 2%
Political lean MEDSL · Johnson
- 2024 margin
- Solid D (+38.1) · D 68.4% · R 30.3% · Other 1.3%
- 2008→2024 swing
- -3.4pp toward R · 2008: 41.5pp · 2024: 38.1pp
- All cycles
- 2024: D+38.1 2020: D+43.2 2016: D+38.3 2012: D+35.4 2008: D+41.5
Not yet ingested
- Civics
- —
Market trends
- HPI YoY
- ▼ -202.53%
- Current HPI
- 170.7491
- Rent YoY
- ▲ 6.32%
- Metro
- Iowa City, IA
- State GDP YoY
- ▲ 2.48%
- F500 in state
- 4
Industry mix (Fortune 500 HQ in IA)
| Industry | F500 HQs | Revenue |
|---|---|---|
| Financial Services | 1 | $16B |
|
||
| Retail / Convenience | 1 | $15B |
|
||
Price history
+51.2% since first listed9 events — show timeline
- 2026-05-21 Listed $189,000 ICAARMLS
- 2026-01-01 Rental Removed $1,600 SHOWMOJO
- 2025-11-05 Listed $189,000 ICAARMLS
- 2025-11-01 Price Changed $1,600 SHOWMOJO
- 2025-10-30 Listed for Rent $1,550 SHOWMOJO
- 2022-08-29 Contingent — ICAARMLS
- 2022-08-05 Price Changed $159,900 ICAARMLS
- 2022-07-01 Listed $165,000 ICAARMLS
- 2012-11-30 Sold (Public Records) $125,000 Public Records
Property tax history
+2.9%/yrLatest (2025): $2,966 · +1.3% YoY. Source: county tax records.
Cash-flow waterfall
monthlySold comps — $/sqft
last 12 mo · ≤1 miLoading sold comps…