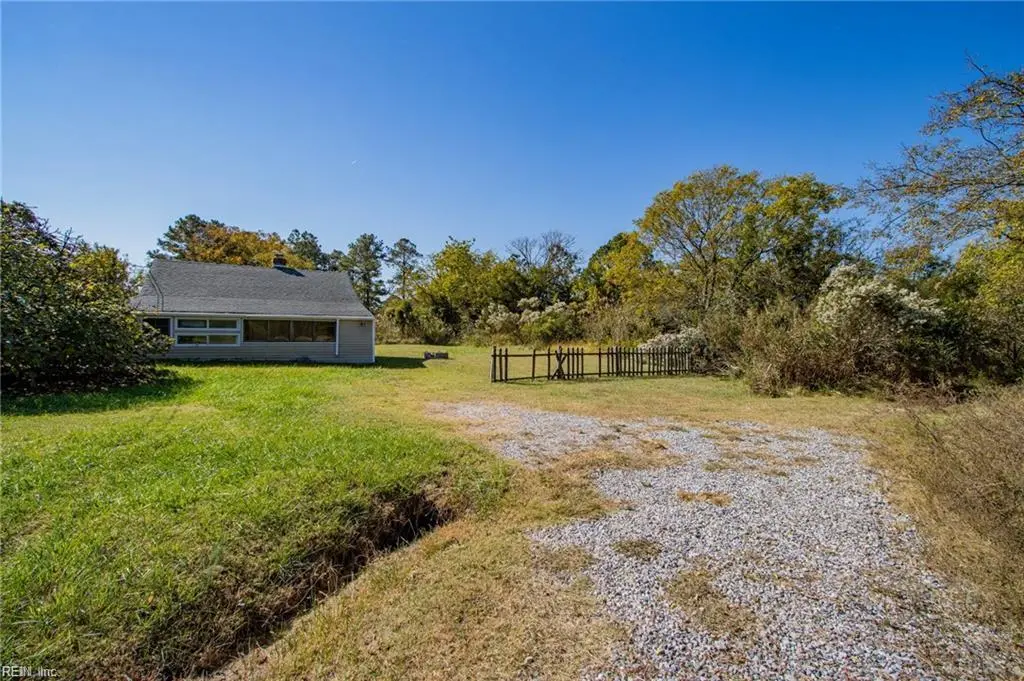
21 Constant Rd · Hampton, VA
Flood risk 10/10 · Severe
- FEMA flood zone
- AE
- Chance of flooding over 30 yrs
- 0.99%
- Est. flood insurance / yr
- $1,737 – $8,500
Fire risk 2/10 · Minimal
- Est. fire insurance / yr
- $666 – $1,236
Heat risk 9/10 · Severe
- Hot days now (above 105°F)
- 7 days/yr
- Hot days in 30 yrs
- 17 days/yr
Wind risk 8/10 · Major
- Chance of severe wind over 30 yrs
- 80.0%
Air-quality risk 2/10 · Minimal
- Unhealthy air days now
- 1 days/yr
- Unhealthy air days in 30 yrs
- 2 days/yr
Risk factors via First Street. Map © Google.
Why this score? — see what drove the B+ grade
The composite is a weighted blend of 9 inputs, each scored 0–100. Each bar is that input's sub-score; the figure is the points it added to the 100-point composite (weight × sub-score).
- Cash flow +28.9/30.0
- ARV discount +15.0/15.0
- DSCR +10.0/10.0
- 1% rule +7.8/10.0
- Schools +5.5/10.0
- Livability +3.8/5.0
- Rent growth +2.5/5.0
- Condition / age +2.5/5.0
- Appreciation +0.0/10.0
$150,000
🖨 Deal sheet 📄 Offer letter ✓ Due diligence
Listing remarks MLS
This hidden gem offers endless potential as a peaceful retreat or income-generating getaway. Steps from scenic trails and moments to the water, it’s the ideal blend of nature and lifestyle. Bring your buyers, investors, or those dreaming of a second home near the coast. It’s a rare opportunity to own a slice of tranquility with room to create something truly special.
Key facts
- Built 1947
- Listed 273 days
Neighborhood map
What this means for you Summary
Snapshot
- This is a 2-bed/1.0-bath single-family listed at $150k.
Deal economics
- At list price, monthly cash flow is $80 ($965/yr) — positive.
- The deal already cash-flows at list — no discount required.
- Meets the 1% rule at list price ($2k rent vs $150k).
- Recommended offer: $132k (12.0% below list) — sets the bar for market timing.
- Cap rate 10.3% vs local median 4.5% in Hampton — top-decile yield for the area; either an underpriced asset or a hidden risk that comps aren't pricing in. Stress-test before assuming the spread holds.
Location & tenants
- Location reads 75/100 on livability (#133 in VA, #4,302 nationally) — a middle-class / working-renter tenant base. Strengths: housing A+, health & safety A+, cost of living A; Watch: crime C-, amenities D+, commute F.
- Hampton City Public School District (urban): math 60% / reading 70% proficiency, ranked #40 of 131 in VA (top 30%) — acceptable for families but not a draw, mixed tenant base, ~2y average lease.
- Market conditions: 97 active listings in the ZIP; solid renter incomes; 68 units permitted in Hampton city in 2024 (0 in 5+ unit buildings).
Forward outlook
- Local home prices are declining (-3.0%/yr); year-one equity from $1k of loan paydown is wiped out by about $4k of value loss. Plan a longer hold.
- Hampton County population projected at -13% by 2050 — secular population decline; favor cash flow + early exit over multi-decade hold.
Negotiation context
- It's been on market 273 days — a 12% lower offer ($132k) is reasonable based on typical stale-listing flexibility.
- 8 sale attempts since 11y ago with the ask held roughly flat each time — persistent listings suggest the price (not the market) is what's stuck; bring a comps-based counter.
Risks & watch-outs
- Watch-outs: flood insurance adds $427/mo; built in 1947 — expect roof / HVAC / electrical / plumbing capex.
- Climate carrying-cost: in FEMA flood zone AE (mandatory federal flood insurance); severe wind risk, 80% chance of damaging wind over 30y; extreme-heat days projected 7→17/yr by 2055 (HVAC capex compounding) — expect insurance premiums to compound above CPI over the hold.
Questions for the listing agent
- It's been on market 273 days. Have you received any prior offers? Is the seller open to a 12% concession, seller financing, or rate buy-down credit?
- Built in 1947 — when were the roof, HVAC, electrical panel, plumbing, and water heater last replaced?
- What's the actual annual flood-insurance premium (NFIP or private), and is the property in a SFHA with mandatory coverage?
- Why hasn't it sold? Are there any deal-killer items the seller is aware of (foundation, flood, title, zoning, code violations)?
- Is there a deadline driving the sale (1031 exchange, divorce, estate, relocation)? That informs how much negotiation room exists.
- Schools are B-rated — typically a magnet for longer-tenancy family renters. What's the average tenant stay here, and is there a school-zone premium baked into asking?
- What's the average days-on-market for RENTAL listings here right now (not sales)? A rising rental-DOM trend means longer vacancies and softer asking-rent achievability than the comps imply.
- What's the recent tenant-quality profile in this submarket — average credit score on applications, eviction rate, late-payment / NSF rate, and stable-employment percentage? A property-management company in the area should have these aggregated.
- How much new for-sale + rental construction is in the pipeline within 1–3 miles? Heavy new supply typically softens prices + rents 12–24 months out; constrained supply supports both.
Investment metrics
- 1% rule
- 1.28% ✓
- Cap rate
- 10.35%
- Cash-on-cash
- 14.49%
- DSCR
- 1.64
- GRM
- 6.5
CMA / ARV
- ARV (median comp)
- $236,496
- List price
- $150,000
- Delta
- -36.57%
- Verdict
- UNDERPRICED
- Comps
- 16 within 2.0 mi
Projected returns pro-forma
-3.0% appreciation · 3.0% rent growth · sell at horizon
- IRR
- -12.4%
- Equity multiple
- 0.55×
- Total profit
- $-18,909
- Equity at exit
- $22,365
- IRR
- -3.1%
- Equity multiple
- 0.79×
- Total profit
- $-8,756
- Equity at exit
- $12,969
Cash invested: $42,000 (down + closing). Projections, not guarantees.
Landlord ↔ Tenant lean methodology
- Overall (STATE)
- 55 Moderately Landlord-Leaning
- State Virginia
- 55 Moderately Landlord-Leaning · D+2
- County
- — inherits STATE
- City
- — inherits STATE
ZIP-level market 23664
- Home prices YoY
- -23.6%
- Active inventory
- 97
- Price-to-rent
- 6.5×
Monthly cashflow live
- Estimated rent
- $1,918 medium interval (Pro) →
- Mortgage (P&I)
- −$787
- Tax from tax record
- −$159 /mo · $1,907/yr
- Insurance
- −$62
- Flood insurance flood zone
- −$427 /mo · $5,118/yr
- HOA
- −$0
- Vacancy / Maint / Mgmt
- −$403
- Net cashflow
- $80
Break-even live
UW: 25.0% down · 7.5% · 30yr · 1.5% tax · 5.0% vac · 8.0% maint · 8.0% mgmt
Financing live
Cash to close
- Down payment
- $37,500
- Closing costs
- $4,500
- Reserves months
- —
- Total cash needed
- —
Loan-product check · same deal, 3 products live
Conventional
25% down · 7.5% · 30yr
- Down + closing
- —
- Monthly P&I
- —
- Monthly cashflow
- —
- DSCR
- —
- Eligible?
- —
Personal DTI + credit; lowest rate.
DSCR
20% down · 8.5% · 30yr
- Down + closing
- —
- Monthly P&I
- —
- Monthly cashflow
- —
- DSCR
- —
- Eligible?
- —
No personal income docs; deal must DSCR.
Hard money
10% down · 12.0% · 12mo
- Down + closing
- —
- Monthly P&I
- —
- Monthly cashflow
- —
- DSCR
- —
- Eligible?
- —
Short-term bridge; refi at stabilization.
Listing history 32 events
-
2026-06-18days on market $150,000 Active 273 DOM
-
2026-06-17days on market $150,000 Active 272 DOM
-
2026-06-16days on market $150,000 Active 271 DOM
-
2026-06-15days on market $150,000 Active 270 DOM
-
2026-06-13days on market $150,000 Active 267 DOM
-
2026-06-09days on market $150,000 Active 264 DOM
-
2026-06-08days on market $150,000 Active 263 DOM
-
2026-06-07days on market $150,000 Active 262 DOM
-
2026-06-03days on market $150,000 Active 258 DOM
-
2026-06-02days on market $150,000 Active 257 DOM
-
2026-06-01days on market $150,000 Active 256 DOM
-
2026-05-31days on market $150,000 Active 255 DOM
-
2025-12-01historical
-
2025-09-18$150,000 Active 381-char remark
Show marketing remark (381 chars)
This hidden gem offers endless potential as a peaceful retreat or income-generating getaway. Steps from scenic trails and moments to the water, it’s the ideal blend of nature and lifestyle. Bring your buyers, investors, or those dreaming of a second home near the coast. It’s a rare opportunity to own a slice of tranquility with room to create something truly special.
-
2025-07-01price $150,000
-
2024-11-18$275,000 Active
-
2022-08-10soldstatus $153,500
-
2022-07-21status Under Contract
-
2022-07-18historical Active Under Contract
-
2022-07-10$149,900 Active
-
2018-05-17historical
-
2018-05-02status Active
-
2017-12-16historical
-
2017-08-22$129,900 Active
-
2017-06-06historical
-
2017-03-31price $120,000
-
2016-12-14$125,000 Active
-
2016-03-31historical
-
2015-12-23$159,000 Active
-
2015-12-23$159,000
-
2010-03-29soldstatus $110,000
-
1978-12-01soldstatus $13,000
ⓘ Source: listings_history table (triggers on properties + properties_extension) + one-shot
backfill from property_details.listing_events for pre-trigger history.
Tax reassessment forecast VA · Resets to sale price
- Current annual tax
- $1,907 · $159/mo
- Projected year-2 tax
- $1,907 · $159/mo
- Expected delta
- $0/yr ($0/mo · 0.0%)
ⓘ Screening estimate from a state-policy table — verify with the county assessor before closing.
Climate risk First Street
- Flood 10/10 Extreme FEMA zone AE · 99% chance over 30 yrs
- Wildfire 2/10 Low
- Heat 9/10 Extreme 7 d/yr ≥105°F today · 17 d/yr by 30 yrs out
- Wind 8/10 Severe 80% chance of damaging wind over 30 yrs
- Air quality 2/10 Low 1 unhealthy d/yr today · 2 by 30 yrs out
Nearby sold comps map
Loading sold comps map…
Walkable amenities ~0.75 mi
Loading nearby amenities…
Taxation est. · year 1
- Rental income
- $23,013
- − Mortgage interest
- −$8,402
- − Property taxes
- −$1,907
- − Insurance
- −$5,868
- − Repairs & maintenance
- −$1,841
- − Management
- −$1,841
- − Depreciation
- −$4,364
- Taxable loss
- −$1,210
- Est. tax savings @ 24.0%
- +$291
- After-tax cash flow
- $1,256/yr
For passive investors: Depreciation is non-cash, so a rental often shows a tax loss while cash-flowing — sheltering income. Rental losses are passive: they offset passive income freely, and up to $25,000/yr can offset ordinary (W-2) income if you actively participate and your MAGI is under $100k (phasing out to $0 by $150k); unused losses carry forward. On sale, claimed depreciation is recaptured at up to 25%, and gains may owe capital-gains tax (a 1031 exchange can defer both). Figures are a year-1 estimate at your 24.0% rate — not tax advice; consult a CPA.
Schools (NCES district)
- District
- Hampton City Public School District
- NCES district ID
- 5101800
- Math proficiency
- 60% ▼ -21.00%
- Reading proficiency
- 70% ▼ -4.00%
- Median HH income
- $50,089
- Composite
- 55.19/100
- National rank
- #1272
- State rank
- #40 of 131 in VA
Livability — Hampton
- Score
- 75/100
- State rank
- #133
- US rank
- #4302
Category grades
Schools grade is shown separately in the Schools card above.
Census & demographics
- Census place
- Hampton, VA
- County
- Hampton City · 132,421 people
- City population
- 132,421
- Metro
- Virginia Beach-Norfolk-Newport News, VA-NC
- Population (ZIP)
- 9,643
- Household income
- $87,412
- Rent vs Own
- Severe rent burden
- 394.0
Population outlook (Hampton County) Hauer SSP2
- Today (2025)
- 134,055 people
- By 2030
- 131,753 · -1.7%
- By 2040
- 125,017 · -6.7%
- By 2050
- 116,825 · -12.9%
- By 2075
- 97,033 · -27.6%
- By 2100
- 76,188 · -43.2%
Race, ethnicity, and origin ACS 2023
- Neighborhood character
- Predominantly White (67%)
- Race & ethnicity
- White 67% Black 24% Two or more races 4% Hispanic / Latino 3%
- Common ancestry
- Slovak 2% Lithuanian 2% Italian 2%
- Foreign-born
- 3% · Canada, Guatemala
- Languages at home
- 97% English-only · Arabic 1% Spanish 1%
Political lean MEDSL · Hampton
- 2024 margin
- Solid D (+39.9) · D 69.2% · R 29.4% · Other 1.4%
- 2008→2024 swing
- +1.0pp no change · 2008: 38.9pp · 2024: 39.9pp
- All cycles
- 2024: D+39.9 2020: D+42.2 2016: D+37.8 2012: D+45.4 2008: D+38.9
Not yet ingested
- Civics
- —
Market trends
- HPI YoY
- ▼ -73.71%
- Current HPI
- 238.491
- Rent YoY
- —
- Metro
- Virginia Beach-Norfolk-Newport News, VA-NC
- State GDP YoY
- ▲ 2.40%
- F500 in state
- 50
Industry mix (Fortune 500 HQ in VA)
| Industry | F500 HQs | Revenue |
|---|---|---|
| Aerospace / Defense | 4 | $236B |
|
||
| Technology / Defense | 3 | $32B |
|
||
| Financial Services | 2 | $176B |
|
||
| Utilities | 2 | $27B |
|
||
| Insurance | 2 | $25B |
|
||
| Technology | 2 | $15B |
|
||
Price history
+1053.8% since first listed20 events — show timeline
- 2025-12-01 Listing Removed — REINMLS
- 2025-09-18 Listed $150,000 REINMLS
- 2025-07-01 Price Changed $150,000 REINMLS
- 2024-11-18 Listed $275,000 REINMLS
- 2022-08-10 Sold (Public Records) $153,500 Public Records
- 2022-07-21 Pending — REINMLS
- 2022-07-18 Contingent — REINMLS
- 2022-07-10 Listed $149,900 REINMLS
- 2018-05-17 Listing Removed — REINMLS
- 2018-05-02 Relisted — REINMLS
- 2017-12-16 Listing Removed — REINMLS
- 2017-08-22 Listed $129,900 REINMLS
- 2017-06-06 Listing Removed — REINMLS
- 2017-03-31 Price Changed $120,000 REINMLS
- 2016-12-14 Listed $125,000 REINMLS
- 2016-03-31 Listing Removed — REINMLS
- 2015-12-23 Listed $159,000 REINMLS
- 2015-12-23 Listed $159,000 WMLS
- 2010-03-29 Sold (Public Records) $110,000 Public Records
- 1978-12-01 Sold (Public Records) $13,000 Public Records
Property tax history
+6.6%/yrLatest (2025): $1,907 · -5.9% YoY. Source: county tax records.
Cash-flow waterfall
monthlySold comps — $/sqft
last 12 mo · ≤1 miLoading sold comps…