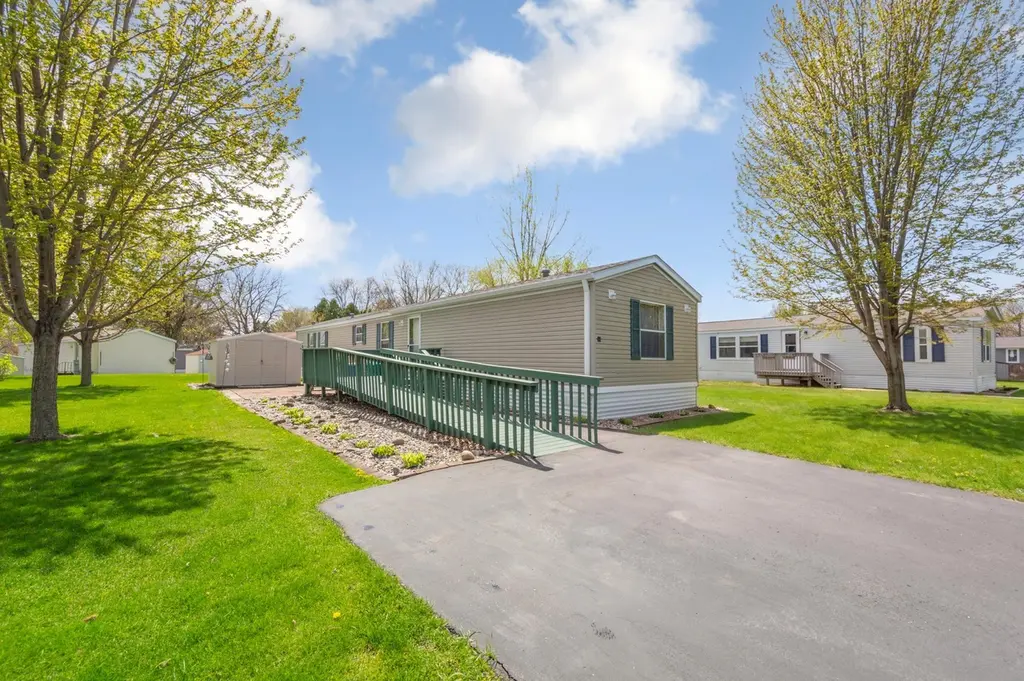
2126 3rd Ave NW #93 · Owatonna, MN
Flood risk 1/10 · Minimal
- FEMA flood zone
- X (unshaded)
- Chance of flooding over 30 yrs
- 0.0%
- Est. flood insurance / yr
- $507 – $1,088
Fire risk 1/10 · Minimal
- Est. fire insurance / yr
- $888 – $1,650
Heat risk 2/10 · Minimal
- Hot days now (above 100°F)
- 7 days/yr
- Hot days in 30 yrs
- 15 days/yr
Wind risk 2/10 · Minimal
- Chance of severe wind over 30 yrs
- —
Air-quality risk 1/10 · Minimal
- Unhealthy air days now
- 0 days/yr
- Unhealthy air days in 30 yrs
- 0 days/yr
Risk factors via First Street. Map © Google.
Why this score? — see what drove the B grade
The composite is a weighted blend of 9 inputs, each scored 0–100. Each bar is that input's sub-score; the figure is the points it added to the 100-point composite (weight × sub-score).
- Cash flow +30.0/30.0
- 1% rule +10.0/10.0
- DSCR +10.0/10.0
- ARV discount +7.5/15.0
- Livability +3.8/5.0
- Schools +3.7/10.0
- Rent growth +2.5/5.0
- Condition / age +2.5/5.0
- Appreciation +0.0/10.0
$45,000
🖨 Deal sheet 📄 Offer letter ✓ Due diligence
Listing remarks
Move right in and start enjoying this beautifully maintained home featuring 3 spacious bedrooms and 2 full bathrooms, thoughtfully designed with a desirable split-bedroom floor plan for added privacy. Situated on a double lot within the mobile home park, this property offers extra space to spread out and relax. Step outside to a welcoming deck, perfect for morning coffee or evening gatherings, along with a convenient storage shed and a paved parking area for added ease. With comfort, functionality, and outdoor enjoyment all in one package, this home truly has it all. Don't miss your opportunity! Schedule your private showing today!
Key facts
- Paved parking area
- Double lot
- Welcoming deck
Tags
Property features AI
Finance
- Other: Property type: Residential
- Financial info: Monthly land lease amount: $625
- HOA & community: Land is leased (land lease payment applies)
Exterior
- Parking: Asphalt parking
- Utilities: City water connected; City sewer connected; Natural gas; Electric with circuit breakers
- Home design: Manufactured home; Single-story (one level); All living facilities on one level
- Construction: Other construction materials; Roof replaced/installed within the last 8 years; Foundation area approximately 1,216
- Exterior features: Vinyl exterior; Deck; Storage shed; No fencing mentioned
Interior
- Kitchen: Kitchen with window; Range; Refrigerator
- Bedrooms: 3 bedrooms all on the main level; Primary bedroom suite on the main level
- Bathrooms: 2 full bathrooms; Primary bath with separate tub and walk-in shower; Main floor full bath
- Heating & cooling: Forced air heating; Central air conditioning
- Interior features: Natural woodwork; Informal dining area
- Laundry & utility: Main level laundry in hall
Neighborhood map
What this means for you Summary
Snapshot
- This is a 3-bed/2.0-bath manufactured listed at $45k.
Deal economics
- At list price, monthly cash flow is $757 ($9k/yr) — positive.
- The deal already cash-flows at list — no discount required.
- Meets the 1% rule at list price ($1k rent vs $45k).
- Recommended offer: $44k (3.0% below list) — sets the bar for market timing.
- Cap rate 26.5% vs local median 3.2% in Owatonna — top-decile yield for the area; either an underpriced asset or a hidden risk that comps aren't pricing in. Stress-test before assuming the spread holds.
Location & tenants
- Location reads 76/100 on livability (#155 in MN, #3,413 nationally) — a middle-class / working-renter tenant base. Strengths: cost of living A+, housing A+, crime A; Watch: amenities D-, commute F, health & safety D-.
- Owatonna Public School District (town): math 38% / reading 47% proficiency, ranked #194 of 301 in MN (top 64%) — families likely to look elsewhere, expect single-tenant / working-renter base with shorter leases.
- Market conditions: 224 active listings in the ZIP; 7 comparable units currently listed for rent nearby; rentals lingering (median 44d on market — plan ~5-8 weeks vacancy on turnover, expect pricing pressure); 100% of comp listings sitting > 30 days — soft ceiling on asking rent; solid renter incomes; 28 units permitted in Steele County in 2024 (0 in 5+ unit buildings).
Forward outlook
- Local home prices are declining (-3.0%/yr); year-one equity from $311 of loan paydown is wiped out by about $1k of value loss. Plan a longer hold.
- Steele County population projected to shrink 10% by 2050 — rents likely to lag national; underwrite the cash flow, not the appreciation.
- At projected returns (-3.0% appreciation + 3.0% rent growth), your $13k cash investment doubles in ~2 years — after that, you're playing with house money.
Negotiation context
- It's been on market 32 days — a 3% lower offer ($44k) is reasonable based on typical stale-listing flexibility.
Questions for the listing agent
- It's been on market 32 days. Have you received any prior offers? Is the seller open to a 3% concession, seller financing, or rate buy-down credit?
- Is there a deadline driving the sale (1031 exchange, divorce, estate, relocation)? That informs how much negotiation room exists.
- Schools are B-rated — typically a magnet for longer-tenancy family renters. What's the average tenant stay here, and is there a school-zone premium baked into asking?
- What's the average days-on-market for RENTAL listings here right now (not sales)? A rising rental-DOM trend means longer vacancies and softer asking-rent achievability than the comps imply.
- What's the recent tenant-quality profile in this submarket — average credit score on applications, eviction rate, late-payment / NSF rate, and stable-employment percentage? A property-management company in the area should have these aggregated.
- How much new for-sale + rental construction is in the pipeline within 1–3 miles? Heavy new supply typically softens prices + rents 12–24 months out; constrained supply supports both.
Investment metrics
- 1% rule
- 2.92% ✓
- Cap rate
- 26.48%
- Cash-on-cash
- 72.10%
- DSCR
- 4.21
- GRM
- 2.9
CMA / ARV
- ARV (median comp)
- $363,504
- List price
- $45,000
- Delta
- -87.62%
- Verdict
- UNDERPRICED
- Comps
- 3 within 1.0 mi
Projected returns pro-forma
-3.0% appreciation · 3.0% rent growth · sell at horizon
- IRR
- 71.8%
- Equity multiple
- 4.25×
- Total profit
- $40,927
- Equity at exit
- $6,710
- IRR
- 75.7%
- Equity multiple
- 8.76×
- Total profit
- $97,730
- Equity at exit
- $3,891
Cash invested: $12,600 (down + closing). Projections, not guarantees.
Landlord ↔ Tenant lean methodology
- Overall (STATE)
- 46 Balanced
- State Minnesota
- 46 Balanced · D+2
- County
- — inherits STATE
- City
- — inherits STATE
ZIP-level market 55060
- Home prices YoY
- -30.5%
- Active inventory
- 224
- Price-to-rent
- 2.9×
Monthly cashflow live
- Estimated rent
- $1,313 high interval (Pro) →
- Mortgage (P&I)
- −$236
- Tax from tax record
- −$25 /mo · $302/yr
- Insurance
- −$19
- HOA
- −$0
- Vacancy / Maint / Mgmt
- −$276
- Net cashflow
- $757
Break-even live
UW: 25.0% down · 7.5% · 30yr · 1.5% tax · 5.0% vac · 8.0% maint · 8.0% mgmt
Financing live
Cash to close
- Down payment
- $11,250
- Closing costs
- $1,350
- Reserves months
- —
- Total cash needed
- —
Loan-product check · same deal, 3 products live
Conventional
25% down · 7.5% · 30yr
- Down + closing
- —
- Monthly P&I
- —
- Monthly cashflow
- —
- DSCR
- —
- Eligible?
- —
Personal DTI + credit; lowest rate.
DSCR
20% down · 8.5% · 30yr
- Down + closing
- —
- Monthly P&I
- —
- Monthly cashflow
- —
- DSCR
- —
- Eligible?
- —
No personal income docs; deal must DSCR.
Hard money
10% down · 12.0% · 12mo
- Down + closing
- —
- Monthly P&I
- —
- Monthly cashflow
- —
- DSCR
- —
- Eligible?
- —
Short-term bridge; refi at stabilization.
Rent comps 7 comps
| Address | Beds | Baths | Sqft | Rent | $/sqft | DOM | Units | Dist |
|---|---|---|---|---|---|---|---|---|
| 2126 3rd Ave NW Owatonna, MN | 2.0–3.0 | 2.0 | 1264 | $1,210 | $0.96 | 43d | 1 | 0.03mi |
| 592 Adams Ave NW Owatonna, MN | 4.0 | 1.0 | 1100 | $1,700 | $1.55 | 43d | 1 | 0.96mi |
| 312 Riverside Ave Unit 1 Owatonna, MN | 2.0 | 1.0 | 1000 | $1,300 | $1.30 | 43d | 1 | 1.21mi |
| 1575 24th Ave NW Unit 207 Owatonna, MN | 2.0 | 2.0 | 996 | $1,585 | $1.59 | 43d | 1 | 1.22mi |
| 230 E Rose St Unit 2 Owatonna, MN | 2.0 | 1.0 | 850 | $975 | $1.15 | 43d | 1 | 1.26mi |
| 236 E Rose St Unit 236 1/2 Owatonna, MN | 2.0 | 1.0 | 900 | $1,100 | $1.22 | 43d | 1 | 1.27mi |
| 325 Florence Ave Unit 313 Owatonna, MN | 2.0 | 2.0 | 1046 | $1,605 | $1.53 | 43d | 1 | 1.37mi |
Listing history 5 events
-
2026-06-01status $45,000 Pending 32 DOM
-
2026-06-01days on market $45,000 Active 32 DOM
-
2026-05-31days on market $45,000 Active 31 DOM
-
2026-05-30days on market $45,000 Active 30 DOM
-
2026-04-30$45,000 Active 639-char remark
ⓘ Source: listings_history table (triggers on properties + properties_extension) + one-shot
backfill from property_details.listing_events for pre-trigger history.
Tax reassessment forecast MN · Partial reset (capped growth)
- Current annual tax
- $302 · $25/mo
- Projected year-2 tax
- $403 · $34/mo
- Expected delta
- +$101/yr (+$8/mo · 33.4%)
ⓘ Screening estimate from a state-policy table — verify with the county assessor before closing.
Climate risk First Street
- Flood 1/10 Low FEMA zone X (unshaded) · 0% chance over 30 yrs
- Wildfire 1/10 Low
- Heat 2/10 Low 7 d/yr ≥100°F today · 15 d/yr by 30 yrs out
- Wind 2/10 Low
- Air quality 1/10 Low 0 unhealthy d/yr today · 0 by 30 yrs out
Nearby sold comps map
Loading sold comps map…
Walkable amenities ~0.75 mi
Loading nearby amenities…
Taxation est. · year 1
- Rental income
- $15,751
- − Mortgage interest
- −$2,521
- − Property taxes
- −$302
- − Insurance
- −$225
- − Repairs & maintenance
- −$1,260
- − Management
- −$1,260
- − Depreciation
- −$1,309
- Taxable income
- $8,874
- Est. tax owed @ 24.0%
- −$2,130
- After-tax cash flow
- $6,955/yr
For passive investors: Depreciation is non-cash, so a rental often shows a tax loss while cash-flowing — sheltering income. Rental losses are passive: they offset passive income freely, and up to $25,000/yr can offset ordinary (W-2) income if you actively participate and your MAGI is under $100k (phasing out to $0 by $150k); unused losses carry forward. On sale, claimed depreciation is recaptured at up to 25%, and gains may owe capital-gains tax (a 1031 exchange can defer both). Figures are a year-1 estimate at your 24.0% rate — not tax advice; consult a CPA.
Schools (NCES district)
- District
- Owatonna Public School District
- NCES district ID
- 2728050
- Math proficiency
- 38% ▼ -12.00%
- Reading proficiency
- 47% ▼ -7.00%
- Median HH income
- $56,373
- Composite
- 37.14/100
- National rank
- #4487
- State rank
- #194 of 301 in MN
Livability — Owatonna
- Score
- 76/100
- State rank
- #155
- US rank
- #3413
Category grades
Schools grade is shown separately in the Schools card above.
Census & demographics
- Census place
- Owatonna, MN
- County
- Steele County · 29,599 people
- City population
- 29,599
- Metro
- Owatonna, MN
- Population (ZIP)
- 29,599
- Household income
- $84,906
- Rent vs Own
- Severe rent burden
- 598.0
Population outlook (Steele County) Hauer SSP2
- Today (2025)
- 36,618 people
- By 2030
- 36,195 · -1.2%
- By 2040
- 34,882 · -4.7%
- By 2050
- 33,052 · -9.7%
- By 2075
- 29,692 · -18.9%
- By 2100
- 25,581 · -30.1%
Race, ethnicity, and origin ACS 2023
- Neighborhood character
- Predominantly White (84%)
- Race & ethnicity
- White 84% Hispanic / Latino 8% Two or more races 5% Black 4%
- Hispanic origin (detail)
- Mexican 7%
- Common ancestry
- Portuguese 16% Romanian 3% Italian 2%
- Foreign-born
- 5% · Canada, South Korea
- Languages at home
- 93% English-only · Spanish 4%
Political lean MEDSL · Steele
- 2024 margin
- Strong R (+24.5) · D 36.8% · R 61.2% · Other 2.0%
- 2008→2024 swing
- -19.1pp toward R · 2008: -5.3pp · 2024: -24.5pp
- All cycles
- 2024: R+24.5 2020: R+22.4 2016: R+26.0 2012: R+6.3 2008: R+5.3
Not yet ingested
- Civics
- —
Market trends
- HPI YoY
- ▼ -92.54%
- Current HPI
- 211.0177
- Rent YoY
- —
- Metro
- Owatonna, MN
- State GDP YoY
- ▲ 2.41%
- F500 in state
- 34
Industry mix (Fortune 500 HQ in MN)
| Industry | F500 HQs | Revenue |
|---|---|---|
| Healthcare | 2 | $407B |
|
||
| Retail | 2 | $150B |
|
||
| Consumer Goods | 2 | $32B |
|
||
| Industrial Machinery | 2 | $6B |
|
||
| Agriculture | 1 | $40B |
|
||
| Healthcare / Medical Devices | 1 | $32B |
|
||
Price history
2 events — show timeline
- 2026-06-01 Pending — NORTHSTARMLS as Distributed by MLS Grid
- 2026-04-30 Listed $45,000 NORTHSTARMLS as Distributed by MLS Grid
Property tax history
+0.8%/yrLatest (2025): $302 · +1.3% YoY. Source: county tax records.
Cash-flow waterfall
monthlySold comps — $/sqft
last 12 mo · ≤1 miLoading sold comps…