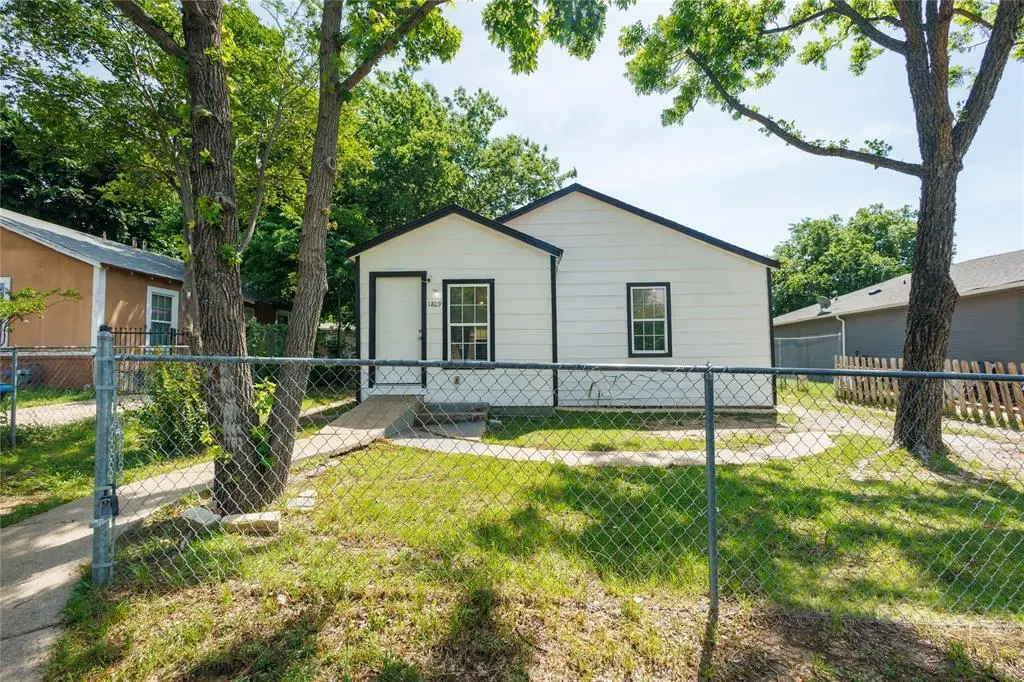
1809 Birdell St · Fort Worth, TX
Flood risk 1/10 · Minimal
- FEMA flood zone
- X (unshaded)
- Chance of flooding over 30 yrs
- 0.0%
- Est. flood insurance / yr
- $507 – $1,088
Fire risk 1/10 · Minimal
- Est. fire insurance / yr
- $1,222 – $2,270
Heat risk 7/10 · Major
- Hot days now (above 110°F)
- 7 days/yr
- Hot days in 30 yrs
- 23 days/yr
Wind risk 5/10 · Moderate
- Chance of severe wind over 30 yrs
- 26.0%
Air-quality risk 3/10 · Minor
- Unhealthy air days now
- 2 days/yr
- Unhealthy air days in 30 yrs
- 4 days/yr
Risk factors via First Street. Map © Google.
Why this score? — see what drove the C- grade
The composite is a weighted blend of 9 inputs, each scored 0–100. Each bar is that input's sub-score; the figure is the points it added to the 100-point composite (weight × sub-score).
- Cash flow +13.5/30.0
- ARV discount +10.7/15.0
- Appreciation +10.0/10.0
- 1% rule +4.1/10.0
- DSCR +4.1/10.0
- Livability +4.0/5.0
- Rent growth +2.5/5.0
- Condition / age +2.5/5.0
- Schools +2.0/10.0
$179,900
🖨 Deal sheet 📄 Offer letter ✓ Due diligence
Listing remarks MLS
DON'T MISS OUT ON THIS GREAT INVESTMENT OPPORTUNITY! LARGE LOT, CENTRALLY LOCATED, NEW CABINETRY, NEW ELECTRICAL FIXTURES, CENTRAL HVAC, FRESH PAINT, IN NEED OF SOME REMANING FINISH OUT- DON'T MISS OUT, VIEW TODAY!
Key facts
- Close to parks
- Close to schools
- Large back yard
Tags
Property features AI
Finance
- Financial info: Listing accepts Cash, Conventional, FHA, and VA financing; No second mortgage reported
- HOA & community: No association
Exterior
- Parking: Inside entrance (covered parking not specified)
- Utilities: City water; City sewer; Electricity connected
- Home design: Single-family residence; One story; Residential property
- Construction: Built in 1950; Siding exterior; Composition/shingle roof; Pillar/post/pier foundation
- Exterior features: Chain link fence; Utilities easement; Less than 0.5 acre lot (approximately 0.1490 acres)
Interior
- Kitchen: Electric range; Refrigerator
- Bedrooms: 3 bedrooms (all on the main level)
- Flooring: Ceramic tile; Laminate
- Bathrooms: 1 full bathroom
- Heating & cooling: Central heating; Central air; Ceiling fan(s)
- Interior features: Tile countertops; One living area and one dining area; 5 total rooms
- Laundry & utility: Washer hookup; Electric dryer hookup; Utility room
Neighborhood map
What this means for you Summary
Snapshot
- This is a 3-bed/1.0-bath single-family listed at $180k.
Deal economics
- At list price, monthly cash flow is $8 ($99/yr) — positive.
- The deal already cash-flows at list — no discount required.
- To meet the 1% rule (rent ≥ 1% of price), the offer needs to be $164k (8.7% below list).
- Recommended offer: $164k (8.7% below list) — sets the bar for 1% rule.
- Cap rate 6.3% vs local median 3.9% in Fort Worth — top-decile yield for the area; either an underpriced asset or a hidden risk that comps aren't pricing in. Stress-test before assuming the spread holds.
Location & tenants
- Location reads 80/100 on livability (#49 in TX, #1,954 nationally) — a professional / high-income tenant draw. Strengths: amenities A+, cost of living A+, housing A+; Watch: crime F.
- Fort Worth ISD (urban): math 18% / reading 28% proficiency, ranked #742 of 826 in TX (top 90%) — low school quality limits family demand, transient renter base, plan for 1-2y turnover; 73% free/reduced lunch — lower-income household profile, screen leases tightly.
- Zoned schools: Christene C Moss El (math 12% / reading 17%, grade F, #4,048 of 4,322 statewide, top 95%, 291 students, 99% FRL) — zoned schools average 99% FRL vs 73% district-wide (26 pts higher); higher-poverty schools than district average — tighter screening recommended.
- Market conditions: 99 active listings in the ZIP; 20 comparable units currently listed for rent nearby; rentals at typical pace (median 14d on market — plan ~3-4 weeks tenant-placement turnaround); 18,938 units permitted in Tarrant County in 2024 (8,336 in 5+ unit buildings).
Forward outlook
- In year one you build about $19k of equity ($1k loan paydown + $18k appreciation (10.0% local appreciation)).
- Tarrant County population projected at +41% by 2050 — long-run rental-demand tailwind backs the buy-and-hold thesis.
- At projected returns (10.0% appreciation + 3.0% rent growth), your $50k cash investment doubles in ~3 years — after that, you're playing with house money.
- By year 2, paydown + projected appreciation supports a ~$31k cash-out refi (75% LTV) — recoverable capital for the next deal without selling this one.
Negotiation context
- It's been on market 43 days — a 3% lower offer ($175k) is reasonable based on typical stale-listing flexibility.
- 5 sale attempts since 22y ago; this cycle's ask has dropped $15k (8%) from the opening price — seller is motivated, your offer sets the floor, not the list.
Risks & watch-outs
- Watch-outs: built in 1950 — expect roof / HVAC / electrical / plumbing capex.
- Climate carrying-cost: moderate wind risk, 26% chance of damaging wind over 30y; extreme-heat days projected 7→23/yr by 2055 (HVAC capex compounding) — expect insurance premiums to compound above CPI over the hold.
Questions for the listing agent
- It's been on market 43 days. Have you received any prior offers? Is the seller open to a 9% concession, seller financing, or rate buy-down credit?
- Built in 1950 — when were the roof, HVAC, electrical panel, plumbing, and water heater last replaced?
- Is there a deadline driving the sale (1031 exchange, divorce, estate, relocation)? That informs how much negotiation room exists.
- Schools are D-rated, which usually means shorter tenancies and higher turnover. Who's the typical renter profile here, and what's been the actual vacancy rate?
- Crime grade is F in this area — have there been break-ins, vandalism, or insurance claims at this property in the last 3 years? What carrier currently insures it and at what premium?
- What's the average days-on-market for RENTAL listings here right now (not sales)? A rising rental-DOM trend means longer vacancies and softer asking-rent achievability than the comps imply.
- What's the recent tenant-quality profile in this submarket — average credit score on applications, eviction rate, late-payment / NSF rate, and stable-employment percentage? A property-management company in the area should have these aggregated.
- How much new for-sale + rental construction is in the pipeline within 1–3 miles? Heavy new supply typically softens prices + rents 12–24 months out; constrained supply supports both.
Investment metrics
- 1% rule
- 0.91% ✗
- Cap rate
- 6.35%
- Cash-on-cash
- 0.20%
- DSCR
- 1.01
- GRM
- 9.1
CMA / ARV
- ARV (median comp)
- $193,465
- List price
- $179,900
- Delta
- -7.01%
- Verdict
- FAIR
- Comps
- 20 within 1.0 mi
Show comp detail 12 sales within ~0.75 mi
| Address | Dist | Beds/Ba | Sqft | Sold | Price | $/sf | Match |
|---|---|---|---|---|---|---|---|
| 5524 Truman Dr | 0.25mi | 3/2.0 | 999 (+3%) | 4mo | $216,000 | $216 | 76 |
| 2013 Birdell St | 0.10mi | 3/2.0 | 896 (-7%) | 4mo | $174,900 | $195 | 75 |
| 1804 Wiseman Ave | 0.09mi | 3/1.0 | 876 (-10%) | 6mo | $124,900 | $143 | 75 |
| 2213 Dillard St | 0.26mi | 3/2.0 | 1,042 (+8%) | 4mo | $224,900 | $216 | 68 |
| 2204 Rw Bivens Ln | 0.27mi | 3/1.0 | 1,100 (+14%) | 4mo | $75,000 | $68 | 62 |
| 5513 Cottey St | 0.75mi | 3/1.0 | 960 (-1%) | 3mo | $165,000 | $172 | 61 |
| 2108 Rw Bivens Ln | 0.18mi | 3/2.0 | 1,088 (+12%) | 8mo | $205,000 | $188 | 60 |
| 2001 Edmonia Ct | 0.52mi | 2/2.0 (-1) | 1,018 (+5%) | 3mo | $129,000 | $127 | 56 |
| 5629 Wainwright Dr | 0.47mi | 2/1.0 (-1) | 856 (-12%) | 4mo | $130,000 | $152 | 51 |
| 5636 Lester Granger Dr | 0.54mi | 2/1.0 (-1) | 1,052 (+9%) | 8mo | $170,000 | $162 | 49 |
| 4813 Chapman St | 0.62mi | 3/2.0 | 1,046 (+8%) | 6mo | $210,000 | $201 | 48 |
| 5536 Alter Dr | 0.74mi | 4/2.0 (+1) | 1,037 (+7%) | 7mo | $220,000 | $212 | 39 |
Match score weights: distance 35% · size 25% · config 20% · recency 20%. Top-matched comps best support the ARV.
Projected returns pro-forma
10.0% appreciation · 3.0% rent growth · sell at horizon
- IRR
- 24.4%
- Equity multiple
- 2.96×
- Total profit
- $98,556
- Equity at exit
- $162,068
- IRR
- 21.6%
- Equity multiple
- 6.76×
- Total profit
- $289,925
- Equity at exit
- $349,506
Cash invested: $50,372 (down + closing). Projections, not guarantees.
Landlord ↔ Tenant lean methodology
- Overall (STATE)
- 87 Strongly Landlord-Friendly
- State Texas
- 87 Strongly Landlord-Friendly · R+5
- County
- — inherits STATE
- City
- — inherits STATE
ZIP-level market 76105
- Home prices YoY
- 14.2%
- Active inventory
- 99
- Price-to-rent
- 9.1×
Monthly cashflow live
- Estimated rent
- $1,643 high interval (Pro) →
- Mortgage (P&I)
- −$943
- Tax from tax record
- −$271 /mo · $3,254/yr
- Insurance
- −$75
- HOA
- −$0
- Vacancy / Maint / Mgmt
- −$345
- Net cashflow
- $8
Break-even live
UW: 25.0% down · 7.5% · 30yr · 1.5% tax · 5.0% vac · 8.0% maint · 8.0% mgmt
Financing live
Cash to close
- Down payment
- $44,975
- Closing costs
- $5,397
- Reserves months
- —
- Total cash needed
- —
Loan-product check · same deal, 3 products live
Conventional
25% down · 7.5% · 30yr
- Down + closing
- —
- Monthly P&I
- —
- Monthly cashflow
- —
- DSCR
- —
- Eligible?
- —
Personal DTI + credit; lowest rate.
DSCR
20% down · 8.5% · 30yr
- Down + closing
- —
- Monthly P&I
- —
- Monthly cashflow
- —
- DSCR
- —
- Eligible?
- —
No personal income docs; deal must DSCR.
Hard money
10% down · 12.0% · 12mo
- Down + closing
- —
- Monthly P&I
- —
- Monthly cashflow
- —
- DSCR
- —
- Eligible?
- —
Short-term bridge; refi at stabilization.
Rent comps 20 comps
| Address | Beds | Baths | Sqft | Rent | $/sqft | DOM | Units | Dist |
|---|---|---|---|---|---|---|---|---|
| 1804 Andrew Ave Fort Worth, TX | 2.0 | 1.0 | 764 | $1,395 | $1.83 | 17d | 1 | 0.04mi |
| 1810 Wiseman Ave Fort Worth, TX | 3.0 | 2.0 | 1000 | $1,500 | $1.50 | 43d | 1 | 0.08mi |
| 2128 R. W. Bivens Ln Fort Worth, TX | 3.0 | 2.0 | 1045 | $1,615 | $1.55 | 14d | 1 | 0.21mi |
| 5011 Sunshine Dr Fort Worth, TX | 2.0 | 1.0 | 813 | $1,515 | $1.86 | 24d | 1 | 0.62mi |
| 5336 Cottey St Fort Worth, TX | 3.0 | 2.0 | 1045 | $1,699 | $1.63 | 43d | 1 | 0.71mi |
| 3201 Mount Horum Way Fort Worth, TX | 3.0 | 2.0 | 1045 | $1,699 | $1.63 | 6d | 1 | 0.78mi |
| 5023 Vinson St Unit 5023 Fort Worth, TX | 2.0 | 1.0 | 742 | $1,175 | $1.58 | 43d | 1 | 0.89mi |
| 5200 E Lancaster Ave Fort Worth, TX | 1.0–2.0 | 1.0–2.0 | 799 | $1,575 | $1.97 | 2d | 14 | 1.00mi |
| 2500 S Edgewood Ter Fort Worth, TX | 1.0–3.0 | 1.0–2.5 | 1123 | $1,895 | $1.69 | 2d | 34 | 1.02mi |
| 3700 Radford Rd Fort Worth, TX | 3.0 | 2.0 | 1124 | $1,650 | $1.47 | 24d | 1 | 1.08mi |
| 3700 Radford Rd Fort Worth, TX | 3.0 | 2.0 | 1124 | $1,650 | $1.47 | 13d | 1 | 1.08mi |
| 4909 E Lancaster Ave Fort Worth, TX | 1.0–3.0 | 1.0–2.0 | 958 | $2,225 | $2.32 | 3d | 12 | 1.20mi |
| 501 S Edgewood Ter Fort Worth, TX | 1.0–2.0 | 1.0–2.0 | 887 | $1,575 | $1.77 | 13d | 10 | 1.21mi |
| 4761 E Lancaster Ave Fort Worth, TX | 2.0 | 1.0 | 714 | $1,500 | $2.10 | 2d | 9 | 1.23mi |
| 5055 Virgil St Fort Worth, TX | 3.0 | 2.0 | 1089 | $1,650 | $1.52 | 24d | 1 | 1.27mi |
| 4220 Ramey Ave Fort Worth, TX | 2.0 | 1.0 | 832 | $1,680 | $2.02 | 5d | 1 | 1.31mi |
| 3848 Waldorf St Fort Worth, TX | 2.0 | 1.0 | 734 | $1,195 | $1.63 | 5d | 1 | 1.34mi |
| 3865 Stalcup Rd Fort Worth, TX | 3.0 | 2.0 | 1090 | $1,814 | $1.66 | 6d | 1 | 1.37mi |
| 2521 Putnam St Fort Worth, TX | 3.0 | 1.5 | 1105 | $1,750 | $1.58 | 43d | 1 | 1.38mi |
| 5720 Meadowbrook Dr Unit 202 Fort Worth, TX | 2.0 | 2.0 | 919 | $1,350 | $1.47 | 43d | 1 | 1.43mi |
Listing history 40 events
-
2026-06-18days on market $179,900 Active 43 DOM
-
2026-06-17days on market $179,900 Active 42 DOM
-
2026-06-16days on market $179,900 Active 41 DOM
-
2026-06-15days on market $179,900 Active 40 DOM
-
2026-06-13days on market $179,900 Active 38 DOM
-
2026-06-09days on market $179,900 Active 34 DOM
-
2026-06-08pricedays on market $179,900 Active 33 DOM
-
2026-06-07days on market $182,500 Active 32 DOM
-
2026-06-04days on market $182,500 Active 29 DOM
-
2026-06-03days on market $182,500 Active 28 DOM
-
2026-06-02days on market $182,500 Active 27 DOM
-
2026-06-01days on market $182,500 Active 26 DOM
-
2026-05-31days on market $182,500 Active 25 DOM
-
2026-05-05$195,000 Active 347-char remark
-
2019-10-24soldstatus
-
2016-08-12soldstatus
-
2012-05-31historical
-
2012-02-15historical Active Contingent
-
2012-01-31price $12,900
-
2011-09-28price $15,900 Active
-
2011-09-28status Active
-
2011-08-18status Pending
-
2011-08-10historical Active Option Contract
-
2011-07-13price $13,900
-
2011-06-30price $15,900
-
2011-05-10price $14,900
-
2011-05-04price $10,900
-
2011-04-29price $14,900
-
2011-04-26$19,900 Active
-
2006-12-28soldstatus
-
2006-10-30soldstatus
-
2006-10-20soldstatus
Show marketing remark (214 chars)
DON'T MISS OUT ON THIS GREAT INVESTMENT OPPORTUNITY! LARGE LOT, CENTRALLY LOCATED, NEW CABINETRY, NEW ELECTRICAL FIXTURES, CENTRAL HVAC, FRESH PAINT, IN NEED OF SOME REMANING FINISH OUT- DON'T MISS OUT, VIEW TODAY!
-
2006-10-02historical
Show marketing remark (214 chars)
DON'T MISS OUT ON THIS GREAT INVESTMENT OPPORTUNITY! LARGE LOT, CENTRALLY LOCATED, NEW CABINETRY, NEW ELECTRICAL FIXTURES, CENTRAL HVAC, FRESH PAINT, IN NEED OF SOME REMANING FINISH OUT- DON'T MISS OUT, VIEW TODAY!
-
2006-07-11$19,900
Show marketing remark (214 chars)
DON'T MISS OUT ON THIS GREAT INVESTMENT OPPORTUNITY! LARGE LOT, CENTRALLY LOCATED, NEW CABINETRY, NEW ELECTRICAL FIXTURES, CENTRAL HVAC, FRESH PAINT, IN NEED OF SOME REMANING FINISH OUT- DON'T MISS OUT, VIEW TODAY!
-
2005-08-29soldstatus
-
2005-07-01soldstatus
-
2004-10-04soldstatus
-
2004-09-30soldstatus
-
2004-09-23historical
-
2004-07-06$20,159
ⓘ Source: listings_history table (triggers on properties + properties_extension) + one-shot
backfill from property_details.listing_events for pre-trigger history.
Tax reassessment forecast TX · Resets to sale price
- Current annual tax
- $3,254 · $271/mo
- Projected year-2 tax
- $3,292 · $274/mo
- Expected delta
- +$38/yr (+$3/mo · 1.2%)
ⓘ Screening estimate from a state-policy table — verify with the county assessor before closing.
Climate risk First Street
- Flood 1/10 Low FEMA zone X (unshaded) · 0% chance over 30 yrs
- Wildfire 1/10 Low
- Heat 7/10 Severe 7 d/yr ≥110°F today · 23 d/yr by 30 yrs out
- Wind 5/10 Major 26% chance of damaging wind over 30 yrs
- Air quality 3/10 Moderate 2 unhealthy d/yr today · 4 by 30 yrs out
Nearby sold comps map
Loading sold comps map…
Walkable amenities ~0.75 mi
Loading nearby amenities…
Taxation est. · year 1
- Rental income
- $19,713
- − Mortgage interest
- −$10,077
- − Property taxes
- −$3,254
- − Insurance
- −$900
- − Repairs & maintenance
- −$1,577
- − Management
- −$1,577
- − Depreciation
- −$5,233
- Taxable loss
- −$2,905
- Est. tax savings @ 24.0%
- +$697
- After-tax cash flow
- $796/yr
For passive investors: Depreciation is non-cash, so a rental often shows a tax loss while cash-flowing — sheltering income. Rental losses are passive: they offset passive income freely, and up to $25,000/yr can offset ordinary (W-2) income if you actively participate and your MAGI is under $100k (phasing out to $0 by $150k); unused losses carry forward. On sale, claimed depreciation is recaptured at up to 25%, and gains may owe capital-gains tax (a 1031 exchange can defer both). Figures are a year-1 estimate at your 24.0% rate — not tax advice; consult a CPA.
Schools (NCES district)
- District
- Fort Worth ISD
- NCES district ID
- 4819700
- Math proficiency
- 18% ▼ -16.00%
- Reading proficiency
- 28% ▼ -6.00%
- Median HH income
- $42,109
- Composite
- 19.61/100
- National rank
- #8753
- State rank
- #742 of 826 in TX
Livability — Fort Worth
- Score
- 80/100
- State rank
- #49
- US rank
- #1954
Category grades
Schools grade is shown separately in the Schools card above.
Census & demographics
- Census place
- Fort Worth, TX
- County
- Tarrant County · 2,033,669 people
- City population
- 911,619
- Metro
- Dallas-Fort Worth-Arlington, TX
- Population (ZIP)
- 22,228
- Household income
- $45,770
- Rent vs Own
- Severe rent burden
- 884.0
Population outlook (Tarrant County) Hauer SSP2
- Today (2025)
- 2,380,417 people
- By 2030
- 2,578,900 · +8.3%
- By 2040
- 2,974,995 · +25.0%
- By 2050
- 3,350,489 · +40.8%
- By 2075
- 4,216,909 · +77.2%
- By 2100
- 4,741,527 · +99.2%
Race, ethnicity, and origin ACS 2023
- Neighborhood character
- Majority Hispanic (63%)
- Race & ethnicity
- Hispanic / Latino 63% Black 29% Two or more races 24% White 6%
- Hispanic origin (detail)
- Mexican 57%
- Foreign-born
- 28% · Canada
- Languages at home
- 44% English-only · Spanish 55% Other Indo-European 1%
Political lean MEDSL · Tarrant
- 2024 margin
- Lean R (+5.1) · D 46.7% · R 51.9% · Other 1.4%
- 2008→2024 swing
- +6.6pp toward D · 2008: -11.7pp · 2024: -5.1pp
- All cycles
- 2024: R+5.1 2020: D+0.2 2016: R+8.7 2012: R+15.7 2008: R+11.7
Not yet ingested
- Civics
- —
Market trends
- HPI YoY
- ▲ 27.33%
- Current HPI
- 219.2657
- Rent YoY
- —
- Metro
- Dallas-Fort Worth-Arlington, TX
- State GDP YoY
- ▲ 3.95%
- F500 in state
- 110
Industry mix (Fortune 500 HQ in TX)
| Industry | F500 HQs | Revenue |
|---|---|---|
| Energy | 16 | $1,198B |
|
||
| Technology | 5 | $198B |
|
||
| Engineering / Construction | 4 | $72B |
|
||
| Energy Services | 3 | $60B |
|
||
| Utilities | 3 | $41B |
|
||
| Healthcare | 2 | $330B |
|
||
Price history
+792.4% since first listed31 events — show timeline
- 2026-06-08 Price Changed $179,900 NTREIS
- 2026-05-29 Price Changed $182,500 NTREIS
- 2026-05-23 Price Changed $185,500 NTREIS
- 2026-05-19 Price Changed $192,500 NTREIS
- 2026-05-05 Listed $195,000 NTREIS
- 2019-10-24 Sold (Public Records) — Public Records
- 2016-08-12 Sold (Public Records) — Public Records
- 2012-05-31 Listing Removed — NTREIS
- 2012-02-15 Contingent — NTREIS
- 2012-01-31 Price Changed $12,900 NTREIS
- 2011-09-28 Relisted — NTREIS
- 2011-09-28 Price Changed $15,900 NTREIS
- 2011-08-18 Pending — NTREIS
- 2011-08-10 Contingent — NTREIS
- 2011-07-13 Price Changed $13,900 NTREIS
- 2011-06-30 Price Changed $15,900 NTREIS
- 2011-05-10 Price Changed $14,900 NTREIS
- 2011-05-04 Price Changed $10,900 NTREIS
- 2011-04-29 Price Changed $14,900 NTREIS
- 2011-04-26 Listed $19,900 NTREIS
- 2006-12-28 Sold (Public Records) — Public Records
- 2006-10-30 Sold (Public Records) — Public Records
- 2006-10-20 Sold (MLS) — NTREIS
- 2006-10-02 Listing Removed — NTREIS
- 2006-07-11 Listed $19,900 NTREIS
- 2005-08-29 Sold (Public Records) — Public Records
- 2005-07-01 Sold (Public Records) — Public Records
- 2004-10-04 Sold (Public Records) — Public Records
- 2004-09-30 Sold (MLS) — NTREIS
- 2004-09-23 Listing Removed — NTREIS
- 2004-07-06 Listed $20,159 NTREIS
Property tax history
+8.9%/yrLatest (2025): $3,254 · -2.4% YoY. Source: county tax records.
Cash-flow waterfall
monthlySold comps — $/sqft
last 12 mo · ≤1 miLoading sold comps…