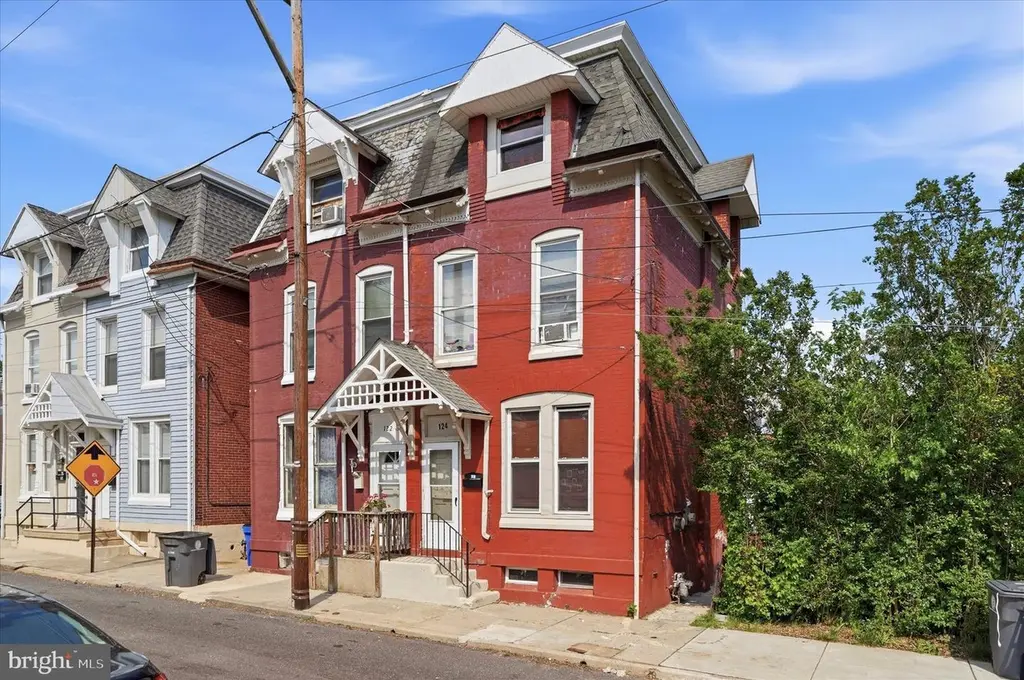
124 S Evans St · Pottstown, PA
Flood risk 3/10 · Minor
- FEMA flood zone
- X (unshaded)
- Chance of flooding over 30 yrs
- 0.12%
- Est. flood insurance / yr
- $473 – $860
Fire risk 1/10 · Minimal
- Est. fire insurance / yr
- $511 – $949
Heat risk 6/10 · Moderate
- Hot days now (above 101°F)
- 7 days/yr
- Hot days in 30 yrs
- 16 days/yr
Wind risk 4/10 · Minor
- Chance of severe wind over 30 yrs
- 20.0%
Air-quality risk 2/10 · Minimal
- Unhealthy air days now
- 1 days/yr
- Unhealthy air days in 30 yrs
- 3 days/yr
Risk factors via First Street. Map © Google.
Why this score? — see what drove the C grade
The composite is a weighted blend of 9 inputs, each scored 0–100. Each bar is that input's sub-score; the figure is the points it added to the 100-point composite (weight × sub-score).
- Cash flow +19.9/30.0
- ARV discount +14.7/15.0
- DSCR +6.3/10.0
- 1% rule +5.9/10.0
- Rent growth +3.7/5.0
- Livability +3.6/5.0
- Condition / age +2.5/5.0
- Schools +1.5/10.0
- Appreciation +0.0/10.0
$209,900
🖨 Deal sheet 📄 Offer letter ✓ Due diligence
Listing remarks
* * HOT DEAL ALERT * * Whether you are an owner-occupant looking for a home on a serene residential street, or a savvy investor looking for your next opportunity, you won't want to miss 124 S. Evans Street in Pottstown! Priced to sell and guaranteed to impress, this historic brick twin stands directly opposite Cherry Street Park in quiet Pottstown Borough. With almost 2000 square feet of finished living space, you will find that this property is bursting with potential. Built in the late 19th century when craftsmen took pride in every brick laid, and every beam fastened, this home is a wonderful example of the period's architecture and quality. To say this home has "good bones"
Key facts
- Built 1880
- Listed 26 days
Property features AI
Finance
- Other: Above-grade finished area approximately 1,710 (source: assessor); Below-grade unfinished area approximately 548
Exterior
- Parking: On-street parking
- Utilities: Public water; Public sewer; Electric hot water; Natural gas heating
- Home design: Semi-detached property; Fee simple ownership
- Construction: Brick construction; Block foundation
- Exterior features: Full basement; Below-grade area present (unfinished); Not in a federal flood zone; Irrigation water rights
Interior
- Kitchen: Kitchen
- Bedrooms: Three bedrooms on the first upper level; One bedroom on the second upper level
- Bathrooms: One full bathroom on upper levels; One half bathroom on main level
- Heating & cooling: Natural gas heating; Electric hot water
- Interior features: Living room; Dining room; Has fireplace (1)
Neighborhood map
What this means for you Summary
Snapshot
- This is a 5-bed/1.0-bath townhouse listed at $210k.
Deal economics
- At list price, monthly cash flow is $252 ($3k/yr) — positive.
- The deal already cash-flows at list — no discount required.
- Meets the 1% rule at list price ($2k rent vs $210k).
- Recommended offer: $207k (1.5% below list) — sets the bar for market timing.
- Cap rate 7.7% vs local median 5.0% in Pottstown — top-decile yield for the area; either an underpriced asset or a hidden risk that comps aren't pricing in. Stress-test before assuming the spread holds.
Location & tenants
- Location reads 72/100 on livability (#643 in PA) — a middle-class / working-renter tenant base. Strengths: cost of living A+, housing A+, health & safety A+; Watch: amenities C-, employment D+, crime F.
- Pottstown SD (suburban): math 11% / reading 23% proficiency, ranked #504 of 539 in PA (top 94%) — low school quality limits family demand, transient renter base, plan for 1-2y turnover; 62% free/reduced lunch — lower-income household profile, screen leases tightly.
- Market conditions: Rents rising fast (+4.9%/yr); 202 active listings in the ZIP; 6 comparable units currently listed for rent nearby; rentals lingering (median 44d on market — plan ~5-8 weeks vacancy on turnover, expect pricing pressure); 67% of comp listings sitting > 30 days — soft ceiling on asking rent; solid renter incomes; 1,936 units permitted in Montgomery County in 2024 (530 in 5+ unit buildings).
- This rent runs 34% of the median local income ($80k/yr) — at the standard rent-burdened threshold; future hikes will face affordability resistance.
Forward outlook
- Local home prices are declining (-3.0%/yr); year-one equity from $1k of loan paydown is wiped out by about $6k of value loss. Plan a longer hold.
- Montgomery County population projected at +5% by 2050 — modest demand growth; plan on rents tracking national, not racing it.
Negotiation context
- It's been on market 27 days — a 2% lower offer ($207k) is reasonable based on typical stale-listing flexibility.
- 9 sale attempts since 29y ago with the ask held roughly flat each time — persistent listings suggest the price (not the market) is what's stuck; bring a comps-based counter.
- Current owner paid $65k; list at $210k implies a 223% gain — meaningful room to come down on a strong offer.
Risks & watch-outs
- Watch-outs: built in 1880 — expect roof / HVAC / electrical / plumbing capex.
- Climate carrying-cost: extreme-heat days projected 7→16/yr by 2055 (HVAC capex compounding) — expect insurance premiums to compound above CPI over the hold.
Questions for the listing agent
- Built in 1880 — when were the roof, HVAC, electrical panel, plumbing, and water heater last replaced?
- Is there a deadline driving the sale (1031 exchange, divorce, estate, relocation)? That informs how much negotiation room exists.
- Schools are B-rated — typically a magnet for longer-tenancy family renters. What's the average tenant stay here, and is there a school-zone premium baked into asking?
- Crime grade is F in this area — have there been break-ins, vandalism, or insurance claims at this property in the last 3 years? What carrier currently insures it and at what premium?
- What's the average days-on-market for RENTAL listings here right now (not sales)? A rising rental-DOM trend means longer vacancies and softer asking-rent achievability than the comps imply.
- What's the recent tenant-quality profile in this submarket — average credit score on applications, eviction rate, late-payment / NSF rate, and stable-employment percentage? A property-management company in the area should have these aggregated.
- How much new for-sale + rental construction is in the pipeline within 1–3 miles? Heavy new supply typically softens prices + rents 12–24 months out; constrained supply supports both.
Investment metrics
- 1% rule
- 1.09% ✓
- Cap rate
- 7.74%
- Cash-on-cash
- 5.15%
- DSCR
- 1.23
- GRM
- 7.6
CMA / ARV
- ARV (on-the-fly)
- $249,660
- Comps found
- 12
Show comp detail 12 sales within ~0.75 mi
| Address | Dist | Beds/Ba | Sqft | Sold | Price | $/sf | Match |
|---|---|---|---|---|---|---|---|
| 407 South St | 0.11mi | 5/2.0 | 1,850 (+8%) | 1mo | $215,000 | $116 | 77 |
| 196 E Main St | 0.30mi | 4/1.5 (-1) | 1,751 (+2%) | 9mo | $290,000 | $166 | 68 |
| 363 New St | 0.09mi | 5/1.0 | 1,472 (-14%) | 6mo | $170,000 | $115 | 68 |
| 2 Walnut St | 0.63mi | 5/1.5 | 1,744 (+2%) | 2mo | $230,000 | $132 | 64 |
| 804 Queen St | 0.62mi | 4/1.0 (-1) | 1,610 (-6%) | 3mo | $135,000 | $84 | 54 |
| 227 Industrial Hwy | 0.20mi | 4/2.5 (-1) | 1,900 (+11%) | 11mo | $363,000 | $191 | 52 |
| 13 W 2nd St | 0.73mi | 4/1.5 (-1) | 1,618 (-5%) | 2mo | $239,900 | $148 | 49 |
| 332 Oak St | 0.70mi | 4/2.0 (-1) | 1,849 (+8%) | 3mo | $192,000 | $104 | 43 |
| 414 May St | 0.64mi | 4/1.5 (-1) | 1,565 (-8%) | 9mo | $175,000 | $112 | 42 |
| 851 South St | 0.71mi | 4/1.0 (-1) | 1,550 (-9%) | 7mo | $227,000 | $146 | 41 |
| 6 E 2nd St | 0.68mi | 4/2.0 (-1) | 1,798 (+5%) | 13mo | $275,000 | $153 | 40 |
| 472 N Evans St | 0.74mi | 4/1.5 (-1) | 1,575 (-8%) | 9mo | $250,000 | $159 | 38 |
Match score weights: distance 35% · size 25% · config 20% · recency 20%. Top-matched comps best support the ARV.
Projected returns pro-forma
-3.0% appreciation · 4.93% rent growth · sell at horizon
- IRR
- -6.0%
- Equity multiple
- 0.77×
- Total profit
- $-13,314
- Equity at exit
- $31,297
- IRR
- 6.0%
- Equity multiple
- 1.49×
- Total profit
- $28,826
- Equity at exit
- $18,148
Cash invested: $58,772 (down + closing). Projections, not guarantees.
Landlord ↔ Tenant lean methodology
- Overall (STATE)
- 62 Landlord-Friendly
- State Pennsylvania
- 62 Landlord-Friendly · EVEN
- County
- — inherits STATE
- City
- — inherits STATE
ZIP-level market 19464
- Rents YoY
- 4.9%
- Active inventory
- 202
- Price-to-rent
- 7.6×
Monthly cashflow live
- Estimated rent
- $2,287 high interval (Pro) →
- Mortgage (P&I)
- −$1,101
- Tax from tax record
- −$366 /mo · $4,394/yr
- Insurance
- −$87
- HOA
- −$0
- Vacancy / Maint / Mgmt
- −$480
- Net cashflow
- $252
Break-even live
UW: 25.0% down · 7.5% · 30yr · 1.5% tax · 5.0% vac · 8.0% maint · 8.0% mgmt
Financing live
Cash to close
- Down payment
- $52,475
- Closing costs
- $6,297
- Reserves months
- —
- Total cash needed
- —
Loan-product check · same deal, 3 products live
Conventional
25% down · 7.5% · 30yr
- Down + closing
- —
- Monthly P&I
- —
- Monthly cashflow
- —
- DSCR
- —
- Eligible?
- —
Personal DTI + credit; lowest rate.
DSCR
20% down · 8.5% · 30yr
- Down + closing
- —
- Monthly P&I
- —
- Monthly cashflow
- —
- DSCR
- —
- Eligible?
- —
No personal income docs; deal must DSCR.
Hard money
10% down · 12.0% · 12mo
- Down + closing
- —
- Monthly P&I
- —
- Monthly cashflow
- —
- DSCR
- —
- Eligible?
- —
Short-term bridge; refi at stabilization.
Rent comps 6 comps
| Address | Beds | Baths | Sqft | Rent | $/sqft | DOM | Units | Dist |
|---|---|---|---|---|---|---|---|---|
| 308 King St Unit 2 Pottstown, PA | 4.0 | 2.0 | 1958 | $2,100 | $1.07 | 43d | 1 | 0.22mi |
| 351 Union Aly Pottstown, PA | 4.0 | 1.5 | 1408 | $1,995 | $1.42 | 2d | 1 | 0.39mi |
| 365 Beech St Pottstown, PA | 4.0 | 1.0 | 1670 | $2,200 | $1.32 | 43d | 1 | 0.43mi |
| 310 N Charlotte St Pottstown, PA | 4.0 | 1.5 | 1990 | $2,100 | $1.06 | 43d | 1 | 0.55mi |
| 21 Walnut St Pottstown, PA | 4.0 | 2.0 | 1791 | $2,200 | $1.23 | 5d | 1 | 0.60mi |
| 463 Spruce St Pottstown, PA | 4.0 | 1.5 | 1574 | $2,250 | $1.43 | 43d | 1 | 0.76mi |
Listing history 36 events
-
2026-06-18days on market $209,900 Active 27 DOM
-
2026-06-17days on market $209,900 Active 26 DOM
-
2026-06-16days on market $209,900 Active 25 DOM
-
2026-06-15days on market $209,900 Active 24 DOM
-
2026-06-13days on market $209,900 Active 22 DOM
-
2026-06-13days on market $209,900 Active 21 DOM
-
2026-06-09days on market $209,900 Active 18 DOM
-
2026-06-08days on market $209,900 Active 17 DOM
-
2026-06-07days on market $209,900 Active 16 DOM
-
2026-06-04days on market $209,900 Active 13 DOM
-
2026-06-03days on market $209,900 Active 12 DOM
-
2026-06-02days on market $209,900 Active 11 DOM
-
2026-06-01days on market $209,900 Active 10 DOM
-
2026-05-31days on market $209,900 Active 9 DOM
-
2026-05-23$209,900 Active
-
2026-05-20historical $209,900
-
2021-06-23historical
-
2021-06-07status Active
-
2021-03-26status Pending
-
2021-03-26price $124,900
-
2021-03-14historical Active Under Contract
-
2021-02-28$114,900 Active
-
2009-06-01historical
-
2008-08-04$114,000
-
2008-07-31historical
-
2008-03-16$124,900
-
2006-11-15soldstatus $65,000
-
2006-09-15$65,000
-
1999-02-10soldstatus $70,000
-
1999-01-29soldstatus $70,000
-
1998-05-22$70,000
-
1998-03-31historical
-
1997-10-07$75,000
-
1997-08-31historical
-
1997-02-27$74,900
-
1995-02-14soldstatus $34,500
ⓘ Source: listings_history table (triggers on properties + properties_extension) + one-shot
backfill from property_details.listing_events for pre-trigger history.
Tax reassessment forecast PA · Partial reset (capped growth)
- Current annual tax
- $4,394 · $366/mo
- Projected year-2 tax
- $4,394 · $366/mo
- Expected delta
- $0/yr ($0/mo · 0.0%)
ⓘ Screening estimate from a state-policy table — verify with the county assessor before closing.
Climate risk First Street
- Flood 3/10 Moderate FEMA zone X (unshaded) · 12% chance over 30 yrs
- Wildfire 1/10 Low
- Heat 6/10 Major 7 d/yr ≥101°F today · 16 d/yr by 30 yrs out
- Wind 4/10 Moderate 20% chance of damaging wind over 30 yrs
- Air quality 2/10 Low 1 unhealthy d/yr today · 3 by 30 yrs out
Nearby sold comps map
Loading sold comps map…
Walkable amenities ~0.75 mi
Loading nearby amenities…
Taxation est. · year 1
- Rental income
- $27,445
- − Mortgage interest
- −$11,758
- − Property taxes
- −$4,394
- − Insurance
- −$1,050
- − Repairs & maintenance
- −$2,196
- − Management
- −$2,196
- − Depreciation
- −$6,106
- Taxable loss
- −$254
- Est. tax savings @ 24.0%
- +$61
- After-tax cash flow
- $3,090/yr
For passive investors: Depreciation is non-cash, so a rental often shows a tax loss while cash-flowing — sheltering income. Rental losses are passive: they offset passive income freely, and up to $25,000/yr can offset ordinary (W-2) income if you actively participate and your MAGI is under $100k (phasing out to $0 by $150k); unused losses carry forward. On sale, claimed depreciation is recaptured at up to 25%, and gains may owe capital-gains tax (a 1031 exchange can defer both). Figures are a year-1 estimate at your 24.0% rate — not tax advice; consult a CPA.
Schools (NCES district)
- District
- Pottstown SD
- NCES district ID
- 4219680
- Math proficiency
- 11% ▼ -12.00%
- Reading proficiency
- 23% ▼ -19.00%
- Median HH income
- $43,739
- Composite
- 14.78/100
- National rank
- #9390
- State rank
- #504 of 539 in PA
Livability — Pottstown
- Score
- 72/100
- State rank
- #643
- US rank
- #6257
Category grades
Schools grade is shown separately in the Schools card above.
Census & demographics
- Census place
- Pottstown, PA
- County
- Montgomery County · 712,331 people
- City population
- 49,101
- Metro
- Philadelphia-Camden-Wilmington, PA-NJ-DE-MD
- Population (ZIP)
- 49,101
- Household income
- $79,787
- Rent vs Own
- Severe rent burden
- 1797.0
Population outlook (Montgomery County) Hauer SSP2
- Today (2025)
- 856,074 people
- By 2030
- 870,887 · +1.7%
- By 2040
- 891,195 · +4.1%
- By 2050
- 896,417 · +4.7%
- By 2075
- 903,212 · +5.5%
- By 2100
- 843,240 · -1.5%
Race, ethnicity, and origin ACS 2023
- Neighborhood character
- Predominantly White (69%)
- Race & ethnicity
- White 69% Black 15% Two or more races 9% Hispanic / Latino 9% Asian 2%
- Hispanic origin (detail)
- Mexican 2% Puerto Rican 5%
- Common ancestry
- Romanian 7% Polish 2% Iranian 2%
- Foreign-born
- 6% · Canada, China
- Languages at home
- 92% English-only · Spanish 4% Arabic 1% Other Indo-European 1%
Political lean MEDSL · Montgomery
- 2024 margin
- Strong D (+22.8) · D 60.9% · R 38.1% · Other 1.1%
- 2008→2024 swing
- +2.0pp toward D · 2008: 20.8pp · 2024: 22.8pp
- All cycles
- 2024: D+22.8 2020: D+26.3 2016: D+21.1 2012: D+14.3 2008: D+20.8
Not yet ingested
- Civics
- —
Market trends
- HPI YoY
- ▼ -253.73%
- Current HPI
- 271.9399
- Rent YoY
- ▲ 4.93%
- Metro
- Philadelphia-Camden-Wilmington, PA-NJ-DE-MD
- State GDP YoY
- ▲ 1.68%
- F500 in state
- 34
Industry mix (Fortune 500 HQ in PA)
| Industry | F500 HQs | Revenue |
|---|---|---|
| Healthcare | 2 | $309B |
|
||
| Insurance | 2 | $27B |
|
||
| Telecommunications / Media | 1 | $124B |
|
||
| Industrial Distribution | 1 | $22B |
|
||
| Financial Services | 1 | $20B |
|
||
| Chemicals / Materials | 1 | $18B |
|
||
Price history
+508.4% since first listed22 events — show timeline
- 2026-05-23 Listed $209,900 BRIGHT MLS
- 2026-05-20 Coming Soon $209,900 BRIGHT MLS
- 2021-06-23 Listing Removed — BRIGHT MLS
- 2021-06-07 Relisted — BRIGHT MLS
- 2021-03-26 Pending — BRIGHT MLS
- 2021-03-26 Price Changed $124,900 BRIGHT MLS
- 2021-03-14 Contingent — BRIGHT MLS
- 2021-02-28 Listed $114,900 BRIGHT MLS
- 2009-06-01 Listing Removed — BRIGHT MLS
- 2008-08-04 Listed $114,000 BRIGHT MLS
- 2008-07-31 Listing Removed — BRIGHT MLS
- 2008-03-16 Listed $124,900 BRIGHT MLS
- 2006-11-15 Sold (MLS) $65,000 BRIGHT MLS
- 2006-09-15 Listed $65,000 BRIGHT MLS
- 1999-02-10 Sold (Public Records) $70,000 Public Records
- 1999-01-29 Sold (MLS) $70,000 BRIGHT MLS
- 1998-05-22 Listed $70,000 BRIGHT MLS
- 1998-03-31 Listing Removed — BRIGHT MLS
- 1997-10-07 Listed $75,000 BRIGHT MLS
- 1997-08-31 Listing Removed — BRIGHT MLS
- 1997-02-27 Listed $74,900 BRIGHT MLS
- 1995-02-14 Sold (Public Records) $34,500 Public Records
Property tax history
+2.1%/yrLatest (2026): $4,394 · +5.1% YoY. Source: county tax records.
Cash-flow waterfall
monthlySold comps — $/sqft
last 12 mo · ≤1 miLoading sold comps…