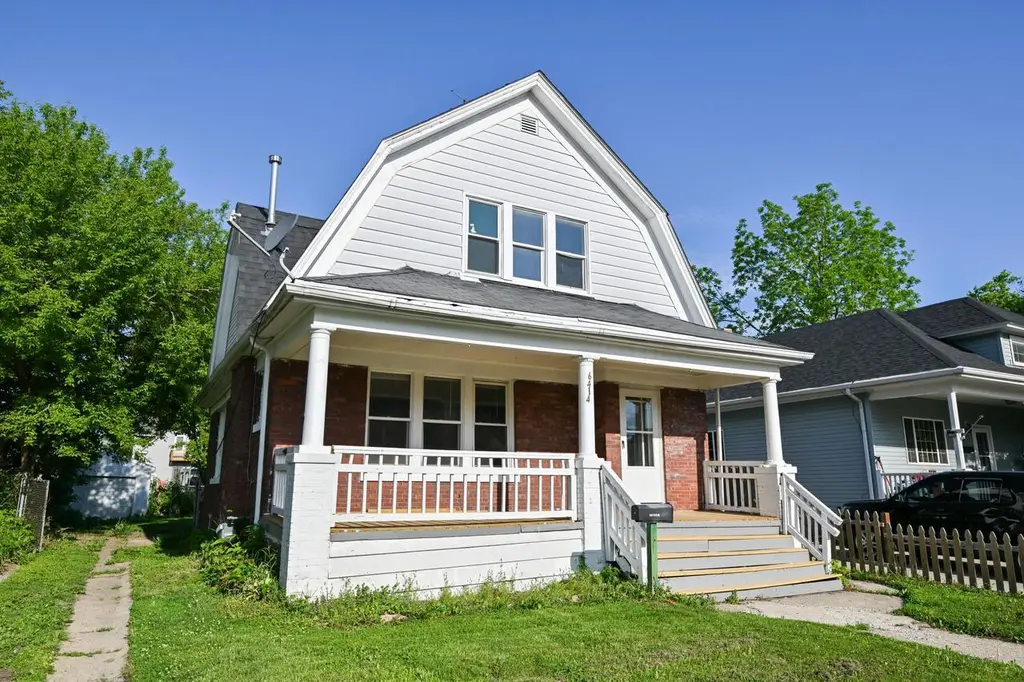
6411 26th Ave · Kenosha, WI
Flood risk No data
- FEMA flood zone
- —
- Chance of flooding over 30 yrs
- —
- Est. flood insurance / yr
- —
Fire risk No data
- Est. fire insurance / yr
- —
Heat risk No data
- Hot days now (above threshold)
- —
- Hot days in 30 yrs
- —
Wind risk No data
- Chance of severe wind over 30 yrs
- —
Air-quality risk No data
- Unhealthy air days now
- —
- Unhealthy air days in 30 yrs
- —
Risk factors via First Street. Map © Google.
Why this score? — see what drove the C+ grade
The composite is a weighted blend of 9 inputs, each scored 0–100. Each bar is that input's sub-score; the figure is the points it added to the 100-point composite (weight × sub-score).
- Cash flow +21.6/30.0
- ARV discount +15.0/15.0
- DSCR +6.9/10.0
- 1% rule +5.7/10.0
- Livability +4.2/5.0
- Condition / age +3.8/5.0
- Rent growth +2.5/5.0
- Schools +2.5/10.0
- Appreciation +0.0/10.0
$190,000
🖨 Deal sheet 📄 Offer letter ✓ Due diligence
Listing remarks
Great rental property. Beautiful wood floors, woodwork and stairway offer character. Large living room and dining room. 3 bedrooms with walk-in closets. Updated full bath upstairs. Half bath off the kitchen on the first floor. Current kitchen appliances included in the sale. A front porch to relax on, a fenced in yard and single car garage.
Key facts
- Stairway
- Woodwork
- Wood floors
Tags
Property features AI
Exterior
- Parking: Detached 1-car garage
- Utilities: Municipal water; Municipal sewer; Natural gas
- Home design: Single-family, 2-story; Estimated living area in the 1501–1750 sq ft range
- Construction: Exterior of brick, brick/stone and wood; Basement: full, block
- Exterior features: Fenced yard; Sidewalks
Interior
- Kitchen: Kitchen on main level — approx. 11 x 11; Dishwasher; Oven; Range; Refrigerator
- Bedrooms: Master bedroom (Upper) — approx. 15 x 11; Bedroom 2 (Upper) — approx. 11 x 9; Bedroom 3 (Upper) — approx. 11 x 9
- Flooring: Wood floors
- Bathrooms: One full bath with shower stall; One half bath
- Heating & cooling: Radiant / hot water heating; Natural gas fuel
- Interior features: Pantry; Walk-in closets; Wood floors; Full basement with block construction
Neighborhood map
What this means for you Summary
Snapshot
- This is a 3-bed/1.5-bath single-family listed at $190k. Condition is rated good.
Deal economics
- At list price, monthly cash flow is $289 ($3k/yr) — positive.
- The deal already cash-flows at list — no discount required.
- Meets the 1% rule at list price ($2k rent vs $190k).
- Recommended offer: $187k (1.5% below list) — sets the bar for market timing.
- Cap rate 8.1% vs local median 4.0% in Kenosha — top-decile yield for the area; either an underpriced asset or a hidden risk that comps aren't pricing in. Stress-test before assuming the spread holds.
Location & tenants
- Location reads 84/100 on livability (#31 in WI, #680 nationally) — a professional / high-income tenant draw. Strengths: commute A+, cost of living A+, housing A+; Watch: employment C-, schools D+.
- Kenosha School District (suburban): math 26% / reading 31% proficiency, ranked #287 of 342 in WI (top 84%) — low school quality limits family demand, transient renter base, plan for 1-2y turnover.
- Market conditions: 35 active listings in the ZIP; 16 comparable units currently listed for rent nearby; rentals at typical pace (median 19d on market — plan ~3-4 weeks tenant-placement turnaround); 259 units permitted in Kenosha County in 2024 (8 in 5+ unit buildings).
- This rent runs 36% of the median local income ($68k/yr) — at the standard rent-burdened threshold; future hikes will face affordability resistance.
Forward outlook
- Local home prices are declining (-3.0%/yr); year-one equity from $1k of loan paydown is wiped out by about $6k of value loss. Plan a longer hold.
Negotiation context
- It's been on market 16 days — a 2% lower offer ($187k) is reasonable based on typical stale-listing flexibility.
Risks & watch-outs
- Watch-outs: built in 1916 — expect roof / HVAC / electrical / plumbing capex.
Questions for the listing agent
- Built in 1916 — when were the roof, HVAC, electrical panel, plumbing, and water heater last replaced?
- Is there a deadline driving the sale (1031 exchange, divorce, estate, relocation)? That informs how much negotiation room exists.
- Schools are D-rated, which usually means shorter tenancies and higher turnover. Who's the typical renter profile here, and what's been the actual vacancy rate?
- What's the average days-on-market for RENTAL listings here right now (not sales)? A rising rental-DOM trend means longer vacancies and softer asking-rent achievability than the comps imply.
- What's the recent tenant-quality profile in this submarket — average credit score on applications, eviction rate, late-payment / NSF rate, and stable-employment percentage? A property-management company in the area should have these aggregated.
- How much new for-sale + rental construction is in the pipeline within 1–3 miles? Heavy new supply typically softens prices + rents 12–24 months out; constrained supply supports both.
Investment metrics
- 1% rule
- 1.07% ✓
- Cap rate
- 8.12%
- Cash-on-cash
- 6.52%
- DSCR
- 1.29
- GRM
- 7.8
CMA / ARV
- ARV (on-the-fly)
- $291,648
- Comps found
- 12
Show comp detail 12 sales within ~0.75 mi
| Address | Dist | Beds/Ba | Sqft | Sold | Price | $/sf | Match |
|---|---|---|---|---|---|---|---|
| 2612 64th St | 0.03mi | 4/2.0 (+1) | 1,646 (+5%) | 1mo | $200,000 | $122 | 83 |
| 6609 24th Ave | 0.19mi | 3/2.0 | 1,636 (+4%) | 2mo | $265,000 | $162 | 80 |
| 6606 21st Ave | 0.31mi | 3/2.0 | 1,560 (-0%) | 3mo | $195,000 | $125 | 80 |
| 6720 31st Ave | 0.40mi | 3/1.0 | 1,467 (-6%) | 2mo | $272,500 | $186 | 67 |
| 6320 25th Ave | 0.09mi | 4/1.0 (+1) | 1,375 (-12%) | 2mo | $183,000 | $133 | 67 |
| 6612 30th Ave | 0.29mi | 3/1.5 | 1,340 (-14%) | 0mo | $275,000 | $205 | 62 |
| 5422 22nd Ave | 0.70mi | 3/2.5 | 1,584 (+1%) | 1mo | $312,000 | $197 | 61 |
| 6053 37th Ave | 0.67mi | 3/2.0 | 1,486 (-5%) | 2mo | $156,000 | $105 | 56 |
| 6517 20th Ave | 0.38mi | 4/2.0 (+1) | 1,414 (-10%) | 4mo | $265,000 | $187 | 55 |
| 5807 22nd Ave | 0.48mi | 3/2.0 | 1,343 (-14%) | 0mo | $257,000 | $191 | 51 |
| 6630 37th Ave | 0.68mi | 3/1.5 | 1,370 (-13%) | 4mo | $265,000 | $193 | 44 |
| 2101 74th St | 0.67mi | 3/1.0 | 1,344 (-14%) | 0mo | $210,000 | $156 | 43 |
Match score weights: distance 35% · size 25% · config 20% · recency 20%. Top-matched comps best support the ARV.
Projected returns pro-forma
-3.0% appreciation · 3.0% rent growth · sell at horizon
- IRR
- -6.3%
- Equity multiple
- 0.77×
- Total profit
- $-12,340
- Equity at exit
- $28,330
- IRR
- 3.4%
- Equity multiple
- 1.25×
- Total profit
- $13,095
- Equity at exit
- $16,428
Cash invested: $53,200 (down + closing). Projections, not guarantees.
Landlord ↔ Tenant lean methodology
- Overall (STATE)
- 73 Landlord-Friendly
- State Wisconsin
- 73 Landlord-Friendly · R+2
- County
- — inherits STATE
- City
- — inherits STATE
ZIP-level market 53143
- Active inventory
- 35
- Price-to-rent
- 7.8×
Monthly cashflow live
- Estimated rent
- $2,028 high interval (Pro) →
- Mortgage (P&I)
- −$996
- Tax est. 1.5%
- −$238 /mo · $2,850/yr
- Insurance
- −$79
- HOA
- −$0
- Vacancy / Maint / Mgmt
- −$426
- Net cashflow
- $289
Break-even live
UW: 25.0% down · 7.5% · 30yr · 1.5% tax · 5.0% vac · 8.0% maint · 8.0% mgmt
Financing live
Cash to close
- Down payment
- $47,500
- Closing costs
- $5,700
- Reserves months
- —
- Total cash needed
- —
Loan-product check · same deal, 3 products live
Conventional
25% down · 7.5% · 30yr
- Down + closing
- —
- Monthly P&I
- —
- Monthly cashflow
- —
- DSCR
- —
- Eligible?
- —
Personal DTI + credit; lowest rate.
DSCR
20% down · 8.5% · 30yr
- Down + closing
- —
- Monthly P&I
- —
- Monthly cashflow
- —
- DSCR
- —
- Eligible?
- —
No personal income docs; deal must DSCR.
Hard money
10% down · 12.0% · 12mo
- Down + closing
- —
- Monthly P&I
- —
- Monthly cashflow
- —
- DSCR
- —
- Eligible?
- —
Short-term bridge; refi at stabilization.
Rent comps 16 comps
| Address | Beds | Baths | Sqft | Rent | $/sqft | DOM | Units | Dist |
|---|---|---|---|---|---|---|---|---|
| 1809 60th St Kenosha, WI | 3.0 | 1.0 | 1100 | $1,500 | $1.36 | 43d | 1 | 0.53mi |
| 5807 20th Ave Unit 2 Kenosha, WI | 3.0 | 1.0 | 1064 | $2,400 | $2.26 | 18d | 1 | 0.53mi |
| 5807 20th Ave Unit 1 Kenosha, WI | 2.0 | 1.0 | 1064 | $2,000 | $1.88 | 18d | 1 | 0.53mi |
| 5432 23rd Ave Kenosha, WI | 4.0 | 2.0 | 1400 | $1,695 | $1.21 | 3d | 1 | 0.65mi |
| 1510 57th St Unit 2 Kenosha, WI | 4.0 | 2.0 | 1700 | $1,800 | $1.06 | 43d | 1 | 0.76mi |
| 7733 37th Ave Kenosha, WI | 2.0 | 1.0 | 1200 | $2,000 | $1.67 | 12d | 1 | 1.11mi |
| 7719 15th Ave Kenosha, WI | 4.0 | 2.0 | 1898 | $2,599 | $1.37 | 18d | 1 | 1.12mi |
| 2708 48th St Kenosha, WI | 4.0 | 2.0 | 1200 | $2,500 | $2.08 | 21d | 1 | 1.18mi |
| 5522 7th Ave Kenosha, WI | 2.0 | 1.0–2.0 | 858 | $2,660 | $3.10 | 2d | 60 | 1.18mi |
| 5945 6th Ave Kenosha, WI | 2.0 | 1.0–2.0 | 800 | $2,575 | $3.22 | 1d | 13 | 1.21mi |
| 5900 4th Ave Unit 309 Kenosha, WI | 2.0 | 2.0 | 1083 | $1,895 | $1.75 | 19d | 1 | 1.28mi |
| 5900 4th Ave Unit 212 Kenosha, WI | 2.0 | 2.0 | 1224 | $1,999 | $1.63 | 43d | 1 | 1.28mi |
| 5900 4th Ave Unit 509 Kenosha, WI | 2.0 | 2.0 | 1083 | $2,035 | $1.88 | 24d | 1 | 1.28mi |
| 5900 4th Ave Unit 512 Kenosha, WI | 2.0 | 2.0 | 1224 | $2,495 | $2.04 | 19d | 1 | 1.28mi |
| 5900 4th Ave Unit 217 Kenosha, WI | 2.0 | 2.0 | 1083 | $2,195 | $2.03 | 18d | 1 | 1.28mi |
| 5900 4th Ave Apt 414 Kenosha, WI | 2.0 | 2.0 | 1160 | $2,675 | $2.31 | 12d | 1 | 1.28mi |
Listing history 11 events
-
2026-06-18days on market $190,000 Active 16 DOM
-
2026-06-17days on market $190,000 Active 15 DOM
-
2026-06-16days on market $190,000 Active 14 DOM
-
2026-06-15days on market $190,000 Active 13 DOM
-
2026-06-13days on market $190,000 Active 11 DOM
-
2026-06-09days on market $190,000 Active 7 DOM
-
2026-06-08days on market $190,000 Active 6 DOM
-
2026-06-07days on market $190,000 Active 5 DOM
-
2026-06-04days on market $190,000 Active 2 DOM
-
2026-06-02remarks 342-char remark
-
2026-06-02$190,000 Active 1 DOM
ⓘ Source: listings_history table (triggers on properties + properties_extension) + one-shot
backfill from property_details.listing_events for pre-trigger history.
Nearby sold comps map
Loading sold comps map…
Walkable amenities ~0.75 mi
Loading nearby amenities…
Taxation est. · year 1
- Rental income
- $24,338
- − Mortgage interest
- −$10,643
- − Property taxes
- −$2,850
- − Insurance
- −$950
- − Repairs & maintenance
- −$1,947
- − Management
- −$1,947
- − Depreciation
- −$5,527
- Taxable income
- $473
- Est. tax owed @ 24.0%
- −$114
- After-tax cash flow
- $3,357/yr
For passive investors: Depreciation is non-cash, so a rental often shows a tax loss while cash-flowing — sheltering income. Rental losses are passive: they offset passive income freely, and up to $25,000/yr can offset ordinary (W-2) income if you actively participate and your MAGI is under $100k (phasing out to $0 by $150k); unused losses carry forward. On sale, claimed depreciation is recaptured at up to 25%, and gains may owe capital-gains tax (a 1031 exchange can defer both). Figures are a year-1 estimate at your 24.0% rate — not tax advice; consult a CPA.
Condition & rehab AI · 12 photos
This single-family home is in good condition with updated kitchen and bathrooms, and a well-maintained exterior. It's a great rental property with potential for further cosmetic upgrades to enhance its curb appeal and value.
Value-add opportunities
- Both Paint exterior trim — Enhances curb appeal and value
- Both Clean gutters — Improves drainage and property value
Renovation cost estimate screening
Value-add ROI direction
- Both Paint exterior trim — Enhances curb appeal and value ↑
- Both Clean gutters — Improves drainage and property value ↑
ⓘ Cost ranges are severity-bucket heuristics (US national rule-of-thumb). Get contractor quotes + a written scope before underwriting a rehab budget.
Schools (NCES district)
- District
- Kenosha School District
- NCES district ID
- 5507320
- Math proficiency
- 26% ▼ -9.00%
- Reading proficiency
- 31% ▼ -6.00%
- Median HH income
- $52,407
- Composite
- 25.17/100
- National rank
- #7516
- State rank
- #287 of 342 in WI
Livability — Kenosha
- Score
- 84/100
- State rank
- #31
- US rank
- #680
Category grades
Schools grade is shown separately in the Schools card above.
Census & demographics
- Census place
- Kenosha, WI
- County
- Kenosha County · 130,343 people
- City population
- 85,271
- Metro
- Chicago-Naperville-Elgin, IL-IN-WI
- Population (ZIP)
- 20,889
- Household income
- $68,343
- Rent vs Own
- Severe rent burden
- 813.0
Population outlook (Kenosha County) Hauer SSP2
- Today (2025)
- 174,032 people
- By 2030
- 174,923 · +0.5%
- By 2040
- 173,895 · -0.1%
- By 2050
- 170,102 · -2.3%
- By 2075
- 162,952 · -6.4%
- By 2100
- 154,781 · -11.1%
Race, ethnicity, and origin ACS 2023
- Neighborhood character
- Diverse neighborhood (Simpson 0.59)
- Race & ethnicity
- White 59% Hispanic / Latino 21% Two or more races 18% Black 11% Asian 1%
- Hispanic origin (detail)
- Mexican 16% Puerto Rican 2%
- Common ancestry
- Romanian 6% Portuguese 5% Lithuanian 2%
- Foreign-born
- 6% · Canada, China
- Languages at home
- 89% English-only · Spanish 10% Chinese 1%
Political lean MEDSL · Kenosha
- 2024 margin
- Lean R (+6.2) · D 46.2% · R 52.5% · Other 1.3%
- 2008→2024 swing
- -24.3pp toward R · 2008: 18.1pp · 2024: -6.2pp
- All cycles
- 2024: R+6.2 2020: R+3.1 2016: R+0.3 2012: D+12.3 2008: D+18.1
Not yet ingested
- Civics
- —
Market trends
- HPI YoY
- ▼ -220.75%
- Current HPI
- 229.2067
- Rent YoY
- —
- Metro
- Chicago-Naperville-Elgin, IL-IN-WI
- State GDP YoY
- ▲ 2.10%
- F500 in state
- 20
Industry mix (Fortune 500 HQ in WI)
| Industry | F500 HQs | Revenue |
|---|---|---|
| Industrial Machinery | 4 | $23B |
|
||
| Industrial Technology | 2 | $36B |
|
||
| Insurance | 1 | $36B |
|
||
| Professional Services | 1 | $19B |
|
||
| Utilities | 1 | $9B |
|
||
| Consumer Goods | 1 | $3B |
|
||
Price history
1 event — show timeline
- 2026-06-02 Listed $190,000 METROMLS
Cash-flow waterfall
monthlySold comps — $/sqft
last 12 mo · ≤1 miLoading sold comps…