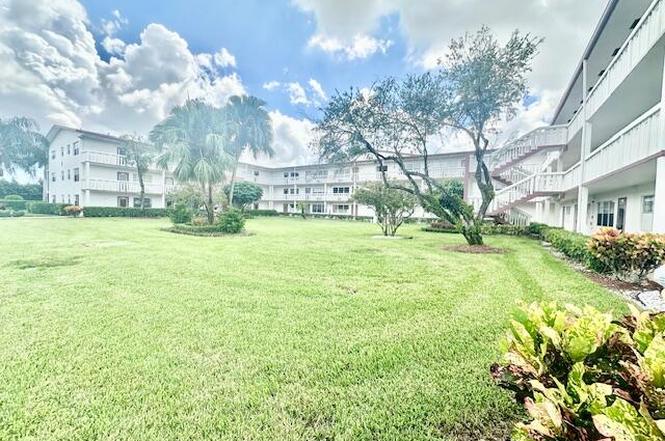
583 Fanshaw Unit N · Boca Raton, FL
Flood risk No data
- FEMA flood zone
- —
- Chance of flooding over 30 yrs
- %
- Est. flood insurance / yr
- —
Fire risk No data
- Est. fire insurance / yr
- —
Heat risk No data
- Hot days now (above °F)
- days/yr
- Hot days in 30 yrs
- days/yr
Wind risk No data
- Chance of severe wind over 30 yrs
- %
Air-quality risk No data
- Unhealthy air days now
- days/yr
- Unhealthy air days in 30 yrs
- days/yr
Risk factors via First Street. Map © Google.
Why this score? — see what drove the B grade
The composite is a weighted blend of 9 inputs, each scored 0–100. Each bar is that input's sub-score; the figure is the points it added to the 100-point composite (weight × sub-score).
- Cash flow +30.0/30.0
- 1% rule +10.0/10.0
- DSCR +10.0/10.0
- ARV discount +7.5/15.0
- Schools +4.3/10.0
- Livability +3.9/5.0
- Rent growth +3.0/5.0
- Condition / age +2.5/5.0
- Appreciation +0.0/10.0
$80,000
🖨 Deal sheet 📄 Offer letter ✓ Due diligence
Listing remarks
Stunning 3rd-floor 1/1.5 penthouse with panoramic lake views, featuring an updated kitchen, wood-look flooring, and a serene screened patio. Amenities include internet and WIFI, Century Village is like living in a resort, fitness center, live shows, movies, buses, classes, bingo, card rooms, trips, tennis, pickelball, close to shopping and restaurants, come see and then check out the clubhouse to see it for yourself. Per the association this is a 55 plus community!!!
Key facts
- Screened patio
- Fitness center
- Clubhouse
Tags
Neighborhood map
What this means for you Summary
Snapshot
- This is a 1-bed/1.5-bath condo listed at $80k.
Deal economics
- At list price, monthly cash flow is $392 ($5k/yr) — positive.
- The deal already cash-flows at list — no discount required.
- Meets the 1% rule at list price ($2k rent vs $80k).
- Recommended offer: $70k (12.0% below list) — sets the bar for market timing.
- Cap rate 12.2% vs local median 2.8% in Boca Raton — top-decile yield for the area; either an underpriced asset or a hidden risk that comps aren't pricing in. Stress-test before assuming the spread holds.
Location & tenants
- Location reads 77/100 on livability (#192 in FL, #3,070 nationally) — a middle-class / working-renter tenant base. Strengths: schools A+, employment A+, health & safety A+; Watch: amenities D, cost of living F.
- Palm Beach (suburban): math 46% / reading 53% proficiency, ranked #34 of 73 in FL (top 47%) — families likely to look elsewhere, expect single-tenant / working-renter base with shorter leases.
- Market conditions: Rents rising (+1.8%/yr); 418 active listings in the ZIP; 39 comparable units currently listed for rent nearby; rentals at typical pace (median 24d on market — plan ~3-4 weeks tenant-placement turnaround); solid renter incomes; 3,974 units permitted in Palm Beach County in 2024 (1,012 in 5+ unit buildings).
Forward outlook
- Local home prices are declining (-3.0%/yr); year-one equity from $553 of loan paydown is wiped out by about $2k of value loss. Plan a longer hold.
- Palm Beach County population projected at +30% by 2050 — long-run rental-demand tailwind backs the buy-and-hold thesis.
- At projected returns (-3.0% appreciation + 1.8% rent growth), your $22k cash investment doubles in ~7 years — after that, you're playing with house money.
Negotiation context
- It's been on market 259 days — a 12% lower offer ($70k) is reasonable based on typical stale-listing flexibility.
Risks & watch-outs
- Watch-outs: HOA is 23% of rent.
Questions for the listing agent
- It's been on market 259 days. Have you received any prior offers? Is the seller open to a 12% concession, seller financing, or rate buy-down credit?
- What does the HOA fee cover, when was the last increase, and are there any pending special assessments or reserve-fund shortfalls?
- Any open or pending special assessments — roof, HVAC, plumbing, elevator, façade? What's the per-unit balance and payoff schedule, and is the seller paying it off at close or rolling it to the buyer?
- Why hasn't it sold? Are there any deal-killer items the seller is aware of (foundation, flood, title, zoning, code violations)?
- Is there a deadline driving the sale (1031 exchange, divorce, estate, relocation)? That informs how much negotiation room exists.
- Schools are A-rated — typically a magnet for longer-tenancy family renters. What's the average tenant stay here, and is there a school-zone premium baked into asking?
- What's the average days-on-market for RENTAL listings here right now (not sales)? A rising rental-DOM trend means longer vacancies and softer asking-rent achievability than the comps imply.
- What's the recent tenant-quality profile in this submarket — average credit score on applications, eviction rate, late-payment / NSF rate, and stable-employment percentage? A property-management company in the area should have these aggregated.
- How much new apartment / multifamily construction is in the pipeline within 1–3 miles? Heavy new supply (>2% of stock underway) typically softens rents 12–24 months out; light construction supports rent growth.
Investment metrics
- 1% rule
- 2.11% ✓
- Cap rate
- 12.17%
- Cash-on-cash
- 20.99%
- DSCR
- 1.93
- GRM
- 4.0
CMA / ARV
No comps found within radius.
Projected returns pro-forma
-3.0% appreciation · 1.81% rent growth · sell at horizon
- IRR
- 11.8%
- Equity multiple
- 1.46×
- Total profit
- $10,262
- Equity at exit
- $11,928
- IRR
- 19.5%
- Equity multiple
- 2.52×
- Total profit
- $34,149
- Equity at exit
- $6,917
Cash invested: $22,400 (down + closing). Projections, not guarantees.
Landlord ↔ Tenant lean methodology
- Overall (STATE)
- 87 Strongly Landlord-Friendly
- State Florida
- 87 Strongly Landlord-Friendly · R+3
- County
- — inherits STATE
- City
- — inherits STATE
ZIP-level market 33434
- Rents YoY
- 1.8%
- Active inventory
- 418
- Price-to-rent
- 4.0×
Monthly cashflow live
- Estimated rent
- $1,686 high interval (Pro) →
- Mortgage (P&I)
- −$420
- Tax est. 1.5%
- −$100 /mo · $1,200/yr
- Insurance
- −$33
- HOA
- −$387
- Vacancy / Maint / Mgmt
- −$354
- Net cashflow
- $392
Break-even live
UW: 25.0% down · 7.5% · 30yr · 1.5% tax · 5.0% vac · 8.0% maint · 8.0% mgmt
Financing live
Cash to close
- Down payment
- $20,000
- Closing costs
- $2,400
- Reserves months
- —
- Total cash needed
- —
Loan-product check · same deal, 3 products live
Conventional
25% down · 7.5% · 30yr
- Down + closing
- —
- Monthly P&I
- —
- Monthly cashflow
- —
- DSCR
- —
- Eligible?
- —
Personal DTI + credit; lowest rate.
DSCR
20% down · 8.5% · 30yr
- Down + closing
- —
- Monthly P&I
- —
- Monthly cashflow
- —
- DSCR
- —
- Eligible?
- —
No personal income docs; deal must DSCR.
Hard money
10% down · 12.0% · 12mo
- Down + closing
- —
- Monthly P&I
- —
- Monthly cashflow
- —
- DSCR
- —
- Eligible?
- —
Short-term bridge; refi at stabilization.
Rent comps 39 comps
| Address | Beds | Baths | Sqft | Rent | $/sqft | DOM | Units | Dist |
|---|---|---|---|---|---|---|---|---|
| 119 Fanshaw C Unit 119 Boca Raton, FL | 1.0 | 1.0 | 585 | $1,299 | $2.22 | 24d | 1 | 0.03mi |
| 147 Fanshaw D Boca Raton, FL | 1.0 | 1.0 | 601 | $1,350 | $2.25 | 24d | 1 | 0.03mi |
| 454 Fanshaw K Unit K Boca Raton, FL | 1.0 | 1.5 | 715 | $1,500 | $2.10 | 15d | 1 | 0.05mi |
| 96 Fanshaw C Boca Raton, FL | 1.0 | 1.5 | 702 | $1,650 | $2.35 | 15d | 1 | 0.05mi |
| 8 Fanshaw Dr Unit 8 Boca Raton, FL | 1.0 | 1.0 | 585 | $1,300 | $2.22 | 7d | 1 | 0.19mi |
| 82 Fanshaw Dr Unit 82 Boca Raton, FL | 1.0 | 1.5 | 702 | $1,250 | $1.78 | 24d | 1 | 0.27mi |
| 4014 Newcastle A Unit A Boca Raton, FL | 1.0 | 1.5 | 738 | $1,495 | $2.03 | 24d | 1 | 0.35mi |
| 3031 Cornwall B Boca Raton, FL | 1.0 | 1.5 | 738 | $1,550 | $2.10 | 24d | 1 | 0.42mi |
| 4008 Cornwall a Boca Raton, FL | 1.0 | 1.5 | 738 | $1,600 | $2.17 | 24d | 1 | 0.43mi |
| 86 Mansfield C Unit C Boca Raton, FL | 1.0 | 1.5 | 720 | $1,700 | $2.36 | 11d | 1 | 0.43mi |
| 534 Mansfield M #534 Boca Raton, FL | 1.0 | 1.5 | 715 | $1,300 | $1.82 | 24d | 1 | 0.43mi |
| 3014 Cornwall a Boca Raton, FL | 1.0 | 1.5 | 738 | $1,650 | $2.24 | 1d | 1 | 0.45mi |
| 2052 Cornwall Dr Unit 2052 Boca Raton, FL | 1.0 | 1.5 | 738 | $3,150 | $4.27 | 24d | 1 | 0.45mi |
| 3014 Cornwall a Boca Raton, FL | 1.0 | 1.5 | 738 | $1,775 | $2.41 | 2d | 1 | 0.45mi |
| 3070 Cornwall D Boca Raton, FL | 1.0 | 1.5 | 738 | $3,200 | $4.34 | 24d | 1 | 0.45mi |
| 321 Dorset Dr Boca Raton, FL | 1.0 | 1.5 | 720 | $1,590 | $2.21 | 24d | 1 | 0.47mi |
| 4074 Cornwall D Boca Raton, FL | 1.0 | 1.5 | 738 | $1,450 | $1.96 | 24d | 1 | 0.48mi |
| 119 Dorset Dr Unit 119 Boca Raton, FL | 1.0 | 1.0 | 600 | $1,400 | $2.33 | 24d | 1 | 0.49mi |
| 77 Preston Way #77 Boca Raton, FL | 1.0 | 1.0 | 600 | $1,350 | $2.25 | 7d | 1 | 0.50mi |
| 77 Preston Way #77 Boca Raton, FL | 1.0 | 1.0 | 600 | $1,450 | $2.42 | 22d | 1 | 0.50mi |
| 457 Mansfield I Unit 457 Boca Raton, FL | 1.0 | 1.5 | 720 | $1,700 | $2.36 | 3d | 1 | 0.50mi |
| 517 Mansfield M Unit 517 Boca Raton, FL | 1.0 | 1.5 | 715 | $1,550 | $2.17 | 24d | 1 | 0.56mi |
| 474 Mansfield L Unit L Boca Raton, FL | 1.0 | 1.5 | 720 | $1,400 | $1.94 | 11d | 1 | 0.56mi |
| 359 Brighton I Unit I Boca Raton, FL | 1.0 | 1.5 | 735 | $1,550 | $2.11 | 24d | 1 | 0.59mi |
| 129 Brighton D Boca Raton, FL | 1.0 | 1.5 | 720 | $1,300 | $1.81 | 24d | 1 | 0.59mi |
| 251 Brighton Dr Unit 251 Boca Raton, FL | 1.0 | 1.5 | 720 | $1,450 | $2.01 | 7d | 1 | 0.62mi |
| 156 Brighton Dr Unit 156 Boca Raton, FL | 1.0 | 1.5 | 720 | $1,350 | $1.88 | 24d | 1 | 0.62mi |
| 22 Brighton Dr Unit 22 Boca Raton, FL | 1.0 | 1.0 | 600 | $1,300 | $2.17 | 7d | 1 | 0.62mi |
| 314 Brighton H Unit H Boca Raton, FL | 1.0 | 1.5 | 720 | $1,500 | $2.08 | 14d | 1 | 0.63mi |
| 251 Brighton F Boca Raton, FL | 1.0 | 1.5 | 720 | $1,450 | $2.01 | 24d | 1 | 0.63mi |
| 149 Preston Way #149 Boca Raton, FL | 1.0 | 1.5 | 720 | $1,350 | $1.88 | 24d | 1 | 0.65mi |
| 149 Preston Way #149 Boca Raton, FL | 1.0 | 1.5 | 720 | $1,300 | $1.81 | 2d | 1 | 0.65mi |
| 91 Preston Way Unit 91 Boca Raton, FL | 1.0 | 1.0 | 600 | $1,500 | $2.50 | 24d | 1 | 0.65mi |
| 250 Suffolk F #250 Boca Raton, FL | 1.0 | 1.5 | 720 | $1,450 | $2.01 | 3d | 1 | 0.73mi |
| 171 Suffolk F #171 Boca Raton, FL | 1.0 | 1.5 | 720 | $1,500 | $2.08 | 11d | 1 | 0.73mi |
| 68 Suffolk F Unit 68 Boca Raton, FL | 1.0 | 1.5 | 720 | $2,750 | $3.82 | 24d | 1 | 0.73mi |
| 209 Suffolk F Unit F Boca Raton, FL | 1.0 | 1.5 | 720 | $1,400 | $1.94 | 24d | 1 | 0.73mi |
| 4067 Yarmouth D Boca Raton, FL | 1.0 | 1.5 | 738 | $1,650 | $2.24 | 3d | 1 | 0.73mi |
| 1072 Yarmouth E #1072 Boca Raton, FL | 1.0 | 1.5 | 738 | $1,950 | $2.64 | 24d | 1 | 0.75mi |
HOA detail condo
- Monthly dues
- $387 · $4,644/yr
- Likely covers
- internetgym
- Assessments
- None detected in remarks — confirm with the listing agent.
Listing history 2 events
-
2026-06-18remarks 471-char remark
-
2026-06-18$80,000 Active 259 DOM
ⓘ Source: listings_history table (triggers on properties + properties_extension) + one-shot
backfill from property_details.listing_events for pre-trigger history.
Nearby sold comps map
Loading sold comps map…
Walkable amenities ~0.75 mi
Loading nearby amenities…
Taxation est. · year 1
- Rental income
- $20,228
- − Mortgage interest
- −$4,481
- − Property taxes
- −$1,200
- − Insurance
- −$400
- − Repairs & maintenance
- −$1,618
- − Management
- −$1,618
- − HOA
- −$4,644
- − Depreciation
- −$2,327
- Taxable income
- $3,939
- Est. tax owed @ 24.0%
- −$945
- After-tax cash flow
- $3,757/yr
For passive investors: Depreciation is non-cash, so a rental often shows a tax loss while cash-flowing — sheltering income. Rental losses are passive: they offset passive income freely, and up to $25,000/yr can offset ordinary (W-2) income if you actively participate and your MAGI is under $100k (phasing out to $0 by $150k); unused losses carry forward. On sale, claimed depreciation is recaptured at up to 25%, and gains may owe capital-gains tax (a 1031 exchange can defer both). Figures are a year-1 estimate at your 24.0% rate — not tax advice; consult a CPA.
Schools (NCES district)
- District
- Palm Beach
- NCES district ID
- 1201500
- Math proficiency
- 46% ▼ -16.00%
- Reading proficiency
- 53% ▼ -4.00%
- Median HH income
- $53,943
- Composite
- 42.72/100
- National rank
- #3160
- State rank
- #34 of 73 in FL
Livability — Boca Raton
- Score
- 77/100
- State rank
- #192
- US rank
- #3070
Category grades
Schools grade is shown separately in the Schools card above.
Census & demographics
- County
- Palm Beach County · 1,438,312 people
- City population
- 250,102
- Metro
- Miami-Fort Lauderdale-Pompano Beach, FL
- Population (ZIP)
- 21,686
- Household income
- $77,269
- Rent vs Own
- Severe rent burden
- 812.0
Population outlook (Palm Beach County) Hauer SSP2
- Today (2025)
- 1,637,487 people
- By 2030
- 1,743,255 · +6.5%
- By 2040
- 1,948,712 · +19.0%
- By 2050
- 2,132,979 · +30.3%
- By 2075
- 2,530,027 · +54.5%
- By 2100
- 2,706,979 · +65.3%
Race, ethnicity, and origin ACS 2023
- Neighborhood character
- Predominantly White (72%)
- Race & ethnicity
- White 72% Hispanic / Latino 18% Two or more races 13% Asian 3% Black 3%
- Hispanic origin (detail)
- Mexican 2% Puerto Rican 2% Cuban 1%
- Common ancestry
- Romanian 9% Scotch-Irish 8% Italian 2%
- Foreign-born
- 25% · Canada, Jamaica, South Korea
- Languages at home
- 73% English-only · Spanish 15% Other Indo-European 4% Russian/Polish/Slavic 1%
Political lean MEDSL · Palm Beach
- 2024 margin
- Toss-up / Even · D 50.0% · R 49.2%
- 2008→2024 swing
- -22.1pp toward R · 2008: 22.9pp · 2024: 0.8pp
- All cycles
- 2024: D+0.8 2020: D+12.8 2016: D+15.3 2012: D+17.0 2008: D+22.9
Not yet ingested
- Civics
- —
Market trends
- HPI YoY
- ▼ -279.89%
- Current HPI
- 271.1328
- Rent YoY
- ▲ 1.81%
- Metro
- Miami-Fort Lauderdale-Pompano Beach, FL
- State GDP YoY
- ▲ 3.28%
- F500 in state
- 36
Industry mix (Fortune 500 HQ in FL)
| Industry | F500 HQs | Revenue |
|---|---|---|
| Industrial Technology | 2 | $29B |
|
||
| Insurance | 2 | $17B |
|
||
| Retail | 1 | $60B |
|
||
| Technology Distribution | 1 | $58B |
|
||
| Homebuilding | 1 | $35B |
|
||
| Technology Manufacturing | 1 | $35B |
|
||
Cash-flow waterfall
monthlySold comps — $/sqft
last 12 mo · ≤1 miLoading sold comps…