 Duplex
10800 S San Pedro St · Los Angeles, CA
Flood risk 1/10 · Minimal
- FEMA flood zone
- X (unshaded)
- Chance of flooding over 30 yrs
- 0.0%
- Est. flood insurance / yr
- $507 – $1,088
Fire risk 1/10 · Minimal
- Est. fire insurance / yr
- $659 – $1,223
Heat risk 5/10 · Moderate
- Hot days now (above 87°F)
- 7 days/yr
- Hot days in 30 yrs
- 21 days/yr
Wind risk 1/10 · Minimal
- Chance of severe wind over 30 yrs
- —
Air-quality risk 5/10 · Moderate
- Unhealthy air days now
- 7 days/yr
- Unhealthy air days in 30 yrs
- 7 days/yr
Risk factors via First Street. Map © Google.
Why this score? — see what drove the D- grade
The composite is a weighted blend of 9 inputs, each scored 0–100. Each bar is that input's sub-score; the figure is the points it added to the 100-point composite (weight × sub-score).
- Cash flow +13.0/30.0
- ARV discount +5.6/15.0
- DSCR +3.9/10.0
- Schools +3.6/10.0
- Livability +3.4/5.0
- 1% rule +3.2/10.0
- Rent growth +2.5/5.0
- Condition / age +2.5/5.0
- Appreciation +0.0/10.0
$825,000
🖨 Deal sheet (PDF) 📄 Offer letter ✓ Due diligence
Multi-family units
County records classify this as Multi-Family (2-4 Unit). Listing-text estimate: 2 units. confirmed
Listing remarks MLS
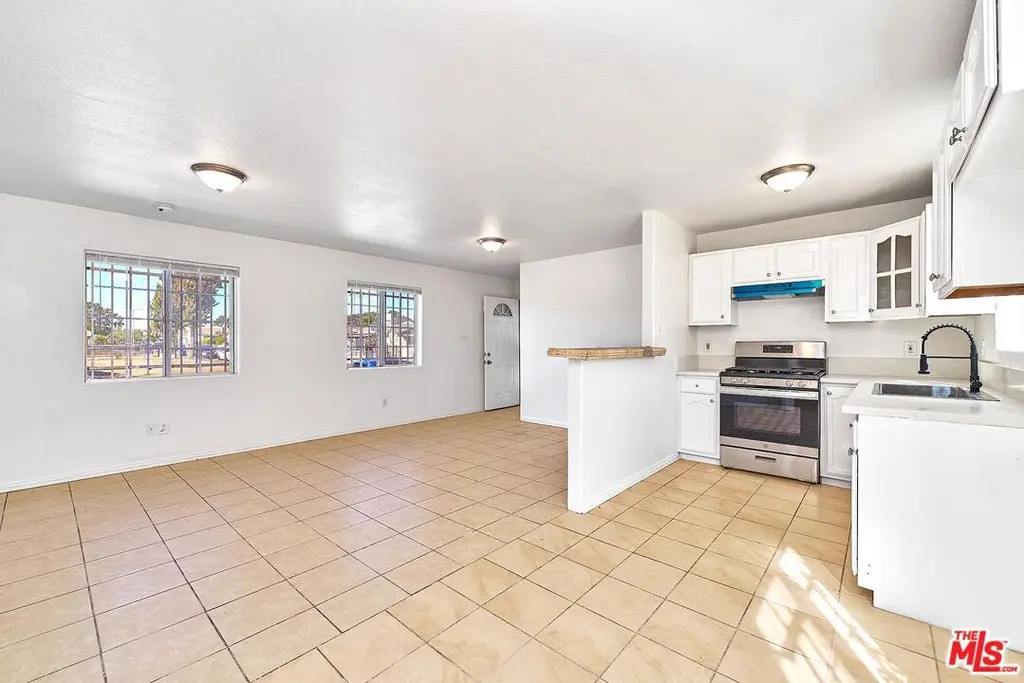
Take advantage of this great opportunity to own a spacious 3 bedroom 2 bath Each Duplex. Built in 2005, this property is located walking distance to middle and high school, near freeways 110/105 close to downtown, south of USC, Staples Center, L.A Live , L.A Colosseum with the new LAFC soccer stadium. East from the L.A Rams stadium.
Key facts
- Rear parking
- Investment potential
- Billboard lease
Tags
Property features AI
Finance
- Financial info: Gross income reported at $69,300; Net operating income reported at $47,730; Total annual expenses reported at $21,570; Cap rate 5.79%; Gross rent multiplier 11.9; Actual rent for one unit: $2,975 (projected $3,000); Other unit projected rent: $3,000
- HOA & community: Complex contains 2 total units
Exterior
- Parking: Total of 5 parking spaces; 2 covered parking spaces; 3 uncovered/open spaces; Gated parking
- Security: Gated
- Utilities: Utilities details not provided
- Home design: Residential income property; Two-level building; One building containing two units
- Construction: Construction details not provided
- Exterior features: No other structures
Interior
- Kitchen: Range/Oven
- Bedrooms: Two units with 3 bedrooms each (one 3-bed unit on each level)
- Bathrooms: Two 2-bath units (each unit has 2 bathrooms)
- Heating & cooling: Wall gas heat; No central or other cooling
- Interior features: Wall gas heating; No cooling
- Laundry & utility: Gas dryer hookup
Neighborhood map
What this means for you Summary
Snapshot
- This is a 2 × 3-bed/2.0-bath units multifamily listed at $825k.
Deal economics
- At list price, monthly cash flow is $-47 ($-564/yr) — negative. Per door: $-24/mo.
- To cash-flow at today's rent, offer at most $817k (1.0% below list).
- To meet the 1% rule (rent ≥ 1% of price), the offer needs to be $673k (18.4% below list).
- Recommended offer: $673k (18.4% below list) — sets the bar for 1% rule.
- Cap rate 6.2% vs local median 2.1% in Los Angeles — top-decile yield for the area; either an underpriced asset or a hidden risk that comps aren't pricing in. Stress-test before assuming the spread holds.
Location & tenants
- Location reads 68/100 on livability (#273 in CA) — a middle-class / working-renter tenant base. Strengths: amenities A+, commute A+, employment B; Watch: health & safety C-, schools D+, crime F.
- Los Angeles Unified (urban): math 29% / reading 54% proficiency, ranked #223 of 517 in CA (top 43%) — families likely to look elsewhere, expect single-tenant / working-renter base with shorter leases; 67% free/reduced lunch — lower-income household profile, screen leases tightly.
- Market conditions: 36 active listings in the ZIP; 18 comparable units currently listed for rent nearby; rentals lingering (median 44d on market — plan ~5-8 weeks vacancy on turnover, expect pricing pressure); 61% of comp listings sitting > 30 days — soft ceiling on asking rent; 19,697 units permitted in Los Angeles County in 2024 (9,426 in 5+ unit buildings).
- At $6,733/mo this rent would consume 132% of the median local household income ($61k/yr) (locally 1975% of renters already pay >50% of income on rent) — very limited rent-growth headroom before tenants either downsize or default.
Forward outlook
- Local home prices are declining (-3.0%/yr); year-one equity from $6k of loan paydown is wiped out by about $25k of value loss. Plan a longer hold.
- Los Angeles County population projected at +9% by 2050 — modest demand growth; plan on rents tracking national, not racing it.
Negotiation context
- It's been on market 48 days — a 3% lower offer ($800k) is reasonable based on typical stale-listing flexibility.
- 4 sale attempts since 8y ago with the ask held roughly flat each time — persistent listings suggest the price (not the market) is what's stuck; bring a comps-based counter.
- Current owner paid $580k; 42% above their basis — modest negotiation headroom, anchor on the comps not their cost.
Risks & watch-outs
- Climate carrying-cost: extreme-heat days projected 7→21/yr by 2055 (HVAC capex compounding) — expect insurance premiums to compound above CPI over the hold.
Questions for the listing agent
- What do current leases actually rent for vs. the listed asking? Can we see a recent rent roll and the last 12 months of T-12 income?
- It's been on market 48 days. Have you received any prior offers? Is the seller open to a 18% concession, seller financing, or rate buy-down credit?
- Can we see the unit-by-unit rent roll, current vacancy, and any below-market leases? What's the average tenancy length?
- What capital expenditures (roof, boiler, parking lot, exteriors) have been made in the last 5 years, and what's planned in the next 2?
- Is there a deadline driving the sale (1031 exchange, divorce, estate, relocation)? That informs how much negotiation room exists.
- Schools are D-rated, which usually means shorter tenancies and higher turnover. Who's the typical renter profile here, and what's been the actual vacancy rate?
- Crime grade is F in this area — have there been break-ins, vandalism, or insurance claims at this property in the last 3 years? What carrier currently insures it and at what premium?
- The area grade is low — what's the realistic commute time and amenity access for the typical tenant pool here? Any planned neighborhood developments (good or bad) we should know about?
- What's the average days-on-market for RENTAL listings here right now (not sales)? A rising rental-DOM trend means longer vacancies and softer asking-rent achievability than the comps imply.
- What's the recent tenant-quality profile in this submarket — average credit score on applications, eviction rate, late-payment / NSF rate, and stable-employment percentage? A property-management company in the area should have these aggregated.
- How much new apartment / multifamily construction is in the pipeline within 1–3 miles? Heavy new supply (>2% of stock underway) typically softens rents 12–24 months out; light construction supports rent growth.
Investment metrics
- 1% rule
- 0.82% ✗
- Cap rate
- 6.22%
- Cash-on-cash
- -0.24%
- DSCR
- 0.99
- GRM
- 10.2
CMA / ARV
- ARV (median comp)
- $791,702
- List price
- $825,000
- Delta
- 4.21%
- Verdict
- FAIR
- Comps
- 20 within 1.0 mi
Show comp detail 4 sales within ~0.75 mi
| Address | Dist | Beds/Ba | Sqft | Sold | Price | $/sf | Match |
|---|---|---|---|---|---|---|---|
| 440 E 106th | 0.24mi | 6/4.0 | 2,400 (-9%) | 0mo | $610,000 | $254 | 74 |
| 114 E 102nd St | 0.43mi | 7/3.0 (+1) | 2,864 (+8%) | 4mo | $625,000 | $218 | 53 |
| 11214 S Main St | 0.46mi | 5/4.0 (-1) | 2,285 (-13%) | 23mo | $645,000 | $282 | 32 |
| 407 W 107th St | 0.67mi | 5/3.5 (-1) | 2,251 (-15%) | 10mo | $930,000 | $413 | 29 |
Match score weights: distance 35% · size 25% · config 20% · recency 20%. Top-matched comps best support the ARV.
Projected returns pro-forma
-3.0% appreciation · 3.0% rent growth · sell at horizon
- IRR
- -16.7%
- Equity multiple
- 0.41×
- Total profit
- $-136,785
- Equity at exit
- $123,010
- IRR
- -8.6%
- Equity multiple
- 0.47×
- Total profit
- $-123,392
- Equity at exit
- $71,331
Cash invested: $231,000 (down + closing). Projections, not guarantees.
Landlord ↔ Tenant lean methodology
- Overall (CITY)
- 0 Strongly Tenant-Friendly
- State California
- 18 Strongly Tenant-Friendly · D+13
- County
- — inherits STATE
- City Los Angeles
- 0 Strongly Tenant-Friendly · D+22
ZIP-level market 90061
- Active inventory
- 36
- Price-to-rent
- 20.4×
Monthly cashflow live
- Estimated rent
- $6,733 high interval (Pro) →
- Mortgage (P&I)
- −$4,326
- Tax from tax record
- −$696 /mo · $8,352/yr
- Insurance
- −$344
- HOA
- −$0
- Vacancy / Maint / Mgmt
- −$1,414
- Net cashflow
- $-47
Break-even live
Sensitivity live
| Price | -10% $420 | -5% $186 | +0% $-47 | +5% $-281 | +10% $-514 |
|---|---|---|---|---|---|
| Rent | -10% $-579 | -5% $-313 | +0% $-47 | +5% $219 | +10% $485 |
| Rate | -1.0pp $368 | -0.5pp $163 | base $-47 | +0.5pp $-261 | +1.0pp $-478 |
2-unit breakdown (identical units grouped — click to expand)
| Units | Beds | Baths | Est. rent |
|---|---|---|---|
| 2× units | 3 | 2 | $6,734 |
| #1 | 3 | 2 | $3,367 |
| #2 | 3 | 2 | $3,367 |
| Total (2 units) | $6,733 | ||
UW: 25.0% down · 7.5% · 30yr · 1.5% tax · 5.0% vac · 8.0% maint · 8.0% mgmt
Financing live
Cash to close
- Down payment
- $206,250
- Closing costs
- $24,750
- Reserves months
- —
- Total cash needed
- —
Loan-product check · same deal, 3 products live
Conventional
25% down · 7.5% · 30yr
- Down + closing
- —
- Monthly P&I
- —
- Monthly cashflow
- —
- DSCR
- —
- Eligible?
- —
Personal DTI + credit; lowest rate.
DSCR
20% down · 8.5% · 30yr
- Down + closing
- —
- Monthly P&I
- —
- Monthly cashflow
- —
- DSCR
- —
- Eligible?
- —
No personal income docs; deal must DSCR.
Hard money
10% down · 12.0% · 12mo
- Down + closing
- —
- Monthly P&I
- —
- Monthly cashflow
- —
- DSCR
- —
- Eligible?
- —
Short-term bridge; refi at stabilization.
Rent comps 18 comps
| Address | Beds | Baths | Sqft | Rent | $/sqft | DOM | Units | Dist |
|---|---|---|---|---|---|---|---|---|
| 203 E 109th St Los Angeles, CA | 5.0 | 3.5 | 1935 | $4,000 | $2.07 | 44d | 1 | 0.15mi |
| 132 E 109th St Los Angeles, CA | 5.0 | 3.0 | 1820 | $4,200 | $2.31 | 44d | 1 | 0.21mi |
| 10605 Avalon Blvd Los Angeles, CA | 5.0 | 3.0 | 2378 | $4,300 | $1.81 | 44d | 1 | 0.24mi |
| 120 E 107th St Los Angeles, CA | 5.0 | 3.0 | 1878 | $3,800 | $2.02 | 8d | 1 | 0.26mi |
| 11227 Towne Ave Los Angeles, CA | 5.0 | 3.0 | 3354 | $4,000 | $1.19 | 44d | 1 | 0.41mi |
| 714 E 113th St Los Angeles, CA | 5.0 | 3.0 | 1850 | $3,300 | $1.78 | 8d | 1 | 0.61mi |
| 202 E 116th St Los Angeles, CA | 5.0 | 3.0 | 3522 | $4,500 | $1.28 | 44d | 1 | 0.64mi |
| 403 W 105th St Los Angeles, CA | 5.0 | 3.0 | 1866 | $3,850 | $2.06 | 14d | 1 | 0.71mi |
| 216 E 97th St Los Angeles, CA | 5.0 | 3.0 | 1753 | $3,800 | $2.17 | 44d | 1 | 0.71mi |
| 430 E 118th St Los Angeles, CA | 5.0 | 3.0 | 1854 | $4,000 | $2.16 | 44d | 1 | 0.82mi |
| 251 E 118th Pl Los Angeles, CA | 5.0 | 3.0 | 1753 | $4,200 | $2.40 | 15d | 1 | 0.84mi |
| 156 E 119th St Los Angeles, CA | 5.0 | 3.0 | 1857 | $3,800 | $2.05 | 44d | 1 | 0.95mi |
| 709 E 120th St Los Angeles, CA | 5.0 | 3.0 | 1854 | $3,900 | $2.10 | 44d | 1 | 1.05mi |
| 706 W 104th Pl Los Angeles, CA | 5.0 | 3.0 | 1850 | $4,000 | $2.16 | 8d | 1 | 1.08mi |
| 1122 E 94th St Los Angeles, CA | 6.0 | 3.0 | 2000 | $4,950 | $2.48 | 25d | 1 | 1.18mi |
| 638 W Colden Ave Los Angeles, CA | 5.0 | 3.0 | 1854 | $4,200 | $2.27 | 25d | 1 | 1.23mi |
| 159 W 89th St Los Angeles, CA | 5.0 | 3.0 | 1753 | $4,000 | $2.28 | 44d | 1 | 1.28mi |
| 157 W 89th St Los Angeles, CA | 5.0 | 3.0 | 1753 | $3,900 | $2.22 | 44d | 1 | 1.29mi |
Listing history 27 events
-
2026-06-18days on market $825,000 Active 48 DOM
-
2026-06-17days on market $825,000 Active 47 DOM
-
2026-06-16days on market $825,000 Active 46 DOM
-
2026-06-15days on market $825,000 Active 45 DOM
-
2026-06-13days on market $825,000 Active 43 DOM
-
2026-06-09days on market $825,000 Active 39 DOM
-
2026-06-08days on market $825,000 Active 38 DOM
-
2026-06-07days on market $825,000 Active 37 DOM
-
2026-06-04days on market $825,000 Active 34 DOM
-
2026-06-03days on market $825,000 Active 33 DOM
-
2026-06-02days on market $825,000 Active 32 DOM
-
2026-06-01days on market $825,000 Active 31 DOM
-
2026-05-31days on market $825,000 Active 30 DOM
-
2026-05-01$825,000 Active 741-char remark
-
2026-01-22price
-
2025-10-17Active
-
2018-10-26soldstatus $580,000
Show marketing remark (334 chars)
Take advantage of this great opportunity to own a spacious 3 bedroom 2 bath Each Duplex. Built in 2005, this property is located walking distance to middle and high school, near freeways 110/105 close to downtown, south of USC, Staples Center, L.A Live , L.A Colosseum with the new LAFC soccer stadium. East from the L.A Rams stadium.
-
2018-10-26soldstatus $580,000 Closed Sale
Show marketing remark (334 chars)
Take advantage of this great opportunity to own a spacious 3 bedroom 2 bath Each Duplex. Built in 2005, this property is located walking distance to middle and high school, near freeways 110/105 close to downtown, south of USC, Staples Center, L.A Live , L.A Colosseum with the new LAFC soccer stadium. East from the L.A Rams stadium.
-
2018-10-26soldstatus $580,000
Show marketing remark (334 chars)
Take advantage of this great opportunity to own a spacious 3 bedroom 2 bath Each Duplex. Built in 2005, this property is located walking distance to middle and high school, near freeways 110/105 close to downtown, south of USC, Staples Center, L.A Live , L.A Colosseum with the new LAFC soccer stadium. East from the L.A Rams stadium.
-
2018-09-04status Pending Sale
-
2018-04-22$600,000
Show marketing remark (334 chars)
Take advantage of this great opportunity to own a spacious 3 bedroom 2 bath Each Duplex. Built in 2005, this property is located walking distance to middle and high school, near freeways 110/105 close to downtown, south of USC, Staples Center, L.A Live , L.A Colosseum with the new LAFC soccer stadium. East from the L.A Rams stadium.
-
2018-04-22$600,000 Active
Show marketing remark (334 chars)
Take advantage of this great opportunity to own a spacious 3 bedroom 2 bath Each Duplex. Built in 2005, this property is located walking distance to middle and high school, near freeways 110/105 close to downtown, south of USC, Staples Center, L.A Live , L.A Colosseum with the new LAFC soccer stadium. East from the L.A Rams stadium.
-
2006-03-16soldstatus $540,000
-
2005-07-27soldstatus $225,000
-
1987-09-28soldstatus $70,000
-
1987-02-27soldstatus $85,539
-
1983-05-19soldstatus $42,000
ⓘ Source: listings_history table (triggers on properties + properties_extension) + one-shot
backfill from property_details.listing_events for pre-trigger history.
Tax reassessment forecast CA · Resets to sale price
- Current annual tax
- $8,352 · $696/mo
- Projected year-2 tax
- $8,352 · $696/mo
- Expected delta
- $0/yr ($0/mo · 0.0%)
ⓘ Screening estimate from a state-policy table — verify with the county assessor before closing.
Climate risk First Street
- Flood 1/10 Low FEMA zone X (unshaded) · 0% chance over 30 yrs
- Wildfire 1/10 Low
- Heat 5/10 Major 7 d/yr ≥87°F today · 21 d/yr by 30 yrs out
- Wind 1/10 Low
- Air quality 5/10 Major 7 unhealthy d/yr today · 7 by 30 yrs out
Nearby sold comps map
Loading sold comps map…
Walkable amenities ~0.75 mi
Loading nearby amenities…
Taxation est. · year 1
- Rental income
- $80,796
- − Mortgage interest
- −$46,213
- − Property taxes
- −$8,352
- − Insurance
- −$4,125
- − Repairs & maintenance
- −$6,464
- − Management
- −$6,464
- − Depreciation
- −$24,000
- Taxable loss
- −$14,821
- Est. tax savings @ 24.0%
- +$3,557
- After-tax cash flow
- $2,993/yr
For passive investors: Depreciation is non-cash, so a rental often shows a tax loss while cash-flowing — sheltering income. Rental losses are passive: they offset passive income freely, and up to $25,000/yr can offset ordinary (W-2) income if you actively participate and your MAGI is under $100k (phasing out to $0 by $150k); unused losses carry forward. On sale, claimed depreciation is recaptured at up to 25%, and gains may owe capital-gains tax (a 1031 exchange can defer both). Figures are a year-1 estimate at your 24.0% rate — not tax advice; consult a CPA.
Schools (NCES district)
- District
- Los Angeles Unified
- NCES district ID
- 0622710
- Math proficiency
- 29% ▼ -4.00%
- Reading proficiency
- 54% ▲ 10.00%
- Median HH income
- $50,403
- Composite
- 35.67/100
- National rank
- #4875
- State rank
- #223 of 517 in CA
Livability — Los Angeles
- Score
- 68/100
- State rank
- #273
- US rank
- #9237
Category grades
Schools grade is shown separately in the Schools card above.
Census & demographics
- Census place
- Los Angeles, CA
- County
- Los Angeles County · 9,444,647 people
- City population
- 3,838,149
- Metro
- Los Angeles-Long Beach-Anaheim, CA
- Population (ZIP)
- 30,051
- Household income
- $61,046
- Rent vs Own
- Severe rent burden
- 1975.0
Population outlook (Los Angeles County) Hauer SSP2
- Today (2025)
- 10,940,515 people
- By 2030
- 11,256,481 · +2.9%
- By 2040
- 11,729,929 · +7.2%
- By 2050
- 11,948,407 · +9.2%
- By 2075
- 11,818,114 · +8.0%
- By 2100
- 10,842,928 · -0.9%
Race, ethnicity, and origin ACS 2023
- Neighborhood character
- Predominantly Hispanic (70%)
- Race & ethnicity
- Hispanic / Latino 70% Black 26% Two or more races 22% Native American 3% White 2%
- Hispanic origin (detail)
- Mexican 51%
- Common ancestry
- British 1%
- Foreign-born
- 32% · Canada, Jamaica
- Languages at home
- 38% English-only · Spanish 61%
Political lean MEDSL · Los Angeles
- 2024 margin
- Solid D (+32.9) · D 64.8% · R 31.9% · Other 3.3%
- 2008→2024 swing
- -7.4pp toward R · 2008: 40.4pp · 2024: 32.9pp
- All cycles
- 2024: D+32.9 2020: D+44.2 2016: D+48.0 2012: D+40.0 2008: D+40.4
Not yet ingested
- Civics
- —
Market trends
- HPI YoY
- ▼ -528.07%
- Current HPI
- 502.9923
- Rent YoY
- —
- Metro
- Los Angeles-Long Beach-Anaheim, CA
- State GDP YoY
- ▲ 3.21%
- F500 in state
- 116
Industry mix (Fortune 500 HQ in CA)
| Industry | F500 HQs | Revenue |
|---|---|---|
| Technology | 27 | $1,492B |
|
||
| Financial Services | 3 | $174B |
|
||
| Retail | 3 | $44B |
|
||
| Insurance | 3 | $26B |
|
||
| Media / Entertainment | 2 | $115B |
|
||
| Pharmaceuticals / Biotech | 2 | $62B |
|
||
Price history
+1864.3% since first listed14 events — show timeline
- 2026-05-01 Listed $825,000 TheMLS
- 2026-01-22 Price Changed — TheMLS
- 2025-10-17 Listed — TheMLS
- 2018-10-26 Sold (Public Records) $580,000 Public Records
- 2018-10-26 Sold (MLS) $580,000 CRMLS
- 2018-10-26 Sold (MLS) $580,000 SDMLS
- 2018-09-04 Pending — CRMLS
- 2018-04-22 Listed $600,000 CRMLS
- 2018-04-22 Listed $600,000 SDMLS
- 2006-03-16 Sold (Public Records) $540,000 Public Records
- 2005-07-27 Sold (Public Records) $225,000 Public Records
- 1987-09-28 Sold (Public Records) $70,000 Public Records
- 1987-02-27 Sold (Public Records) $85,539 Public Records
- 1983-05-19 Sold (Public Records) $42,000 Public Records
Property tax history
+1.0%/yrLatest (2025): $8,352 · +1.7% YoY. Source: county tax records.
Cash-flow waterfall
monthlySold comps — $/sqft
last 12 mo · ≤1 miLoading sold comps…