 Multi-family
3317 Sampson St · Houston, TX
Flood risk 6/10 · Moderate
- FEMA flood zone
- X (unshaded)
- Chance of flooding over 30 yrs
- 0.95%
- Est. flood insurance / yr
- $507 – $1,088
Fire risk 1/10 · Minimal
- Est. fire insurance / yr
- $1,222 – $2,270
Heat risk 9/10 · Severe
- Hot days now (above 109°F)
- 7 days/yr
- Hot days in 30 yrs
- 24 days/yr
Wind risk 9/10 · Severe
- Chance of severe wind over 30 yrs
- 99.0%
Air-quality risk 2/10 · Minimal
- Unhealthy air days now
- 2 days/yr
- Unhealthy air days in 30 yrs
- 2 days/yr
Risk factors via First Street. Map © Google.
Why this score? — see what drove the C+ grade
The composite is a weighted blend of 9 inputs, each scored 0–100. Each bar is that input's sub-score; the figure is the points it added to the 100-point composite (weight × sub-score).
- Cash flow +30.0/30.0
- 1% rule +10.0/10.0
- DSCR +10.0/10.0
- Condition / age +4.0/5.0
- Livability +3.7/5.0
- Schools +2.7/10.0
- Rent growth +2.4/5.0
- ARV discount +0.0/15.0
- Appreciation +0.0/10.0
$380,000
🖨 Deal sheet 📄 Offer letter ✓ Due diligence
Multi-family units
County records classify this as Multi-Family (2-4 Unit). Listing-text estimate: 1 unit. estimate disagrees with records
Listing remarks
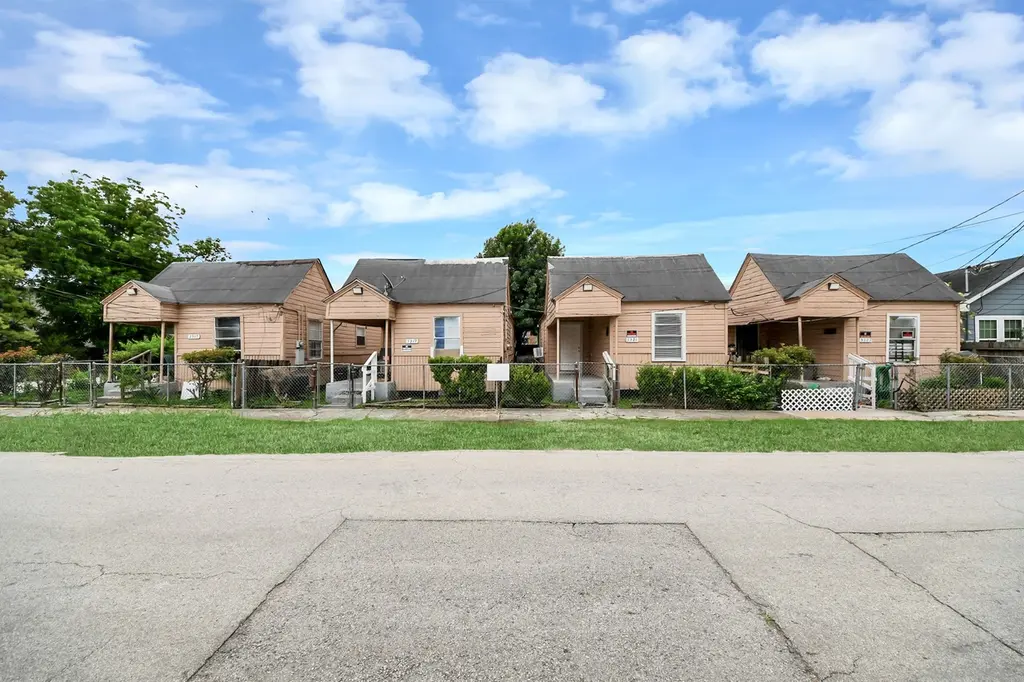
Excellent investment opportunity featuring four detached residential units located at 3317, 3319, 3321, and 3323 Sampson St in Houston. Each unit offers privacy, functional layouts, and strong rental potential, making this property ideal for investors or owner-occupants. Conveniently located with easy access to major highways, downtown Houston, dining, and entertainment.
Key facts
- Conveniently located
- 5,000 sq ft lot
- Built 1930
Tags
Property features AI
Finance
- Other: Listing is for a multi-unit property with 4 total units
- Financial info: Annual tax information available (tax amounts omitted per instructions)
- HOA & community: No HOA details provided
Exterior
- Parking: No parking details provided
- Security: No security features provided
- Utilities: Has heating and cooling
- Home design: Built in 1930; Property type: Residential Income
- Construction: Total building area approximately 684; Year built: 1930
- Exterior features: Lot approximately 5,000 square feet
Interior
- Kitchen: No kitchen appliance details provided
- Bedrooms: Total of 4 units (individual bedroom counts per unit not provided)
- Flooring: No flooring details provided
- Bathrooms: 1 full bathroom (total)
- Heating & cooling: Central heating (gas); Central electric air conditioning
- Interior features: Residential income property
- Laundry & utility: No laundry or utility appliance details provided
Neighborhood map
What this means for you Summary
Snapshot
- This is a 2-bed/1.0-bath multifamily listed at $380k. Condition is rated good.
Deal economics
- At list price, monthly cash flow is $2k ($26k/yr) — positive.
- The deal already cash-flows at list — no discount required.
- Meets the 1% rule at list price ($6k rent vs $380k).
- Recommended offer: $374k (1.5% below list) — sets the bar for market timing.
- Cap rate 13.3% vs local median 3.2% in Houston — top-decile yield for the area; either an underpriced asset or a hidden risk that comps aren't pricing in. Stress-test before assuming the spread holds.
Location & tenants
- Location reads 74/100 on livability (#184 in TX, #4,771 nationally) — a middle-class / working-renter tenant base. Strengths: amenities A+, cost of living A+, housing A+; Watch: crime F.
- Houston ISD (urban): math 27% / reading 35% proficiency, ranked #593 of 826 in TX (top 72%) — families likely to look elsewhere, expect single-tenant / working-renter base with shorter leases; 71% free/reduced lunch — lower-income household profile, screen leases tightly.
- Zoned schools: Blackshear El (math 27% / reading 32%, grade F, #2,525 of 4,322 statewide, top 62%, 308 students, 99% FRL); Cullen Middle (math 6% / reading 14%, grade F, #1,641 of 1,662 statewide, top 99%, 324 students, 100% FRL); Yates H S (math 12% / reading 23%, grade F, #1,451 of 1,632 statewide, top 89%, 851 students, 96% FRL) — zoned schools average 98% FRL vs 71% district-wide (27 pts higher); higher-poverty schools than district average — tighter screening recommended.
- Zoned-school proficiency averages 19% at this address vs 31% district-wide (-12 pts) — the specific schools serving this property underperform the Houston ISD average; the district grade overstates school quality for this exact location.
- Market conditions: Rents soft (-0.3%/yr); 581 active listings in the ZIP; 40 comparable units currently listed for rent nearby; rentals at typical pace (median 25d on market — plan ~3-4 weeks tenant-placement turnaround); 48% of comp listings sitting > 30 days — soft ceiling on asking rent; 29,883 units permitted in Harris County in 2024 (8,621 in 5+ unit buildings).
- At $6,113/mo this rent would consume 103% of the median local household income ($71k/yr) (locally 3072% of renters already pay >50% of income on rent) — very limited rent-growth headroom before tenants either downsize or default.
Forward outlook
- Local home prices are declining (-3.0%/yr); year-one equity from $3k of loan paydown is wiped out by about $11k of value loss. Plan a longer hold.
- Harris County population projected at +47% by 2050 — long-run rental-demand tailwind backs the buy-and-hold thesis.
- At projected returns (-3.0% appreciation + 0.0% rent growth), your $106k cash investment doubles in ~6 years — after that, you're playing with house money.
Negotiation context
- It's been on market 15 days — a 2% lower offer ($374k) is reasonable based on typical stale-listing flexibility.
Risks & watch-outs
- Watch-outs: built in 1930 — expect roof / HVAC / electrical / plumbing capex.
- Climate carrying-cost: major flood risk; severe wind risk, 99% chance of damaging wind over 30y; extreme-heat days projected 7→24/yr by 2055 (HVAC capex compounding) — expect insurance premiums to compound above CPI over the hold.
Questions for the listing agent
- Built in 1930 — when were the roof, HVAC, electrical panel, plumbing, and water heater last replaced?
- Is there a deadline driving the sale (1031 exchange, divorce, estate, relocation)? That informs how much negotiation room exists.
- Schools are D-rated, which usually means shorter tenancies and higher turnover. Who's the typical renter profile here, and what's been the actual vacancy rate?
- Crime grade is F in this area — have there been break-ins, vandalism, or insurance claims at this property in the last 3 years? What carrier currently insures it and at what premium?
- What's the average days-on-market for RENTAL listings here right now (not sales)? A rising rental-DOM trend means longer vacancies and softer asking-rent achievability than the comps imply.
- What's the recent tenant-quality profile in this submarket — average credit score on applications, eviction rate, late-payment / NSF rate, and stable-employment percentage? A property-management company in the area should have these aggregated.
- How much new apartment / multifamily construction is in the pipeline within 1–3 miles? Heavy new supply (>2% of stock underway) typically softens rents 12–24 months out; light construction supports rent growth.
Investment metrics
- 1% rule
- 1.61% ✓
- Cap rate
- 13.25%
- Cash-on-cash
- 24.85%
- DSCR
- 2.11
- GRM
- 5.2
CMA / ARV
- ARV (on-the-fly)
- $303,696
- Comps found
- 1
Show comp detail 1 sale within ~0.75 mi
| Address | Dist | Beds/Ba | Sqft | Sold | Price | $/sf | Match |
|---|---|---|---|---|---|---|---|
| 3417 Bremond St | 0.45mi | 2/1.0 | 720 (+5%) | 8mo | $319,999 | $444 | 63 |
Match score weights: distance 35% · size 25% · config 20% · recency 20%. Top-matched comps best support the ARV.
Projected returns pro-forma
-3.0% appreciation · 0.0% rent growth · sell at horizon
- IRR
- 14.8%
- Equity multiple
- 1.57×
- Total profit
- $60,923
- Equity at exit
- $56,659
- IRR
- 21.2%
- Equity multiple
- 2.55×
- Total profit
- $164,878
- Equity at exit
- $32,855
Cash invested: $106,400 (down + closing). Projections, not guarantees.
Landlord ↔ Tenant lean methodology
- Overall (STATE)
- 87 Strongly Landlord-Friendly
- State Texas
- 87 Strongly Landlord-Friendly · R+5
- County
- — inherits STATE
- City
- — inherits STATE
ZIP-level market 77004
- Rents YoY
- -0.3%
- Active inventory
- 581
- Price-to-rent
- 20.7×
Monthly cashflow live
- Estimated rent
- $6,113 high interval (Pro) →
- Mortgage (P&I)
- −$1,993
- Tax est. 1.5%
- −$475 /mo · $5,700/yr
- Insurance
- −$158
- HOA
- −$0
- Vacancy / Maint / Mgmt
- −$1,284
- Net cashflow
- $2,203
Break-even live
4-unit breakdown (identical units grouped — click to expand)
| Units | Beds | Baths | Est. rent |
|---|---|---|---|
| 4× units | 2 | 1 | $6,112 |
| #1 | 2 | 1 | $1,528 |
| #2 | 2 | 1 | $1,528 |
| #3 | 2 | 1 | $1,528 |
| #4 | 2 | 1 | $1,528 |
| Total (4 units) | $6,113 | ||
UW: 25.0% down · 7.5% · 30yr · 1.5% tax · 5.0% vac · 8.0% maint · 8.0% mgmt
Financing live
Cash to close
- Down payment
- $95,000
- Closing costs
- $11,400
- Reserves months
- —
- Total cash needed
- —
Loan-product check · same deal, 3 products live
Conventional
25% down · 7.5% · 30yr
- Down + closing
- —
- Monthly P&I
- —
- Monthly cashflow
- —
- DSCR
- —
- Eligible?
- —
Personal DTI + credit; lowest rate.
DSCR
20% down · 8.5% · 30yr
- Down + closing
- —
- Monthly P&I
- —
- Monthly cashflow
- —
- DSCR
- —
- Eligible?
- —
No personal income docs; deal must DSCR.
Hard money
10% down · 12.0% · 12mo
- Down + closing
- —
- Monthly P&I
- —
- Monthly cashflow
- —
- DSCR
- —
- Eligible?
- —
Short-term bridge; refi at stabilization.
Rent comps 40 comps
| Address | Beds | Baths | Sqft | Rent | $/sqft | DOM | Units | Dist |
|---|---|---|---|---|---|---|---|---|
| 3339 Simmons St Houston, TX | 2.0 | 1.0 | 697 | $1,000 | $1.43 | 44d | 1 | 0.10mi |
| 3315 Reeves St Unit 3 Houston, TX | 2.0 | 1.0 | 657 | $800 | $1.22 | 5d | 1 | 0.18mi |
| 3122 Lucinda St Houston, TX | 2.0 | 1.0 | 591 | $855 | $1.45 | 44d | 1 | 0.26mi |
| 3122 Lucinda St Houston, TX | 2.0 | 1.0 | 591 | $855 | $1.45 | 22d | 1 | 0.26mi |
| 3719 Elgin St Houston, TX | 1.0–5.0 | 1.0–5.0 | 1241 | $1,112 | $0.90 | 24d | 14 | 0.33mi |
| 3721 Tuam St Houston, TX | 2.0 | 1.0 | 750 | $900 | $1.20 | 44d | 1 | 0.42mi |
| 3121 Isabella St #4 Houston, TX | 1.0 | 1.0 | 500 | $900 | $1.80 | 44d | 1 | 0.57mi |
| 3019 Truxillo St Houston, TX | 2.0 | 1.0 | 700 | $900 | $1.29 | 44d | 1 | 0.58mi |
| 3448 Coyle St Unit 3469 Houston, TX | 1.0 | 1.0 | 713 | $912 | $1.28 | 15d | 1 | 0.72mi |
| 3448 Coyle St Unit 3499 Houston, TX | 1.0 | 1.0 | 713 | $907 | $1.27 | 44d | 1 | 0.72mi |
| 3448 Coyle St Unit 1162 Houston, TX | 1.0 | 1.0 | 713 | $877 | $1.23 | 5d | 1 | 0.72mi |
| 3448 Coyle St Unit 3469 Houston, TX | 1.0 | 1.0 | 713 | $874 | $1.23 | 3d | 1 | 0.72mi |
| 3448 Coyle St Unit 321 Houston, TX | 1.0 | 1.0 | 713 | $877 | $1.23 | 8d | 1 | 0.72mi |
| 3448 Coyle St Houston, TX | 1.0 | 1.0 | 713 | $866 | $1.21 | 13d | 1 | 0.73mi |
| 1907 Cullen Blvd Houston, TX | 1.0 | 1.0 | 620 | $1,449 | $2.34 | 44d | 1 | 0.80mi |
| 1907 Cullen Blvd Houston, TX | 1.0 | 1.0 | 620 | $1,449 | $2.34 | 17d | 1 | 0.80mi |
| 1887 Ennis St Houston, TX | 1.0 | 1.0 | 652 | $1,089 | $1.67 | 24d | 2 | 0.81mi |
| 2675 Gray St Houston, TX | 1.0–2.0 | 1.0–2.0 | 838 | $1,057 | $1.26 | 44d | 6 | 0.84mi |
| 2402 Berry St Unit 7 Houston, TX | 1.0 | 1.0 | 700 | $1,850 | $2.64 | 44d | 1 | 0.87mi |
| 3122 Leeland St Houston, TX | 1.0 | 1.0 | 617 | $960 | $1.56 | 44d | 1 | 0.91mi |
| 2411 Bastrop St Unit 2 Houston, TX | 2.0 | 1.0 | 650 | $900 | $1.38 | 22d | 1 | 0.93mi |
| 2407 Bastrop St Unit 1 R M Houston, TX | 2.0 | 1.0 | 650 | $1,000 | $1.54 | 44d | 1 | 0.94mi |
| 4309 Pease St Houston, TX | 2.0 | 1.0 | 700 | $1,100 | $1.57 | 44d | 1 | 1.09mi |
| 4804 Delano St Unit 2 Houston, TX | 1.0 | 1.0 | 550 | $800 | $1.45 | 5d | 1 | 1.09mi |
| 4320 Leeland St Unit 3 Houston, TX | 1.0 | 1.0 | 630 | $950 | $1.51 | 44d | 1 | 1.11mi |
| 3629 N MacGregor Way Houston, TX | 1.0 | 1.0 | 700 | $775 | $1.11 | 44d | 1 | 1.12mi |
| 4320 Leeland St Unit 17 Houston, TX | 1.0 | 1.0 | 630 | $975 | $1.55 | 44d | 1 | 1.12mi |
| 4465 N MacGregor Way Houston, TX | 1.0 | 1.0 | 524 | $1,600 | $3.05 | 20d | 1 | 1.22mi |
| 4465 N MacGregor Way Houston, TX | 1.0 | 1.0 | 524 | $1,600 | $3.05 | 44d | 1 | 1.22mi |
| 4203 Polk St Houston, TX | 1.0 | 1.0 | 468 | $825 | $1.76 | 44d | 1 | 1.23mi |
| 2425 Bell St Houston, TX | 2.0 | 1.0–2.0 | 860 | $2,806 | $3.26 | 2d | 76 | 1.25mi |
| 4305 Polk St Unit 4307 Houston, TX | 1.0 | 1.0 | 551 | $975 | $1.77 | 24d | 1 | 1.27mi |
| 4009 Lamar St Unit C Houston, TX | 1.0 | 1.0 | 613 | $999 | $1.63 | 15d | 1 | 1.31mi |
| 5506 Sampson St Houston, TX | 1.0 | 1.0 | 572 | $1,160 | $2.03 | 20d | 1 | 1.32mi |
| 5506 Sampson St Houston, TX | 1.0 | 1.0 | 572 | $1,160 | $2.03 | 22d | 1 | 1.32mi |
| 4431 Clay St Unit B Houston, TX | 1.0 | 1.0 | 600 | $950 | $1.58 | 24d | 1 | 1.33mi |
| 806 Sampson St Houston, TX | 1.0 | 1.0 | 763 | $1,650 | $2.16 | 2d | 18 | 1.33mi |
| 1601 Francis St Houston, TX | 1.0 | 1.0 | 650 | $950 | $1.46 | 44d | 1 | 1.34mi |
| 4411 Dallas St Houston, TX | 2.0 | 1.0–2.0 | 734 | $2,000 | $2.72 | 1d | 13 | 1.39mi |
| 2412 Southmore Blvd Houston, TX | 2.0 | 1.0 | 700 | $850 | $1.21 | 44d | 1 | 1.41mi |
Listing history 10 events
-
2026-06-18days on market $380,000 Active 15 DOM
-
2026-06-17days on market $380,000 Active 14 DOM
-
2026-06-16days on market $380,000 Active 13 DOM
-
2026-06-15days on market $380,000 Active 12 DOM
-
2026-06-13days on market $380,000 Active 10 DOM
-
2026-06-09days on market $380,000 Active 6 DOM
-
2026-06-08days on market $380,000 Active 5 DOM
-
2026-06-07days on market $380,000 Active 4 DOM
-
2026-06-04remarks 373-char remark
-
2026-06-04$380,000 Active 1 DOM
ⓘ Source: listings_history table (triggers on properties + properties_extension) + one-shot
backfill from property_details.listing_events for pre-trigger history.
Climate risk First Street
- Flood 6/10 Major FEMA zone X (unshaded) · 95% chance over 30 yrs
- Wildfire 1/10 Low
- Heat 9/10 Extreme 7 d/yr ≥109°F today · 24 d/yr by 30 yrs out
- Wind 9/10 Extreme 99% chance of damaging wind over 30 yrs
- Air quality 2/10 Low 2 unhealthy d/yr today · 2 by 30 yrs out
Nearby sold comps map
Loading sold comps map…
Walkable amenities ~0.75 mi
Loading nearby amenities…
Taxation est. · year 1
- Rental income
- $73,356
- − Mortgage interest
- −$21,286
- − Property taxes
- −$5,700
- − Insurance
- −$1,900
- − Repairs & maintenance
- −$5,868
- − Management
- −$5,868
- − Depreciation
- −$11,055
- Taxable income
- $21,679
- Est. tax owed @ 24.0%
- −$5,203
- After-tax cash flow
- $21,235/yr
For passive investors: Depreciation is non-cash, so a rental often shows a tax loss while cash-flowing — sheltering income. Rental losses are passive: they offset passive income freely, and up to $25,000/yr can offset ordinary (W-2) income if you actively participate and your MAGI is under $100k (phasing out to $0 by $150k); unused losses carry forward. On sale, claimed depreciation is recaptured at up to 25%, and gains may owe capital-gains tax (a 1031 exchange can defer both). Figures are a year-1 estimate at your 24.0% rate — not tax advice; consult a CPA.
Condition & rehab AI · 13 photos
This multi-family property offers four detached units with good condition and potential for rental or resale value. Minor exterior painting and maintenance would further enhance its curb appeal and value.
Value-add opportunities
- Both Paint exterior siding — Enhances curb appeal and value
- Both Trim and paint exterior trim — Improves curb appeal and value
- Rental Clean and maintain HVAC filters — Ensures efficient operation and reduces maintenance costs
Renovation cost estimate screening
Value-add ROI direction
- Both Paint exterior siding — Enhances curb appeal and value ↑
- Both Trim and paint exterior trim — Improves curb appeal and value ↑
- Rental Clean and maintain HVAC filters — Ensures efficient operation and reduces maintenance costs ↑
ⓘ Cost ranges are severity-bucket heuristics (US national rule-of-thumb). Get contractor quotes + a written scope before underwriting a rehab budget.
Schools (NCES district)
- District
- Houston ISD
- NCES district ID
- 4823640
- Math proficiency
- 27% ▼ -18.00%
- Reading proficiency
- 35% ▼ -6.00%
- Median HH income
- $46,054
- Composite
- 26.63/100
- National rank
- #7173
- State rank
- #593 of 826 in TX
Livability — Houston
- Score
- 74/100
- State rank
- #184
- US rank
- #4771
Category grades
Schools grade is shown separately in the Schools card above.
Census & demographics
- Census place
- Houston, TX
- County
- Harris County · 4,702,590 people
- City population
- 3,226,434
- Metro
- Houston-The Woodlands-Sugar Land, TX
- Population (ZIP)
- 35,997
- Household income
- $71,199
- Rent vs Own
- Severe rent burden
- 3072.0
Population outlook (Harris County) Hauer SSP2
- Today (2025)
- 5,571,493 people
- By 2030
- 6,089,821 · +9.3%
- By 2040
- 7,142,806 · +28.2%
- By 2050
- 8,185,864 · +46.9%
- By 2075
- 10,574,329 · +89.8%
- By 2100
- 12,109,958 · +117.4%
Race, ethnicity, and origin ACS 2023
- Neighborhood character
- Diverse neighborhood (Simpson 0.68)
- Race & ethnicity
- Black 48% White 27% Hispanic / Latino 13% Two or more races 11% Asian 8%
- Hispanic origin (detail)
- Mexican 9%
- Common ancestry
- Lithuanian 1% Romanian 1% Italian 1%
- Foreign-born
- 14% · Canada, China, South Korea
- Languages at home
- 82% English-only · Spanish 10% Chinese 2% Other Indo-European 2%
Political lean MEDSL · Harris
- 2024 margin
- Lean D (+5.5) · D 52.0% · R 46.4% · Other 1.6%
- 2008→2024 swing
- +3.9pp toward D · 2008: 1.6pp · 2024: 5.5pp
- All cycles
- 2024: D+5.5 2020: D+13.3 2016: D+12.4 2012: D+0.1 2008: D+1.6
Not yet ingested
- Civics
- —
Market trends
- HPI YoY
- ▼ -139.34%
- Current HPI
- 199.6066
- Rent YoY
- ▼ -0.32%
- Metro
- Houston-The Woodlands-Sugar Land, TX
- State GDP YoY
- ▲ 3.95%
- F500 in state
- 110
Industry mix (Fortune 500 HQ in TX)
| Industry | F500 HQs | Revenue |
|---|---|---|
| Energy | 16 | $1,198B |
|
||
| Technology | 5 | $198B |
|
||
| Engineering / Construction | 4 | $72B |
|
||
| Energy Services | 3 | $60B |
|
||
| Utilities | 3 | $41B |
|
||
| Healthcare | 2 | $330B |
|
||
Price history
1 event — show timeline
- 2026-06-03 Listed $380,000 HARMLS
Cash-flow waterfall
monthlySold comps — $/sqft
last 12 mo · ≤1 miLoading sold comps…