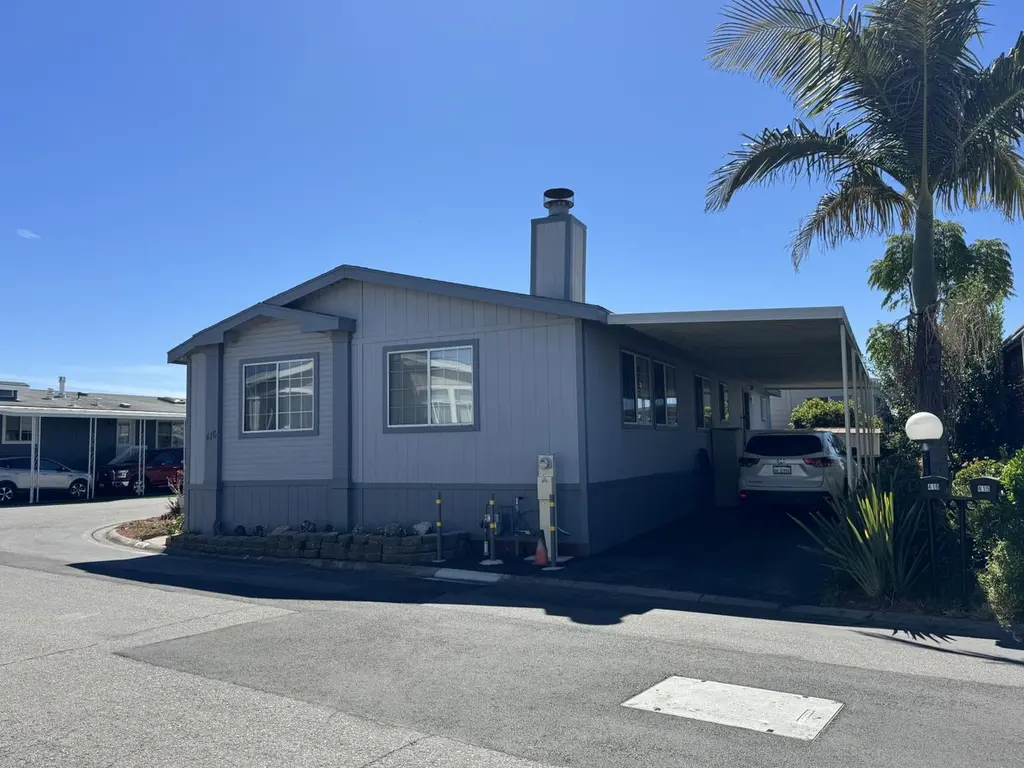
1085 Tasman Dr #416 · Sunnyvale, CA
Flood risk 1/10 · Minimal
- FEMA flood zone
- AE
- Chance of flooding over 30 yrs
- 0.0%
- Est. flood insurance / yr
- $1,737 – $8,500
Fire risk 1/10 · Minimal
- Est. fire insurance / yr
- $659 – $1,223
Heat risk 5/10 · Moderate
- Hot days now (above 91°F)
- 8 days/yr
- Hot days in 30 yrs
- 16 days/yr
Wind risk 1/10 · Minimal
- Chance of severe wind over 30 yrs
- —
Air-quality risk 7/10 · Major
- Unhealthy air days now
- 13 days/yr
- Unhealthy air days in 30 yrs
- 13 days/yr
Risk factors via First Street. Map © Google.
Why this score? — see what drove the B- grade
The composite is a weighted blend of 9 inputs, each scored 0–100. Each bar is that input's sub-score; the figure is the points it added to the 100-point composite (weight × sub-score).
- Cash flow +27.2/30.0
- DSCR +9.5/10.0
- 1% rule +7.4/10.0
- ARV discount +6.4/15.0
- Schools +5.3/10.0
- Livability +4.1/5.0
- Appreciation +3.2/10.0
- Rent growth +3.2/5.0
- Condition / age +2.5/5.0
$409,000
🖨 Deal sheet 📄 Offer letter ✓ Due diligence
Listing remarks MLS
Beautiful mobile home located in the highly desirable Casa de Amigos Mobile Home Park. This spacious residence features 3 bedrooms, 2 bathrooms, and a versatile bonus room that can be used as a home office, gym, game room or customized to fit your lifestyle. This beautiful mobile home also offers a clean, open layout either plenty of space for comfortable family living. Situated on a corner lot, it provides ample outdoor space perfect for hosting BBQs and entertaining guests. Casa de Amigos is a well-maintained community known for its friendly atmosphere while still offering privacy and security. Residents enjoy access to great amenities, including a gym, swimming pool, hot tub, and event space. Conveniently located near Silicon Valley, this property is surrounded by shopping centers, dining options and everyday conveniences, making it an ideal place to call it home.
Key facts
- Hot tub
- Bonus room
- Swimming pool
Tags
Neighborhood map
What this means for you Summary
Snapshot
- This is a 4-bed/2.0-bath manufactured listed at $409k.
Deal economics
- At list price, monthly cash flow is $750 ($9k/yr) — positive.
- The deal already cash-flows at list — no discount required.
- Meets the 1% rule at list price ($5k rent vs $409k).
- Recommended offer: $384k (6.0% below list) — sets the bar for market timing.
- Cap rate 9.7% vs local median 1.2% in Sunnyvale — top-decile yield for the area; either an underpriced asset or a hidden risk that comps aren't pricing in. Stress-test before assuming the spread holds.
Location & tenants
- Location reads 82/100 on livability (#37 in CA, #1,258 nationally) — a professional / high-income tenant draw. Strengths: amenities A+, commute A+, employment A+; Watch: cost of living F.
- Santa Clara Unified (urban): math 49% / reading 66% proficiency, ranked #75 of 517 in CA (top 14%) — acceptable for families but not a draw, mixed tenant base, ~2y average lease.
- Market conditions: Rents rising (+2.6%/yr); 69 active listings in the ZIP; 7 comparable units currently listed for rent nearby; rentals leasing fast (median 2d on market — plan ~1-2 weeks tenant-placement turnaround); high-income renter base; 3,838 units permitted in Santa Clara County in 2024 (1,886 in 5+ unit buildings).
- This rent runs 38% of the median local income ($158k/yr) — at the standard rent-burdened threshold; future hikes will face affordability resistance.
Forward outlook
- Local home prices are declining (-3.0%/yr); year-one equity from $3k of loan paydown is wiped out by about $12k of value loss. Plan a longer hold.
- Santa Clara County population projected at +24% by 2050 — long-run rental-demand tailwind backs the buy-and-hold thesis.
Negotiation context
- It's been on market 80 days — a 6% lower offer ($384k) is reasonable based on typical stale-listing flexibility.
- 2 sale attempts with the ask held roughly flat each time — persistent listings suggest the price (not the market) is what's stuck; bring a comps-based counter.
Risks & watch-outs
- Watch-outs: flood insurance adds $427/mo.
- Climate carrying-cost: in FEMA flood zone AE (mandatory federal flood insurance); extreme-heat days projected 8→16/yr by 2055 (HVAC capex compounding) — expect insurance premiums to compound above CPI over the hold.
Questions for the listing agent
- It's been on market 80 days. Have you received any prior offers? Is the seller open to a 6% concession, seller financing, or rate buy-down credit?
- What's the actual annual flood-insurance premium (NFIP or private), and is the property in a SFHA with mandatory coverage?
- Why hasn't it sold? Are there any deal-killer items the seller is aware of (foundation, flood, title, zoning, code violations)?
- Is there a deadline driving the sale (1031 exchange, divorce, estate, relocation)? That informs how much negotiation room exists.
- Schools are B-rated — typically a magnet for longer-tenancy family renters. What's the average tenant stay here, and is there a school-zone premium baked into asking?
- What's the average days-on-market for RENTAL listings here right now (not sales)? A rising rental-DOM trend means longer vacancies and softer asking-rent achievability than the comps imply.
- What's the recent tenant-quality profile in this submarket — average credit score on applications, eviction rate, late-payment / NSF rate, and stable-employment percentage? A property-management company in the area should have these aggregated.
- How much new for-sale + rental construction is in the pipeline within 1–3 miles? Heavy new supply typically softens prices + rents 12–24 months out; constrained supply supports both.
Investment metrics
- 1% rule
- 1.24% ✓
- Cap rate
- 9.75%
- Cash-on-cash
- 12.33%
- DSCR
- 1.55
- GRM
- 6.7
CMA / ARV
- ARV (median comp)
- $399,500
- List price
- $409,000
- Delta
- 2.38%
- Verdict
- FAIR
- Comps
- 20 within 1.0 mi
Show comp detail 12 sales within ~0.75 mi
| Address | Dist | Beds/Ba | Sqft | Sold | Price | $/sf | Match |
|---|---|---|---|---|---|---|---|
| 1085 Tasman Dr #708 | 0.00mi | 3/2.0 (-1) | 1,440 (-6%) | 0mo | $313,000 | $217 | 84 |
| 1225 Vienna Dr #150 | 0.28mi | 3/2.0 (-1) | 1,521 (-1%) | 3mo | $374,000 | $246 | 78 |
| 1225 Vienna Dr #114 | 0.20mi | 3/2.0 (-1) | 1,600 (+4%) | 2mo | $380,000 | $238 | 77 |
| 1085 Tasman Dr #620 | 0.00mi | 3/2.0 (-1) | 1,725 (+12%) | 1mo | $399,000 | $231 | 74 |
| 1225 Vienna Dr #44 | 0.28mi | 3/2.0 (-1) | 1,658 (+8%) | 1mo | $349,000 | $210 | 68 |
| 1225 Vienna Dr #604 | 0.20mi | 4/2.0 | 1,740 (+13%) | 1mo | $320,000 | $184 | 68 |
| 1220 Tasman Dr #142 | 0.42mi | 3/2.0 (-1) | 1,590 (+4%) | 3mo | $355,000 | $223 | 67 |
| 1220 Vienna Dr #707 | 0.26mi | 3/2.0 (-1) | 1,716 (+12%) | 2mo | $287,000 | $167 | 62 |
| 1225 Vienna Dr #141 | 0.28mi | 3/2.0 (-1) | 1,738 (+13%) | 2mo | $380,000 | $219 | 59 |
| 1225 Vienna Dr #375 | 0.25mi | 3/3.0 (-1) | 1,728 (+12%) | 3mo | $389,500 | $225 | 56 |
| 1225 Vienna Dr #336 | 0.33mi | 3/3.0 (-1) | 1,755 (+14%) | 0mo | $428,000 | $244 | 52 |
| 1220 Tasman Dr #124 | 0.52mi | 3/2.0 (-1) | 1,336 (-13%) | 2mo | $320,000 | $240 | 47 |
Match score weights: distance 35% · size 25% · config 20% · recency 20%. Top-matched comps best support the ARV.
Projected returns pro-forma
-3.0% appreciation · 2.63% rent growth · sell at horizon
- IRR
- -4.7%
- Equity multiple
- 0.83×
- Total profit
- $-20,036
- Equity at exit
- $60,983
- IRR
- 4.6%
- Equity multiple
- 1.33×
- Total profit
- $37,799
- Equity at exit
- $35,363
Cash invested: $114,520 (down + closing). Projections, not guarantees.
Landlord ↔ Tenant lean methodology
- Overall (STATE)
- 18 Strongly Tenant-Friendly
- State California
- 18 Strongly Tenant-Friendly · D+13
- County
- — inherits STATE
- City
- — inherits STATE
ZIP-level market 94089
- Home prices YoY
- -1.1%
- Rents YoY
- 2.6%
- Active inventory
- 69
- Price-to-rent
- 6.7×
Monthly cashflow live
- Estimated rent
- $5,067 high interval (Pro) →
- Mortgage (P&I)
- −$2,145
- Tax est. 1.5%
- −$511 /mo · $6,135/yr
- Insurance
- −$170
- Flood insurance flood zone
- −$427 /mo · $5,118/yr
- HOA
- −$0
- Vacancy / Maint / Mgmt
- −$1,064
- Net cashflow
- $750
Break-even live
UW: 25.0% down · 7.5% · 30yr · 1.5% tax · 5.0% vac · 8.0% maint · 8.0% mgmt
Financing live
Cash to close
- Down payment
- $102,250
- Closing costs
- $12,270
- Reserves months
- —
- Total cash needed
- —
Loan-product check · same deal, 3 products live
Conventional
25% down · 7.5% · 30yr
- Down + closing
- —
- Monthly P&I
- —
- Monthly cashflow
- —
- DSCR
- —
- Eligible?
- —
Personal DTI + credit; lowest rate.
DSCR
20% down · 8.5% · 30yr
- Down + closing
- —
- Monthly P&I
- —
- Monthly cashflow
- —
- DSCR
- —
- Eligible?
- —
No personal income docs; deal must DSCR.
Hard money
10% down · 12.0% · 12mo
- Down + closing
- —
- Monthly P&I
- —
- Monthly cashflow
- —
- DSCR
- —
- Eligible?
- —
Short-term bridge; refi at stabilization.
Rent comps 7 comps
| Address | Beds | Baths | Sqft | Rent | $/sqft | DOM | Units | Dist |
|---|---|---|---|---|---|---|---|---|
| 723 Lakehaven Dr #1516 Sunnyvale, CA | 5.0 | 3.0 | 1888 | $5,370 | $2.84 | 1d | 1 | 0.67mi |
| 1171 La Rochelle Ter Unit G Sunnyvale, CA | 3.0 | 2.5 | 2156 | $5,200 | $2.41 | 1d | 1 | 0.67mi |
| 568 Saco Ter Sunnyvale, CA | 4.0 | 3.0 | 1720 | $5,200 | $3.02 | 1d | 1 | 0.71mi |
| 550 E Weddell Dr Sunnyvale, CA | 1.0–3.0 | 1.0–2.0 | 1255 | $5,966 | $4.75 | 1d | 8 | 0.84mi |
| 1235 Wildwood Ave Sunnyvale, CA | 1.0–3.0 | 1.0–2.0 | 910 | $3,377 | $3.71 | 1d | 12 | 1.06mi |
| 781 N Fair Oaks Ave #6 Sunnyvale, CA | 3.0 | 2.0 | 1134 | $3,795 | $3.35 | 16d | 1 | 1.19mi |
| 1257 Lakeside Dr Sunnyvale, CA | 3.0 | 1.0–3.0 | 903 | $5,075 | $5.62 | 1d | 1 | 1.21mi |
Listing history 16 events
-
2026-06-18days on market $409,000 Active 80 DOM
-
2026-06-17days on market $409,000 Active 79 DOM
-
2026-06-16days on market $409,000 Active 78 DOM
-
2026-06-15days on market $409,000 Active 77 DOM
-
2026-06-13days on market $409,000 Active 75 DOM
-
2026-06-13pricedays on market $409,000 Active 74 DOM
-
2026-06-09days on market $419,000 Active 71 DOM
-
2026-06-08days on market $419,000 Active 70 DOM
-
2026-06-07days on market $419,000 Active 69 DOM
-
2026-06-05days on market $419,000 Active 66 DOM
-
2026-06-03days on market $419,000 Active 65 DOM
-
2026-06-02days on market $419,000 Active 64 DOM
-
2026-06-01days on market $419,000 Active 63 DOM
-
2026-05-31days on market $419,000 Active 62 DOM
-
2026-03-31$419,000 Active 879-char remark
Show marketing remark (879 chars)
Beautiful mobile home located in the highly desirable Casa de Amigos Mobile Home Park. This spacious residence features 3 bedrooms, 2 bathrooms, and a versatile bonus room that can be used as a home office, gym, game room or customized to fit your lifestyle. This beautiful mobile home also offers a clean, open layout either plenty of space for comfortable family living. Situated on a corner lot, it provides ample outdoor space perfect for hosting BBQs and entertaining guests. Casa de Amigos is a well-maintained community known for its friendly atmosphere while still offering privacy and security. Residents enjoy access to great amenities, including a gym, swimming pool, hot tub, and event space. Conveniently located near Silicon Valley, this property is surrounded by shopping centers, dining options and everyday conveniences, making it an ideal place to call it home.
ⓘ Source: listings_history table (triggers on properties + properties_extension) + one-shot
backfill from property_details.listing_events for pre-trigger history.
Climate risk First Street
- Flood 1/10 Low FEMA zone AE · 0% chance over 30 yrs
- Wildfire 1/10 Low
- Heat 5/10 Major 8 d/yr ≥91°F today · 16 d/yr by 30 yrs out
- Wind 1/10 Low
- Air quality 7/10 Severe 13 unhealthy d/yr today · 13 by 30 yrs out
Nearby sold comps map
Loading sold comps map…
Walkable amenities ~0.75 mi
Loading nearby amenities…
Taxation est. · year 1
- Rental income
- $60,809
- − Mortgage interest
- −$22,910
- − Property taxes
- −$6,135
- − Insurance
- −$7,164
- − Repairs & maintenance
- −$4,865
- − Management
- −$4,865
- − Depreciation
- −$11,898
- Taxable income
- $2,972
- Est. tax owed @ 24.0%
- −$713
- After-tax cash flow
- $8,289/yr
For passive investors: Depreciation is non-cash, so a rental often shows a tax loss while cash-flowing — sheltering income. Rental losses are passive: they offset passive income freely, and up to $25,000/yr can offset ordinary (W-2) income if you actively participate and your MAGI is under $100k (phasing out to $0 by $150k); unused losses carry forward. On sale, claimed depreciation is recaptured at up to 25%, and gains may owe capital-gains tax (a 1031 exchange can defer both). Figures are a year-1 estimate at your 24.0% rate — not tax advice; consult a CPA.
Schools (NCES district)
- District
- Santa Clara Unified
- NCES district ID
- 0635430
- Math proficiency
- 49% ▼ -3.00%
- Reading proficiency
- 66% ▲ 4.00%
- Median HH income
- $97,320
- Composite
- 53.46/100
- National rank
- #1459
- State rank
- #75 of 517 in CA
Livability — Sunnyvale
- Score
- 82/100
- State rank
- #37
- US rank
- #1258
Category grades
Schools grade is shown separately in the Schools card above.
Census & demographics
- Census place
- Sunnyvale, CA
- County
- Santa Clara County · 1,806,974 people
- City population
- 154,236
- Metro
- San Jose-Sunnyvale-Santa Clara, CA
- Population (ZIP)
- 22,699
- Household income
- $158,304
- Rent vs Own
- Severe rent burden
- 558.0
Population outlook (Santa Clara County) Hauer SSP2
- Today (2025)
- 2,179,074 people
- By 2030
- 2,301,297 · +5.6%
- By 2040
- 2,528,195 · +16.0%
- By 2050
- 2,712,135 · +24.5%
- By 2075
- 2,998,701 · +37.6%
- By 2100
- 2,931,429 · +34.5%
Race, ethnicity, and origin ACS 2023
- Neighborhood character
- Diverse neighborhood (Simpson 0.68)
- Race & ethnicity
- Asian 45% White 24% Hispanic / Latino 24% Two or more races 9% Black 2%
- Hispanic origin (detail)
- Mexican 17%
- Common ancestry
- Scotch-Irish 2% Lithuanian 1% Estonian 1%
- Foreign-born
- 51% · Canada, China, Vietnam
- Languages at home
- 40% English-only · Spanish 18% Chinese 12% Other Asian/Pacific 8%
Political lean MEDSL · Santa Clara
- 2024 margin
- Solid D (+40.0) · D 68.1% · R 28.1% · Other 3.8%
- 2008→2024 swing
- -0.9pp no change · 2008: 40.9pp · 2024: 40.0pp
- All cycles
- 2024: D+40.0 2020: D+47.4 2016: D+52.5 2012: D+42.1 2008: D+40.9
Not yet ingested
- Civics
- —
Market trends
- HPI YoY
- ▼ -3.70%
- Current HPI
- 338.6935
- Rent YoY
- ▲ 2.63%
- Metro
- San Jose-Sunnyvale-Santa Clara, CA
- State GDP YoY
- ▲ 3.21%
- F500 in state
- 116
Industry mix (Fortune 500 HQ in CA)
| Industry | F500 HQs | Revenue |
|---|---|---|
| Technology | 27 | $1,492B |
|
||
| Financial Services | 3 | $174B |
|
||
| Retail | 3 | $44B |
|
||
| Insurance | 3 | $26B |
|
||
| Media / Entertainment | 2 | $115B |
|
||
| Pharmaceuticals / Biotech | 2 | $62B |
|
||
Price history
+0.0% since first listed2 events — show timeline
- 2026-03-31 Listed $419,000 bridgeMLS, Bay East AOR, or Contra Costa AOR
- 2026-03-31 Listed $419,000 MLSListings
Property tax history
-10.3%/yrLatest (2011): $536 · -9.5% YoY. Source: county tax records.
Cash-flow waterfall
monthlySold comps — $/sqft
last 12 mo · ≤1 miLoading sold comps…