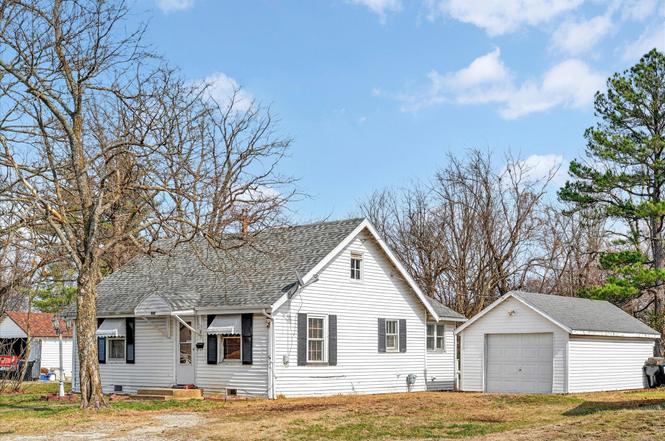
440 S White Oak Rd · Marshfield, MO
Flood risk 1/10 · Minimal
- FEMA flood zone
- X (unshaded)
- Chance of flooding over 30 yrs
- 0.0%
- Est. flood insurance / yr
- $507 – $1,088
Fire risk 4/10 · Minor
- Est. fire insurance / yr
- $1,054 – $1,958
Heat risk 4/10 · Minor
- Hot days now (above 105°F)
- 7 days/yr
- Hot days in 30 yrs
- 19 days/yr
Wind risk 2/10 · Minimal
- Chance of severe wind over 30 yrs
- 1.0%
Air-quality risk 2/10 · Minimal
- Unhealthy air days now
- 0 days/yr
- Unhealthy air days in 30 yrs
- 1 days/yr
Risk factors via First Street. Map © Google.
Why this score? — see what drove the C grade
The composite is a weighted blend of 9 inputs, each scored 0–100. Each bar is that input's sub-score; the figure is the points it added to the 100-point composite (weight × sub-score).
- Cash flow +20.1/30.0
- ARV discount +15.0/15.0
- DSCR +6.4/10.0
- 1% rule +5.3/10.0
- Livability +3.5/5.0
- Schools +3.0/10.0
- Rent growth +2.5/5.0
- Condition / age +2.5/5.0
- Appreciation +0.0/10.0
$89,900
🖨 Deal sheet 📄 Offer letter ✓ Due diligence
Listing remarks
Discover the potential in this 3-bedroom, 1-bath home located in the heart of Marshfield. Featuring a detached single-car garage and a functional layout, this property is a prime opportunity for investors or savvy buyers looking to add value and maximize returns. With strong rental demand and room for updates or improvements, this home offers the perfect canvas to renovate, rent, or resell for profit. Whether you're expanding your investment portfolio or searching for your next flip, this Marshfield property is full of possibilities and ready to deliver solid returns.
Key facts
- 9,583 sq ft lot
- Garage
- Built 1940
Neighborhood map
What this means for you Summary
Snapshot
- This is a 3-bed/1.0-bath single-family listed at $90k.
Deal economics
- At list price, monthly cash flow is $112 ($1k/yr) — positive.
- The deal already cash-flows at list — no discount required.
- Meets the 1% rule at list price ($928 rent vs $90k).
- Recommended offer: $87k (3.0% below list) — sets the bar for market timing.
- Cap rate 7.8% vs local median 2.7% in Marshfield — top-decile yield for the area; either an underpriced asset or a hidden risk that comps aren't pricing in. Stress-test before assuming the spread holds.
Location & tenants
- Location reads 70/100 on livability (#137 in MO) — a middle-class / working-renter tenant base. Strengths: cost of living A+, housing A+, crime B; Watch: employment D+, amenities F, commute F.
- Marshfield R-I (town): math 32% / reading 39% proficiency, ranked #209 of 324 in MO (top 64%) — families likely to look elsewhere, expect single-tenant / working-renter base with shorter leases.
- Zoned schools: Marshfield Early Learning Cntr (174 students, 35% FRL); Marshfield Jr. High (math 35% / reading 40%, grade F, #215 of 391 statewide, top 56%, 670 students, 45% FRL); Marshfield High (math 27% / reading 45%, grade F, #313 of 521 statewide, top 60%, 916 students, 40% FRL) — zoned schools at 40% FRL track the district average.
- Market conditions: 135 active listings in the ZIP; 2 comparable units currently listed for rent nearby; 168 units permitted in Webster County in 2024 (24 in 5+ unit buildings).
Forward outlook
- Local home prices are declining (-3.0%/yr); year-one equity from $622 of loan paydown is wiped out by about $3k of value loss. Plan a longer hold.
- Webster County population projected at +5% by 2050 — modest demand growth; plan on rents tracking national, not racing it.
Negotiation context
- It's been on market 39 days — a 3% lower offer ($87k) is reasonable based on typical stale-listing flexibility.
Risks & watch-outs
- Watch-outs: built in 1940 — expect roof / HVAC / electrical / plumbing capex.
Questions for the listing agent
- It's been on market 39 days. Have you received any prior offers? Is the seller open to a 3% concession, seller financing, or rate buy-down credit?
- Built in 1940 — when were the roof, HVAC, electrical panel, plumbing, and water heater last replaced?
- Is there a deadline driving the sale (1031 exchange, divorce, estate, relocation)? That informs how much negotiation room exists.
- Schools are D-rated, which usually means shorter tenancies and higher turnover. Who's the typical renter profile here, and what's been the actual vacancy rate?
- What's the average days-on-market for RENTAL listings here right now (not sales)? A rising rental-DOM trend means longer vacancies and softer asking-rent achievability than the comps imply.
- What's the recent tenant-quality profile in this submarket — average credit score on applications, eviction rate, late-payment / NSF rate, and stable-employment percentage? A property-management company in the area should have these aggregated.
- How much new for-sale + rental construction is in the pipeline within 1–3 miles? Heavy new supply typically softens prices + rents 12–24 months out; constrained supply supports both.
Investment metrics
- 1% rule
- 1.03% ✓
- Cap rate
- 7.79%
- Cash-on-cash
- 5.33%
- DSCR
- 1.24
- GRM
- 8.1
CMA / ARV
- ARV (on-the-fly)
- $150,766
- Comps found
- 12
Show comp detail 12 sales within ~0.75 mi
| Address | Dist | Beds/Ba | Sqft | Sold | Price | $/sf | Match |
|---|---|---|---|---|---|---|---|
| 440 S White Oak Rd | 0.00mi | 3/1.0 | 979 (0%) | 1mo | $89,900 | $92 | 100 |
| 457 W Burford St | 0.49mi | 3/1.0 | 960 (-2%) | 1mo | $149,900 | $156 | 73 |
| 256 E 2nd St | 0.41mi | 2/1.0 (-1) | 996 (+2%) | 1mo | $129,900 | $130 | 72 |
| 529 E Mcvay St | 0.67mi | 3/1.0 | 960 (-2%) | 2mo | $167,900 | $175 | 64 |
| 313 N Mill St | 0.46mi | 3/1.0 | 1,048 (+7%) | 11mo | $167,000 | $159 | 58 |
| 415 N Pine St | 0.70mi | 2/1.0 (-1) | 972 (-1%) | 5mo | $110,000 | $113 | 57 |
| 127 Wilson Way | 0.48mi | 3/1.0 | 1,056 (+8%) | 12mo | $175,000 | $166 | 55 |
| 333 N Clay St | 0.50mi | 2/1.0 (-1) | 1,064 (+9%) | 11mo | $140,000 | $132 | 48 |
| 359 E Bedford St | 0.73mi | 3/2.0 | 1,056 (+8%) | 2mo | $214,900 | $204 | 47 |
| 109 N Pine St | 0.56mi | 2/1.0 (-1) | 876 (-10%) | 10mo | $135,000 | $154 | 43 |
| 305 W Bedford St | 0.57mi | 2/1.0 (-1) | 863 (-12%) | 9mo | $127,900 | $148 | 41 |
| 421 E Burford St | 0.73mi | 2/1.0 (-1) | 1,109 (+13%) | 8mo | $127,000 | $115 | 32 |
Match score weights: distance 35% · size 25% · config 20% · recency 20%. Top-matched comps best support the ARV.
Projected returns pro-forma
-3.0% appreciation · 3.0% rent growth · sell at horizon
- IRR
- -8.0%
- Equity multiple
- 0.70×
- Total profit
- $-7,433
- Equity at exit
- $13,404
- IRR
- 1.5%
- Equity multiple
- 1.11×
- Total profit
- $2,753
- Equity at exit
- $7,773
Cash invested: $25,172 (down + closing). Projections, not guarantees.
Landlord ↔ Tenant lean methodology
- Overall (STATE)
- 81 Strongly Landlord-Friendly
- State Missouri
- 81 Strongly Landlord-Friendly · R+10
- County
- — inherits STATE
- City
- — inherits STATE
ZIP-level market 65706
- Home prices YoY
- -18.7%
- Active inventory
- 135
- Price-to-rent
- 8.1×
Monthly cashflow live
- Estimated rent
- $928 medium interval (Pro) →
- Mortgage (P&I)
- −$471
- Tax est. 1.5%
- −$112 /mo · $1,348/yr
- Insurance
- −$37
- HOA
- −$0
- Vacancy / Maint / Mgmt
- −$195
- Net cashflow
- $112
Break-even live
UW: 25.0% down · 7.5% · 30yr · 1.5% tax · 5.0% vac · 8.0% maint · 8.0% mgmt
Financing live
Cash to close
- Down payment
- $22,475
- Closing costs
- $2,697
- Reserves months
- —
- Total cash needed
- —
Loan-product check · same deal, 3 products live
Conventional
25% down · 7.5% · 30yr
- Down + closing
- —
- Monthly P&I
- —
- Monthly cashflow
- —
- DSCR
- —
- Eligible?
- —
Personal DTI + credit; lowest rate.
DSCR
20% down · 8.5% · 30yr
- Down + closing
- —
- Monthly P&I
- —
- Monthly cashflow
- —
- DSCR
- —
- Eligible?
- —
No personal income docs; deal must DSCR.
Hard money
10% down · 12.0% · 12mo
- Down + closing
- —
- Monthly P&I
- —
- Monthly cashflow
- —
- DSCR
- —
- Eligible?
- —
Short-term bridge; refi at stabilization.
Rent comps 2 comps
| Address | Beds | Baths | Sqft | Rent | $/sqft | DOM | Units | Dist |
|---|---|---|---|---|---|---|---|---|
| 301 W Maple St Unit 104 Marshfield, MO | 2.0 | 1.0 | 900 | $950 | $1.06 | 43d | 1 | 0.15mi |
| 511 Church St Unit 207 Marshfield, MO | 2.0 | 1.0 | 650 | $725 | $1.12 | 23d | 1 | 1.02mi |
Listing history 3 events
-
2026-04-12status Pending
-
2026-03-20price $89,900
-
2026-03-04$99,900 Active
ⓘ Source: listings_history table (triggers on properties + properties_extension) + one-shot
backfill from property_details.listing_events for pre-trigger history.
Climate risk First Street
- Flood 1/10 Low FEMA zone X (unshaded) · 0% chance over 30 yrs
- Wildfire 4/10 Moderate
- Heat 4/10 Moderate 7 d/yr ≥105°F today · 19 d/yr by 30 yrs out
- Wind 2/10 Low 100% chance of damaging wind over 30 yrs
- Air quality 2/10 Low 0 unhealthy d/yr today · 1 by 30 yrs out
Nearby sold comps map
Loading sold comps map…
Walkable amenities ~0.75 mi
Loading nearby amenities…
Taxation est. · year 1
- Rental income
- $11,135
- − Mortgage interest
- −$5,036
- − Property taxes
- −$1,348
- − Insurance
- −$450
- − Repairs & maintenance
- −$891
- − Management
- −$891
- − Depreciation
- −$2,615
- Taxable loss
- −$95
- Est. tax savings @ 24.0%
- +$23
- After-tax cash flow
- $1,365/yr
For passive investors: Depreciation is non-cash, so a rental often shows a tax loss while cash-flowing — sheltering income. Rental losses are passive: they offset passive income freely, and up to $25,000/yr can offset ordinary (W-2) income if you actively participate and your MAGI is under $100k (phasing out to $0 by $150k); unused losses carry forward. On sale, claimed depreciation is recaptured at up to 25%, and gains may owe capital-gains tax (a 1031 exchange can defer both). Figures are a year-1 estimate at your 24.0% rate — not tax advice; consult a CPA.
Schools (NCES district)
- District
- Marshfield R-I
- NCES district ID
- 2920430
- Math proficiency
- 32% ▼ -7.00%
- Reading proficiency
- 39% ▼ -3.00%
- Median HH income
- $44,061
- Composite
- 30.17/100
- National rank
- #6320
- State rank
- #209 of 324 in MO
Livability — Marshfield
- Score
- 70/100
- State rank
- #137
- US rank
- #7803
Category grades
Schools grade is shown separately in the Schools card above.
Census & demographics
- Census place
- Marshfield, MO
- Population (ZIP)
- 17,479
Population outlook (Webster County) Hauer SSP2
- Today (2025)
- 39,400 people
- By 2030
- 40,125 · +1.8%
- By 2040
- 41,169 · +4.5%
- By 2050
- 41,286 · +4.8%
- By 2075
- 40,104 · +1.8%
- By 2100
- 33,683 · -14.5%
Race, ethnicity, and origin ACS 2023
- Neighborhood character
- Predominantly White (91%)
- Race & ethnicity
- White 91% Two or more races 6% Hispanic / Latino 2% Black 2%
- Common ancestry
- Slovak 2% Lithuanian 1% Iranian 1%
- Foreign-born
- 1%
- Languages at home
- 99% English-only · Spanish 1%
Political lean MEDSL · Webster
- 2024 margin
- Solid R (+62.2) · D 18.4% · R 80.7%
- 2008→2024 swing
- -33.2pp toward R · 2008: -29.0pp · 2024: -62.2pp
- All cycles
- 2024: R+62.2 2020: R+60.2 2016: R+57.9 2012: R+40.8 2008: R+29.0
Not yet ingested
- Civics
- —
Market trends
- HPI YoY
- ▼ -54.05%
- Current HPI
- 235.6143
- Rent YoY
- —
- Metro
- —
- State GDP YoY
- ▲ 1.84%
- F500 in state
- 20
Industry mix (Fortune 500 HQ in MO)
| Industry | F500 HQs | Revenue |
|---|---|---|
| Healthcare | 1 | $163B |
|
||
| Insurance | 1 | $21B |
|
||
| Industrial Technology | 1 | $17B |
|
||
| Retail | 1 | $16B |
|
||
| Industrial Distribution | 1 | $10B |
|
||
| Utilities | 1 | $9B |
|
||
Price history
-10.0% since first listed3 events — show timeline
- 2026-04-12 Pending — SOMO
- 2026-03-20 Price Changed $89,900 SOMO
- 2026-03-04 Listed $99,900 SOMO
Cash-flow waterfall
monthlySold comps — $/sqft
last 12 mo · ≤1 miLoading sold comps…