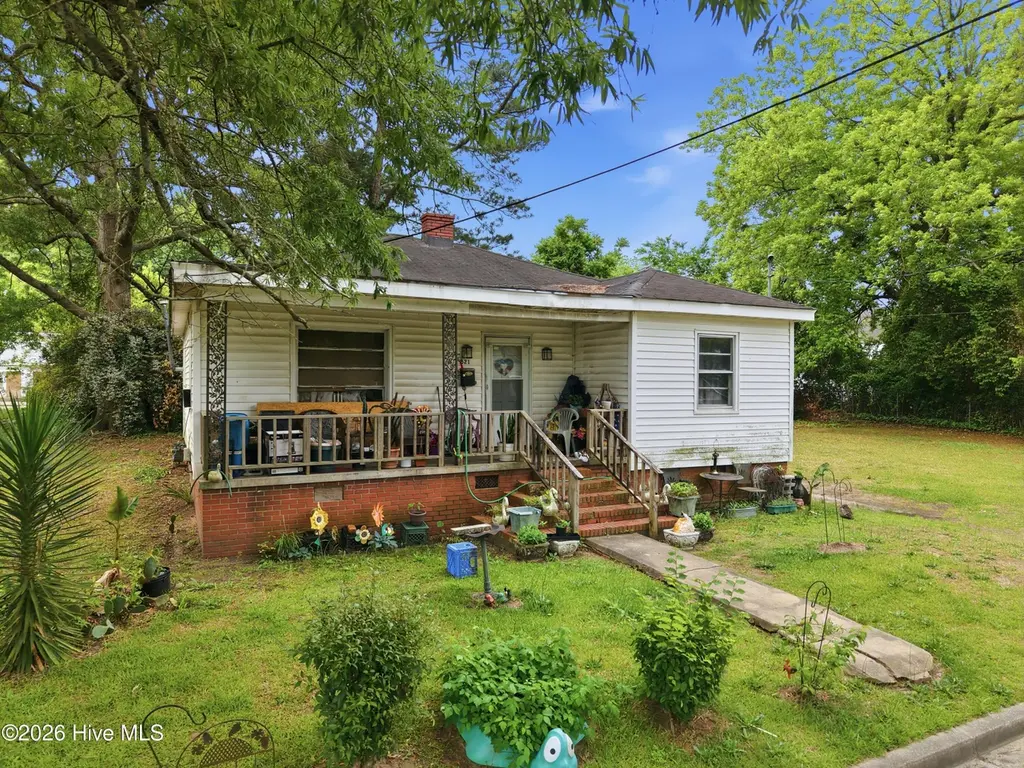
621 Harvey St · Kinston, NC
Flood risk 6/10 · Moderate
- FEMA flood zone
- X (unshaded)
- Chance of flooding over 30 yrs
- 0.68%
- Est. flood insurance / yr
- $507 – $1,088
Fire risk 3/10 · Minor
- Est. fire insurance / yr
- $906 – $1,684
Heat risk 8/10 · Major
- Hot days now (above 105°F)
- 7 days/yr
- Hot days in 30 yrs
- 18 days/yr
Wind risk 8/10 · Major
- Chance of severe wind over 30 yrs
- 80.0%
Air-quality risk 2/10 · Minimal
- Unhealthy air days now
- 2 days/yr
- Unhealthy air days in 30 yrs
- 2 days/yr
Risk factors via First Street. Map © Google.
Why this score? — see what drove the B- grade
The composite is a weighted blend of 9 inputs, each scored 0–100. Each bar is that input's sub-score; the figure is the points it added to the 100-point composite (weight × sub-score).
- Cash flow +30.0/30.0
- DSCR +10.0/10.0
- 1% rule +8.4/10.0
- ARV discount +7.5/15.0
- Livability +2.8/5.0
- Rent growth +2.5/5.0
- Schools +2.5/10.0
- Condition / age +2.5/5.0
- Appreciation +0.0/10.0
$60,000
🖨 Deal sheet 📄 Offer letter ✓ Due diligence
Listing remarks
Great investment opportunity in Kinston NC! 621 Harvey St plus an adjacent vacant lot at 619 Harvey St. This 3 bedroom, 1 bath home offers approximately 1,108 soft of living space and is ready for your vision. Whether looking for your next fix and flip, rental property, or Reno-project this one has very strong potential. Conveniently located near shopping, schools, and local amenities. This property is being sold as-is, ! Don't miss out! Cash Offer!
Key facts
- 3,049 sq ft lot
- Built 1955
- Listed 16 days
Property features AI
Finance
- Other: Zoning: RA5
Exterior
- Parking: Unpaved parking
- Security: Smoke detector(s)
- Utilities: Utilities listed as other; Road frontage on city street and state road
- Home design: Single-family residence; One story, entry level at first floor; Has a view; Residential property
- Construction: Concrete and vinyl siding exterior; Brick/mortar foundation; Shingle roof; Built as a single-story structure
- Exterior features: Front porch; No additional exterior features listed; No pool
Interior
- Kitchen: No kitchen appliance details provided
- Bedrooms: 4 total rooms
- Flooring: Carpet
- Bathrooms: 1 full bathroom
- Heating & cooling: Wall/window air conditioning units; Heating system listed as other
- Interior features: Carpet flooring; No basement
- Laundry & utility: Washer hookup
Neighborhood map
What this means for you Summary
Snapshot
- This is a 3-bed/1.0-bath single-family listed at $60k.
Deal economics
- At list price, monthly cash flow is $224 ($3k/yr) — positive.
- The deal already cash-flows at list — no discount required.
- Meets the 1% rule at list price ($806 rent vs $60k).
- Recommended offer: $59k (1.5% below list) — sets the bar for market timing.
- Cap rate 10.8% vs local median 3.8% in Kinston — top-decile yield for the area; either an underpriced asset or a hidden risk that comps aren't pricing in. Stress-test before assuming the spread holds.
Location & tenants
- Location reads 55/100 on livability (#640 in NC) — a working-class tenant base; expect higher turnover. Strengths: cost of living A+, health & safety A+, housing B+; Watch: crime F, amenities F, commute F.
- Lenoir County Public Schools (rural): math 29% / reading 32% proficiency, ranked #147 of 178 in NC (top 83%) — families likely to look elsewhere, expect single-tenant / working-renter base with shorter leases; 65% free/reduced lunch — lower-income household profile, screen leases tightly.
- Zoned schools: Rochelle Middle (math 9% / reading 20%, grade F, #462 of 475 statewide, top 98%, 466 students, 98% FRL); Kinston High (math 22% / reading 37%, grade F, #459 of 535 statewide, top 87%, 713 students, 100% FRL) — zoned schools average 99% FRL vs 65% district-wide (34 pts higher); higher-poverty schools than district average — tighter screening recommended.
- Market conditions: 95 active listings in the ZIP; 5 comparable units currently listed for rent nearby; rentals at typical pace (median 21d on market — plan ~3-4 weeks tenant-placement turnaround); 148 units permitted in Lenoir County in 2024 (0 in 5+ unit buildings).
Forward outlook
- Local home prices are declining (-3.0%/yr); year-one equity from $415 of loan paydown is wiped out by about $2k of value loss. Plan a longer hold.
- Lenoir County population projected at -18% by 2050 — secular population decline; favor cash flow + early exit over multi-decade hold.
- At projected returns (-3.0% appreciation + 3.0% rent growth), your $17k cash investment doubles in ~8 years — after that, you're playing with house money.
Negotiation context
- It's been on market 17 days — a 2% lower offer ($59k) is reasonable based on typical stale-listing flexibility.
Risks & watch-outs
- Watch-outs: built in 1955 — expect roof / HVAC / electrical / plumbing capex.
- Climate carrying-cost: major flood risk; severe wind risk, 80% chance of damaging wind over 30y; extreme-heat days projected 7→18/yr by 2055 (HVAC capex compounding) — expect insurance premiums to compound above CPI over the hold.
Questions for the listing agent
- Built in 1955 — when were the roof, HVAC, electrical panel, plumbing, and water heater last replaced?
- Is there a deadline driving the sale (1031 exchange, divorce, estate, relocation)? That informs how much negotiation room exists.
- Schools are F-rated, which usually means shorter tenancies and higher turnover. Who's the typical renter profile here, and what's been the actual vacancy rate?
- Crime grade is F in this area — have there been break-ins, vandalism, or insurance claims at this property in the last 3 years? What carrier currently insures it and at what premium?
- What's the average days-on-market for RENTAL listings here right now (not sales)? A rising rental-DOM trend means longer vacancies and softer asking-rent achievability than the comps imply.
- What's the recent tenant-quality profile in this submarket — average credit score on applications, eviction rate, late-payment / NSF rate, and stable-employment percentage? A property-management company in the area should have these aggregated.
- How much new for-sale + rental construction is in the pipeline within 1–3 miles? Heavy new supply typically softens prices + rents 12–24 months out; constrained supply supports both.
Investment metrics
- 1% rule
- 1.34% ✓
- Cap rate
- 10.76%
- Cash-on-cash
- 15.96%
- DSCR
- 1.71
- GRM
- 6.2
CMA / ARV
- ARV (on-the-fly)
- $36,564
- Comps found
- 11
Show comp detail 11 sales within ~0.75 mi
| Address | Dist | Beds/Ba | Sqft | Sold | Price | $/sf | Match |
|---|---|---|---|---|---|---|---|
| 603 N Adkin St | 0.18mi | 3/1.0 | 1,088 (-2%) | 1mo | $28,000 | $26 | 87 |
| 641 Fields St | 0.08mi | 2/1.0 (-1) | 1,100 (-1%) | 6mo | $35,000 | $32 | 85 |
| 1105 N East St | 0.42mi | 3/1.0 | 1,104 (-0%) | 1mo | $35,000 | $32 | 79 |
| 206 E Vernon Ave | 0.47mi | 3/1.0 | 1,052 (-5%) | 1mo | $35,000 | $33 | 69 |
| 554 Dr Martin Luther King Jr Blvd | 0.17mi | 3/1.0 | 948 (-14%) | 9mo | $25,000 | $26 | 61 |
| 1000 Liberty Hill Rd | 0.36mi | 2/1.0 (-1) | 1,145 (+3%) | 16mo | $65,000 | $57 | 59 |
| 1113 Morningside Dr | 0.45mi | 2/1.0 (-1) | 1,145 (+3%) | 12mo | $35,000 | $31 | 58 |
| 602 Meadows Ln | 0.36mi | 3/1.0 | 970 (-12%) | 6mo | $60,500 | $62 | 57 |
| 1204 Morningside Dr | 0.57mi | 3/1.0 | 1,242 (+12%) | 1mo | $175,000 | $141 | 52 |
| 203 Park Ave | 0.54mi | 2/1.0 (-1) | 1,120 (+1%) | 22mo | $113,000 | $101 | 50 |
| 724 Fields St | 0.14mi | 3/1.5 | 1,272 (+15%) | 21mo | $136,000 | $107 | 49 |
Match score weights: distance 35% · size 25% · config 20% · recency 20%. Top-matched comps best support the ARV.
Projected returns pro-forma
-3.0% appreciation · 3.0% rent growth · sell at horizon
- IRR
- 6.9%
- Equity multiple
- 1.27×
- Total profit
- $4,524
- Equity at exit
- $8,946
- IRR
- 16.2%
- Equity multiple
- 2.33×
- Total profit
- $22,315
- Equity at exit
- $5,188
Cash invested: $16,800 (down + closing). Projections, not guarantees.
Landlord ↔ Tenant lean methodology
- Overall (STATE)
- 85 Strongly Landlord-Friendly
- State North Carolina
- 85 Strongly Landlord-Friendly · R+3
- County
- — inherits STATE
- City
- — inherits STATE
ZIP-level market 28501
- Home prices YoY
- -18.9%
- Active inventory
- 95
- Price-to-rent
- 6.2×
Monthly cashflow live
- Estimated rent
- $806 high interval (Pro) →
- Mortgage (P&I)
- −$315
- Tax from tax record
- −$74 /mo · $884/yr
- Insurance
- −$25
- HOA
- −$0
- Vacancy / Maint / Mgmt
- −$169
- Net cashflow
- $224
Break-even live
UW: 25.0% down · 7.5% · 30yr · 1.5% tax · 5.0% vac · 8.0% maint · 8.0% mgmt
Financing live
Cash to close
- Down payment
- $15,000
- Closing costs
- $1,800
- Reserves months
- —
- Total cash needed
- —
Loan-product check · same deal, 3 products live
Conventional
25% down · 7.5% · 30yr
- Down + closing
- —
- Monthly P&I
- —
- Monthly cashflow
- —
- DSCR
- —
- Eligible?
- —
Personal DTI + credit; lowest rate.
DSCR
20% down · 8.5% · 30yr
- Down + closing
- —
- Monthly P&I
- —
- Monthly cashflow
- —
- DSCR
- —
- Eligible?
- —
No personal income docs; deal must DSCR.
Hard money
10% down · 12.0% · 12mo
- Down + closing
- —
- Monthly P&I
- —
- Monthly cashflow
- —
- DSCR
- —
- Eligible?
- —
Short-term bridge; refi at stabilization.
Rent comps 5 comps
| Address | Beds | Baths | Sqft | Rent | $/sqft | DOM | Units | Dist |
|---|---|---|---|---|---|---|---|---|
| 705 Harvey St Kinston, NC | 2.0 | 1.0 | 896 | $700 | $0.78 | 20d | 1 | 0.08mi |
| 503 N Queen St Kinston, NC | 1.0–2.0 | 2.0 | 759 | $723 | $0.95 | 13d | 8 | 0.57mi |
| 1204 Desmond St Kinston, NC | 3.0 | 1.0 | 1100 | $1,340 | $1.22 | 20d | 1 | 0.84mi |
| 619 S Heritage St Kinston, NC | 1.0–2.0 | 2.0 | 1025 | $1,042 | $1.02 | 13d | 4 | 1.11mi |
| 100 Wingate Dr Kinston, NC | 2.0–3.0 | 1.0–1.5 | 930 | $975 | $1.05 | 20d | 1 | 1.11mi |
Listing history 13 events
-
2026-06-19days on market $60,000 Active 17 DOM
-
2026-06-18days on market $60,000 Active 16 DOM
-
2026-06-17days on market $60,000 Active 15 DOM
-
2026-06-16days on market $60,000 Active 14 DOM
-
2026-06-15days on market $60,000 Active 13 DOM
-
2026-06-14days on market $60,000 Active 11 DOM
-
2026-06-12days on market $60,000 Active 10 DOM
-
2026-06-09days on market $60,000 Active 7 DOM
-
2026-06-08days on market $60,000 Active 6 DOM
-
2026-06-07days on market $60,000 Active 5 DOM
-
2026-06-07days on market $60,000 Active 4 DOM
-
2026-06-03remarks 453-char remark
-
2026-06-03$60,000 Active 1 DOM
ⓘ Source: listings_history table (triggers on properties + properties_extension) + one-shot
backfill from property_details.listing_events for pre-trigger history.
Tax reassessment forecast NC · Resets to sale price
- Current annual tax
- $884 · $74/mo
- Projected year-2 tax
- $884 · $74/mo
- Expected delta
- $0/yr ($0/mo · 0.0%)
ⓘ Screening estimate from a state-policy table — verify with the county assessor before closing.
Climate risk First Street
- Flood 6/10 Major FEMA zone X (unshaded) · 68% chance over 30 yrs
- Wildfire 3/10 Moderate
- Heat 8/10 Severe 7 d/yr ≥105°F today · 18 d/yr by 30 yrs out
- Wind 8/10 Severe 80% chance of damaging wind over 30 yrs
- Air quality 2/10 Low 2 unhealthy d/yr today · 2 by 30 yrs out
Nearby sold comps map
Loading sold comps map…
Walkable amenities ~0.75 mi
Loading nearby amenities…
Taxation est. · year 1
- Rental income
- $9,673
- − Mortgage interest
- −$3,361
- − Property taxes
- −$884
- − Insurance
- −$300
- − Repairs & maintenance
- −$774
- − Management
- −$774
- − Depreciation
- −$1,745
- Taxable income
- $1,835
- Est. tax owed @ 24.0%
- −$440
- After-tax cash flow
- $2,242/yr
For passive investors: Depreciation is non-cash, so a rental often shows a tax loss while cash-flowing — sheltering income. Rental losses are passive: they offset passive income freely, and up to $25,000/yr can offset ordinary (W-2) income if you actively participate and your MAGI is under $100k (phasing out to $0 by $150k); unused losses carry forward. On sale, claimed depreciation is recaptured at up to 25%, and gains may owe capital-gains tax (a 1031 exchange can defer both). Figures are a year-1 estimate at your 24.0% rate — not tax advice; consult a CPA.
Schools (NCES district)
- District
- Lenoir County Public Schools
- NCES district ID
- 3702610
- Math proficiency
- 29% ▲ 1.00%
- Reading proficiency
- 32% ▼ -4.00%
- Median HH income
- $34,958
- Composite
- 25.17/100
- National rank
- #7515
- State rank
- #147 of 178 in NC
Livability — Kinston
- Score
- 55/100
- State rank
- #640
- US rank
- #23267
Category grades
Schools grade is shown separately in the Schools card above.
Census & demographics
- Census place
- Kinston, NC
- City population
- 20,407
- Population (ZIP)
- 18,112
Population outlook (Lenoir County) Hauer SSP2
- Today (2025)
- 55,002 people
- By 2030
- 53,048 · -3.6%
- By 2040
- 49,041 · -10.8%
- By 2050
- 45,136 · -17.9%
- By 2075
- 36,547 · -33.6%
- By 2100
- 27,731 · -49.6%
Race, ethnicity, and origin ACS 2023
- Neighborhood character
- Majority Black (62%)
- Race & ethnicity
- Black 62% White 26% Two or more races 6% Hispanic / Latino 5%
- Common ancestry
- Serbian 1% Italian 1%
- Foreign-born
- 2% · Canada, China
- Languages at home
- 95% English-only · Spanish 5%
Political lean MEDSL · Lenoir
- 2024 margin
- Lean R (+6.8) · D 46.2% · R 53.0%
- 2008→2024 swing
- -6.7pp toward R · 2008: -0.1pp · 2024: -6.8pp
- All cycles
- 2024: R+6.8 2020: R+3.5 2016: R+6.3 2012: R+1.5 2008: R+0.1
Not yet ingested
- Civics
- —
Market trends
- HPI YoY
- ▼ -45.17%
- Current HPI
- 193.3213
- Rent YoY
- —
- Metro
- —
- State GDP YoY
- ▲ 3.28%
- F500 in state
- 26
Industry mix (Fortune 500 HQ in NC)
| Industry | F500 HQs | Revenue |
|---|---|---|
| Financial Services | 2 | $213B |
|
||
| Retail | 2 | $95B |
|
||
| Industrial Conglomerate | 1 | $38B |
|
||
| Metals / Steel | 1 | $35B |
|
||
| Utilities | 1 | $30B |
|
||
| Industrial Machinery | 1 | $19B |
|
||
Price history
1 event — show timeline
- 2026-04-03 Listed $60,000 Hive MLS
Property tax history
+9.9%/yrLatest (2025): $884 · +294.3% YoY. Source: county tax records.
Cash-flow waterfall
monthlySold comps — $/sqft
last 12 mo · ≤1 miLoading sold comps…