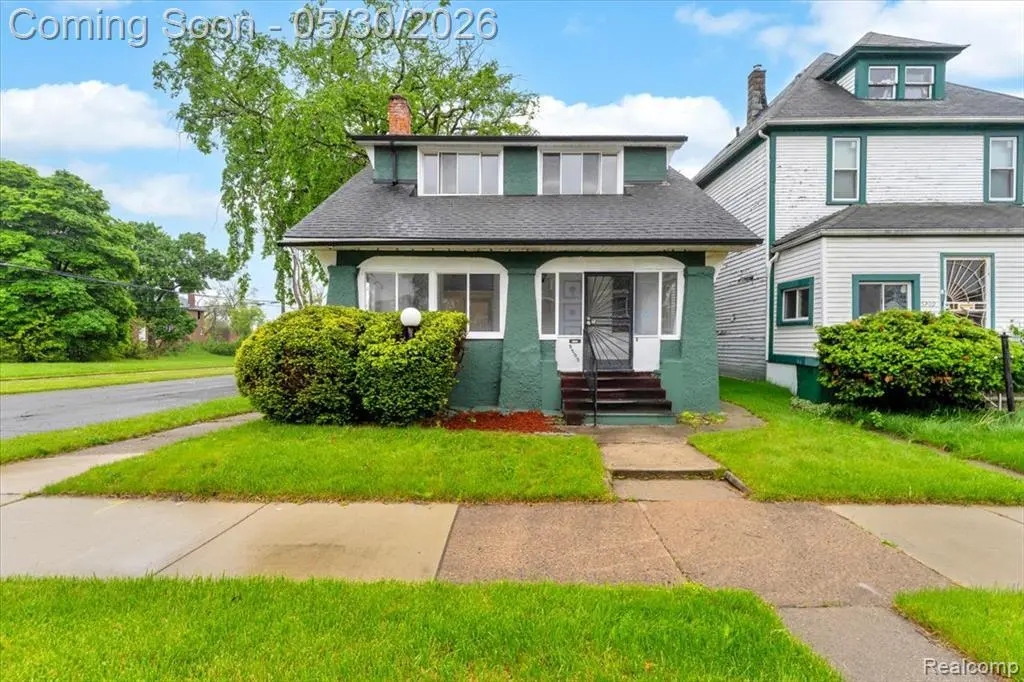
5203 Maplewood St · Detroit, MI
Flood risk 6/10 · Moderate
- FEMA flood zone
- X (unshaded)
- Chance of flooding over 30 yrs
- 0.68%
- Est. flood insurance / yr
- $473 – $860
Fire risk 1/10 · Minimal
- Est. fire insurance / yr
- $784 – $1,456
Heat risk 3/10 · Minor
- Hot days now (above 97°F)
- 7 days/yr
- Hot days in 30 yrs
- 15 days/yr
Wind risk 2/10 · Minimal
- Chance of severe wind over 30 yrs
- —
Air-quality risk 4/10 · Minor
- Unhealthy air days now
- 4 days/yr
- Unhealthy air days in 30 yrs
- 6 days/yr
Risk factors via First Street. Map © Google.
Why this score? — see what drove the A- grade
The composite is a weighted blend of 9 inputs, each scored 0–100. Each bar is that input's sub-score; the figure is the points it added to the 100-point composite (weight × sub-score).
- Cash flow +30.0/30.0
- ARV discount +15.0/15.0
- DSCR +10.0/10.0
- Appreciation +10.0/10.0
- 1% rule +8.6/10.0
- Livability +3.7/5.0
- Rent growth +2.5/5.0
- Condition / age +2.5/5.0
- Schools +1.3/10.0
$95,000
🖨 Deal sheet 📄 Offer letter ✓ Due diligence
Listing remarks MLS
This is your chance to get a 3 bedroom 2 bathroom 2 story with a corner lot. Plenty of space to stretch out and make your own! Located conveniently close to shopping, restaurants, and I 96.
Key facts
- 3,485 sq ft lot
- Built 1916
- Listed 19 days
Property features AI
Finance
- Other: Property located in the city of Detroit (municipality); Corner lot near Pattengill Park; frontage approx. 30 feet
Exterior
- Utilities: Public water; Natural gas water heater; Natural gas heating (forced air)
- Home design: Residential 2-story home; Built in 1916; Basement present
- Construction: Brick construction; Basement foundation
- Exterior features: Brick exterior; Front porch; Exterior balcony; Fenced yard; Paved street frontage
Interior
- Kitchen: Kitchen on entry level — approx. 10 x 8, vinyl flooring; Dining room on entry level — approx. 13 x 12, carpet
- Bedrooms: Bedroom 1 (Second level) — 14 x 12, wood flooring; Bedroom 2 (Second level) — 12 x 11, carpet; Bedroom 3 (Second level) — 10 (width), carpet
- Flooring: Wood flooring in at least one bedroom and one bathroom; Carpet in living room, dining room, and two bedrooms; Vinyl in kitchen and entry-level bathroom
- Bathrooms: 2 full bathrooms; Bathroom on entry level — vinyl flooring, approximate dimensions 6 x 5; Bathroom on second level — wood flooring, approximate dimensions 8 x 6
- Heating & cooling: Forced air heating; Natural gas heat and gas water heater
- Interior features: Living room fireplace; Unfinished basement
Neighborhood map
What this means for you Summary
Snapshot
- This is a 3-bed/1.5-bath single-family listed at $95k.
Deal economics
- At list price, monthly cash flow is $411 ($5k/yr) — positive.
- The deal already cash-flows at list — no discount required.
- Meets the 1% rule at list price ($1k rent vs $95k).
- Recommended offer: $94k (1.5% below list) — sets the bar for market timing.
Location & tenants
- Location reads 73/100 on livability (#218 in MI) — a middle-class / working-renter tenant base. Strengths: amenities A+, commute A+, cost of living A+; Watch: schools F, crime F, employment F.
- Detroit Public Schools Community District (urban): math 10% / reading 24% proficiency, ranked #499 of 540 in MI (top 92%) — low school quality limits family demand, transient renter base, plan for 1-2y turnover; 90% free/reduced lunch — lower-income household profile, screen leases tightly.
- Market conditions: 244 active listings in the ZIP; 36 comparable units currently listed for rent nearby; rentals at typical pace (median 25d on market — plan ~3-4 weeks tenant-placement turnaround); lower-income renter base — watch delinquency; 2,639 units permitted in Wayne County in 2024 (1,216 in 5+ unit buildings).
- This rent runs 45% of the median local income ($34k/yr) — at the standard rent-burdened threshold; future hikes will face affordability resistance.
Forward outlook
- In year one you build about $10k of equity ($657 loan paydown + $10k appreciation (10.0% local appreciation)).
- Wayne County population projected at -17% by 2050 — secular population decline; favor cash flow + early exit over multi-decade hold.
- At projected returns (10.0% appreciation + 3.0% rent growth), your $27k cash investment doubles in ~2 years — after that, you're playing with house money.
- By year 4, paydown + projected appreciation supports a ~$36k cash-out refi (75% LTV) — recoverable capital for the next deal without selling this one.
Negotiation context
- It's been on market 20 days — a 2% lower offer ($94k) is reasonable based on typical stale-listing flexibility.
- 7 sale attempts; this cycle's ask is 660% above the opening price — seller raised mid-cycle; expect resistance to lowballs.
- Current owner paid $15k; list at $95k implies a 533% gain — meaningful room to come down on a strong offer.
Risks & watch-outs
- Watch-outs: built in 1916 — expect roof / HVAC / electrical / plumbing capex.
- Climate carrying-cost: major flood risk — expect insurance premiums to compound above CPI over the hold.
Questions for the listing agent
- Built in 1916 — when were the roof, HVAC, electrical panel, plumbing, and water heater last replaced?
- Is there a deadline driving the sale (1031 exchange, divorce, estate, relocation)? That informs how much negotiation room exists.
- Schools are F-rated, which usually means shorter tenancies and higher turnover. Who's the typical renter profile here, and what's been the actual vacancy rate?
- Crime grade is F in this area — have there been break-ins, vandalism, or insurance claims at this property in the last 3 years? What carrier currently insures it and at what premium?
- What's the average days-on-market for RENTAL listings here right now (not sales)? A rising rental-DOM trend means longer vacancies and softer asking-rent achievability than the comps imply.
- What's the recent tenant-quality profile in this submarket — average credit score on applications, eviction rate, late-payment / NSF rate, and stable-employment percentage? A property-management company in the area should have these aggregated.
- How much new for-sale + rental construction is in the pipeline within 1–3 miles? Heavy new supply typically softens prices + rents 12–24 months out; constrained supply supports both.
Investment metrics
- 1% rule
- 1.36% ✓
- Cap rate
- 11.48%
- Cash-on-cash
- 18.53%
- DSCR
- 1.82
- GRM
- 6.1
CMA / ARV
- ARV (on-the-fly)
- $114,304
- Comps found
- 12
Show comp detail 12 sales within ~0.75 mi
| Address | Dist | Beds/Ba | Sqft | Sold | Price | $/sf | Match |
|---|---|---|---|---|---|---|---|
| 5250 Vancouver St | 0.16mi | 4/2.0 (+1) | 1,450 (-4%) | 1mo | $151,000 | $104 | 78 |
| 5260 Spokane St | 0.06mi | 2/1.0 (-1) | 1,438 (-4%) | 7mo | $12,250 | $9 | 77 |
| 5535 Vancouver St | 0.31mi | 3/1.0 | 1,440 (-4%) | 3mo | $110,000 | $76 | 74 |
| 4497 Vancouver St | 0.37mi | 3/1.5 | 1,412 (-6%) | 1mo | $150,000 | $106 | 71 |
| 5125 Whitfield St | 0.43mi | 4/2.0 (+1) | 1,530 (+2%) | 2mo | $136,800 | $89 | 68 |
| 5297 Vancouver St | 0.21mi | 4/1.5 (+1) | 1,363 (-9%) | 4mo | $60,000 | $44 | 67 |
| 5640 Underwood Ave | 0.54mi | 3/1.0 | 1,450 (-4%) | 2mo | $65,000 | $45 | 65 |
| 5357 Spokane Ave | 0.16mi | 3/1.5 | 1,288 (-14%) | 6mo | $47,997 | $37 | 64 |
| 4385 Pacific St | 0.46mi | 4/1.5 (+1) | 1,595 (+6%) | 6mo | $140,000 | $88 | 58 |
| 9539 Beechwood St St | 0.68mi | 3/1.0 | 1,440 (-4%) | 2mo | $36,000 | $25 | 58 |
| 3781 Taylor St | 0.74mi | 4/1.0 (+1) | 1,505 (+0%) | 3mo | $39,500 | $26 | 56 |
| 5524 Seebaldt St | 0.47mi | 4/2.5 (+1) | 1,323 (-12%) | 5mo | $144,000 | $109 | 45 |
Match score weights: distance 35% · size 25% · config 20% · recency 20%. Top-matched comps best support the ARV.
Projected returns pro-forma
10.0% appreciation · 3.0% rent growth · sell at horizon
- IRR
- 38.1%
- Equity multiple
- 3.93×
- Total profit
- $77,897
- Equity at exit
- $85,584
- IRR
- 32.8%
- Equity multiple
- 8.85×
- Total profit
- $208,797
- Equity at exit
- $184,564
Cash invested: $26,600 (down + closing). Projections, not guarantees.
Landlord ↔ Tenant lean methodology
- Overall (STATE)
- 62 Landlord-Friendly
- State Michigan
- 62 Landlord-Friendly · EVEN
- County
- — inherits STATE
- City
- — inherits STATE
ZIP-level market 48204
- Home prices YoY
- 18.5%
- Active inventory
- 244
- Price-to-rent
- 6.1×
Monthly cashflow live
- Estimated rent
- $1,292 high interval (Pro) →
- Mortgage (P&I)
- −$498
- Tax from tax record
- −$72 /mo · $865/yr
- Insurance
- −$40
- HOA
- −$0
- Vacancy / Maint / Mgmt
- −$271
- Net cashflow
- $411
Break-even live
UW: 25.0% down · 7.5% · 30yr · 1.5% tax · 5.0% vac · 8.0% maint · 8.0% mgmt
Financing live
Cash to close
- Down payment
- $23,750
- Closing costs
- $2,850
- Reserves months
- —
- Total cash needed
- —
Loan-product check · same deal, 3 products live
Conventional
25% down · 7.5% · 30yr
- Down + closing
- —
- Monthly P&I
- —
- Monthly cashflow
- —
- DSCR
- —
- Eligible?
- —
Personal DTI + credit; lowest rate.
DSCR
20% down · 8.5% · 30yr
- Down + closing
- —
- Monthly P&I
- —
- Monthly cashflow
- —
- DSCR
- —
- Eligible?
- —
No personal income docs; deal must DSCR.
Hard money
10% down · 12.0% · 12mo
- Down + closing
- —
- Monthly P&I
- —
- Monthly cashflow
- —
- DSCR
- —
- Eligible?
- —
Short-term bridge; refi at stabilization.
Rent comps 36 comps
| Address | Beds | Baths | Sqft | Rent | $/sqft | DOM | Units | Dist |
|---|---|---|---|---|---|---|---|---|
| 5315 Spokane St Detroit, MI | 3.0 | 1.0 | 2110 | $1,200 | $0.57 | 16d | 1 | 0.12mi |
| 4915 Maplewood St Detroit, MI | 3.0 | 1.0 | 1324 | $1,100 | $0.83 | 16d | 1 | 0.19mi |
| 5398 Allendale St Detroit, MI | 2.0 | 1.0 | 1100 | $1,200 | $1.09 | 24d | 1 | 0.37mi |
| 4345 W Euclid St Unit 1 Detroit, MI | 3.0 | 1.0 | 1300 | $1,400 | $1.08 | 24d | 1 | 0.43mi |
| 4345 W Euclid St Unit 2 Detroit, MI | 3.0 | 1.0 | 1300 | $1,450 | $1.12 | 24d | 1 | 0.43mi |
| 4566 Seebaldt St Detroit, MI | 2.0 | 1.0 | 1200 | $1,250 | $1.04 | 22d | 1 | 0.45mi |
| 4016 Hogarth St Unit 4018 Hogarth Lower Detroit, MI | 2.0 | 1.0 | 1200 | $1,100 | $0.92 | 3d | 1 | 0.65mi |
| 3786 Carter St Unit 2 Detroit, MI | 3.0 | 1.0 | 1400 | $1,100 | $0.79 | 24d | 1 | 0.68mi |
| 3757 Blaine St Detroit, MI | 3.0 | 1.0 | 1169 | $1,480 | $1.27 | 16d | 1 | 0.69mi |
| 3259 W Philadelphia St Detroit, MI | 3.0 | 1.0 | 1293 | $1,400 | $1.08 | 16d | 1 | 0.85mi |
| 3220 Gladstone St Detroit, MI | 3.0 | 1.0 | 1248 | $1,200 | $0.96 | 43d | 1 | 0.94mi |
| 3422 Edison St Detroit, MI | 3.0 | 1.0 | 1300 | $1,295 | $1.00 | 16d | 1 | 1.04mi |
| 3012 Lothrop Detroit, MI | 2.0 | 1.0 | 1800 | $1,300 | $0.72 | 2d | 1 | 1.04mi |
| 4426 McGraw Ave Unit 1 Detroit, MI | 3.0 | 1.0 | 1400 | $1,200 | $0.86 | 43d | 1 | 1.06mi |
| 7424 Wykes St Detroit, MI | 3.0 | 1.0 | 1200 | $1,100 | $0.92 | 43d | 1 | 1.12mi |
| 11704 Broadstreet Ave Detroit, MI | 3.0 | 1.0 | 1200 | $1,050 | $0.88 | 43d | 1 | 1.29mi |
| 2506 W Euclid St Detroit, MI | 3.0 | 1.0 | 1475 | $1,675 | $1.14 | 43d | 1 | 1.30mi |
| 2504 W Euclid St Unit 2504 Detroit, MI | 3.0 | 1.0 | 1475 | $1,650 | $1.12 | 43d | 1 | 1.30mi |
| 2504 W Euclid St Unit 2506 Detroit, MI | 3.0 | 1.0 | 1475 | $1,675 | $1.14 | 43d | 1 | 1.30mi |
| 3266 Calvert Ave Fl 2 Detroit, MI | 3.0 | 1.0 | 1279 | $1,300 | $1.02 | 24d | 1 | 1.31mi |
| 9022 Northlawn St Detroit, MI | 2.0 | 1.0 | 1100 | $1,300 | $1.18 | 24d | 1 | 1.33mi |
| 8320 Northlawn St Detroit, MI | 3.0 | 1.0 | 1737 | $1,550 | $0.89 | 20d | 1 | 1.33mi |
| 3226 Calvert Ave Detroit, MI | 3.0 | 1.0 | 1100 | $1,200 | $1.09 | 12d | 1 | 1.33mi |
| 3224 Calvert St Detroit, MI | 3.0 | 1.0 | 1150 | $1,150 | $1.00 | 43d | 1 | 1.33mi |
| 2463 Taylor St Detroit, MI | 3.0 | 1.0 | 1350 | $1,100 | $0.81 | 43d | 1 | 1.39mi |
| 8230 Ohio St Detroit, MI | 3.0 | 1.0 | 1350 | $1,200 | $0.89 | 16d | 1 | 1.39mi |
| 1493 W Grand Blvd Detroit, MI | 2.0 | 1.0 | 1250 | $1,145 | $0.92 | 43d | 1 | 1.42mi |
| 2925 Calvert St Detroit, MI | 3.0 | 1.0 | 1400 | $1,300 | $0.93 | 16d | 1 | 1.42mi |
| 3031 Lawrence St Detroit, MI | 4.0 | 1.0 | 1700 | $1,600 | $0.94 | 16d | 1 | 1.44mi |
| 3322 Webb St Unit 1 Detroit, MI | 3.0 | 1.0 | 1656 | $1,350 | $0.82 | 43d | 1 | 1.47mi |
| 3322 Webb St Unit 2 Detroit, MI | 3.0 | 1.0 | 1656 | $1,350 | $0.82 | 43d | 1 | 1.47mi |
| 2727 Calvert Ave Unit 1 Detroit, MI | 3.0 | 1.5 | 1350 | $1,200 | $0.89 | 43d | 1 | 1.47mi |
| 3322 Webb St Detroit, MI | 3.0 | 1.0 | 1600 | $1,250 | $0.78 | 16d | 1 | 1.47mi |
| 6077 Linwood St Detroit, MI | 2.0 | 1.0 | 1200 | $2,000 | $1.67 | 43d | 1 | 1.48mi |
| 2302 Hazelwood St Unit 1 Detroit, MI | 3.0 | 1.0 | 1550 | $1,273 | $0.82 | 24d | 1 | 1.49mi |
| 8143 Wisconsin St Detroit, MI | 4.0 | 1.0 | 1370 | $1,800 | $1.31 | 1d | 1 | 1.49mi |
Listing history 34 events
-
2026-06-18days on market $95,000 Active 20 DOM
-
2026-06-17pricedays on market $95,000 Active 19 DOM
-
2026-06-15days on market $105,000 Active 17 DOM
-
2026-06-13days on market $105,000 Active 15 DOM
-
2026-06-13days on market $105,000 Active 14 DOM
-
2026-06-09days on market $105,000 Active 11 DOM
-
2026-06-08days on market $105,000 Active 10 DOM
-
2026-06-07days on market $105,000 Active 9 DOM
-
2026-06-04days on market $105,000 Active 6 DOM
-
2026-06-03days on market $105,000 Active 5 DOM
-
2026-06-02days on market $105,000 Active 4 DOM
-
2026-06-01days on market $105,000 Active 3 DOM
-
2026-05-31days on market $105,000 Active 2 DOM
-
2026-05-26historical $105,000
-
2026-01-16soldstatus $15,000 Closed 189-char remark
Show marketing remark (189 chars)
This is your chance to get a 3 bedroom 2 bathroom 2 story with a corner lot. Plenty of space to stretch out and make your own! Located conveniently close to shopping, restaurants, and I 96.
-
2026-01-16soldstatus $15,000 Closed
Show marketing remark (189 chars)
This is your chance to get a 3 bedroom 2 bathroom 2 story with a corner lot. Plenty of space to stretch out and make your own! Located conveniently close to shopping, restaurants, and I 96.
-
2026-01-16soldstatus $15,000 Sold
Show marketing remark (189 chars)
This is your chance to get a 3 bedroom 2 bathroom 2 story with a corner lot. Plenty of space to stretch out and make your own! Located conveniently close to shopping, restaurants, and I 96.
-
2025-12-01status Pending 189-char remark
Show marketing remark (189 chars)
This is your chance to get a 3 bedroom 2 bathroom 2 story with a corner lot. Plenty of space to stretch out and make your own! Located conveniently close to shopping, restaurants, and I 96.
-
2025-12-01status Pending
Show marketing remark (189 chars)
This is your chance to get a 3 bedroom 2 bathroom 2 story with a corner lot. Plenty of space to stretch out and make your own! Located conveniently close to shopping, restaurants, and I 96.
-
2025-12-01status Pending
Show marketing remark (189 chars)
This is your chance to get a 3 bedroom 2 bathroom 2 story with a corner lot. Plenty of space to stretch out and make your own! Located conveniently close to shopping, restaurants, and I 96.
-
2025-11-25$12,500 Active 189-char remark
Show marketing remark (189 chars)
This is your chance to get a 3 bedroom 2 bathroom 2 story with a corner lot. Plenty of space to stretch out and make your own! Located conveniently close to shopping, restaurants, and I 96.
-
2025-11-25$12,500 Active
Show marketing remark (189 chars)
This is your chance to get a 3 bedroom 2 bathroom 2 story with a corner lot. Plenty of space to stretch out and make your own! Located conveniently close to shopping, restaurants, and I 96.
-
2025-11-25$12,500 Active
Show marketing remark (189 chars)
This is your chance to get a 3 bedroom 2 bathroom 2 story with a corner lot. Plenty of space to stretch out and make your own! Located conveniently close to shopping, restaurants, and I 96.
-
2025-11-20historical
-
2025-11-20price $12,500
-
2025-11-19price $12,500
-
2025-11-19price $12,500
-
2025-10-15status Active
-
2025-10-15status Active
-
2025-09-17status Pending
-
2025-09-17status Pending
-
2025-09-17historical
-
2025-08-20$30,000 Active
-
2025-08-20$30,000 Active
ⓘ Source: listings_history table (triggers on properties + properties_extension) + one-shot
backfill from property_details.listing_events for pre-trigger history.
Tax reassessment forecast MI · Partial reset (capped growth)
- Current annual tax
- $865 · $72/mo
- Projected year-2 tax
- $1,164 · $97/mo
- Expected delta
- +$299/yr (+$25/mo · 34.6%)
ⓘ Screening estimate from a state-policy table — verify with the county assessor before closing.
Climate risk First Street
- Flood 6/10 Major FEMA zone X (unshaded) · 68% chance over 30 yrs
- Wildfire 1/10 Low
- Heat 3/10 Moderate 7 d/yr ≥97°F today · 15 d/yr by 30 yrs out
- Wind 2/10 Low
- Air quality 4/10 Moderate 4 unhealthy d/yr today · 6 by 30 yrs out
Nearby sold comps map
Loading sold comps map…
Walkable amenities ~0.75 mi
Loading nearby amenities…
Taxation est. · year 1
- Rental income
- $15,504
- − Mortgage interest
- −$5,321
- − Property taxes
- −$865
- − Insurance
- −$475
- − Repairs & maintenance
- −$1,240
- − Management
- −$1,240
- − Depreciation
- −$2,764
- Taxable income
- $3,598
- Est. tax owed @ 24.0%
- −$864
- After-tax cash flow
- $4,066/yr
For passive investors: Depreciation is non-cash, so a rental often shows a tax loss while cash-flowing — sheltering income. Rental losses are passive: they offset passive income freely, and up to $25,000/yr can offset ordinary (W-2) income if you actively participate and your MAGI is under $100k (phasing out to $0 by $150k); unused losses carry forward. On sale, claimed depreciation is recaptured at up to 25%, and gains may owe capital-gains tax (a 1031 exchange can defer both). Figures are a year-1 estimate at your 24.0% rate — not tax advice; consult a CPA.
Schools (NCES district)
- District
- Detroit Public Schools Community District
- NCES district ID
- 2601103
- Math proficiency
- 10% ▼ -2.00%
- Reading proficiency
- 24% ▲ 6.00%
- Median HH income
- $25,815
- Composite
- 13.06/100
- National rank
- #9564
- State rank
- #499 of 540 in MI
Livability — Detroit
- Score
- 73/100
- State rank
- #218
- US rank
- #5427
Category grades
Schools grade is shown separately in the Schools card above.
Census & demographics
- Census place
- Detroit, MI
- County
- Wayne County · 1,562,939 people
- City population
- 572,865
- Metro
- Detroit-Warren-Dearborn, MI
- Population (ZIP)
- 20,696
- Household income
- $34,468
- Rent vs Own
- Severe rent burden
- 1418.0
Population outlook (Wayne County) Hauer SSP2
- Today (2025)
- 1,675,273 people
- By 2030
- 1,620,300 · -3.3%
- By 2040
- 1,502,341 · -10.3%
- By 2050
- 1,384,039 · -17.4%
- By 2075
- 1,124,592 · -32.9%
- By 2100
- 881,193 · -47.4%
Race, ethnicity, and origin ACS 2023
- Neighborhood character
- Predominantly Black (86%)
- Race & ethnicity
- Black 86% Two or more races 7% Hispanic / Latino 5% White 4% Native American 2%
- Hispanic origin (detail)
- Mexican 4%
- Common ancestry
- Hispanic 1% Romanian 1%
- Foreign-born
- 2% · Canada
- Languages at home
- 95% English-only · Spanish 4%
Political lean MEDSL · Wayne
- 2024 margin
- Strong D (+29.0) · D 62.7% · R 33.7% · Other 3.6%
- 2008→2024 swing
- -20.5pp toward R · 2008: 49.5pp · 2024: 29.0pp
- All cycles
- 2024: D+29.0 2020: D+38.1 2016: D+37.3 2012: D+46.9 2008: D+49.5
Not yet ingested
- Civics
- —
Market trends
- HPI YoY
- ▲ 36.51%
- Current HPI
- 234.0465
- Rent YoY
- —
- Metro
- Detroit-Warren-Dearborn, MI
- State GDP YoY
- ▲ 1.37%
- F500 in state
- 28
Industry mix (Fortune 500 HQ in MI)
| Industry | F500 HQs | Revenue |
|---|---|---|
| Automotive Parts | 3 | $48B |
|
||
| Automotive | 2 | $372B |
|
||
| Chemicals | 1 | $45B |
|
||
| Automotive Retail | 1 | $29B |
|
||
| Healthcare / Medical Devices | 1 | $23B |
|
||
| Automotive Technology | 1 | $20B |
|
||
Price history
+250.0% since first listed21 events — show timeline
- 2026-05-26 Coming Soon $105,000 MiRealSource-MiMLS
- 2026-01-16 Sold (MLS) $15,000 SW Michigan MLS
- 2026-01-16 Sold (MLS) $15,000 MiRealSource-MiMLS
- 2026-01-16 Sold (MLS) $15,000 REALCOMP
- 2025-12-01 Pending — REALCOMP
- 2025-12-01 Pending — MiRealSource-MiMLS
- 2025-12-01 Pending — SW Michigan MLS
- 2025-11-25 Listed $12,500 REALCOMP
- 2025-11-25 Listed $12,500 SW Michigan MLS
- 2025-11-25 Listed $12,500 MiRealSource-MiMLS
- 2025-11-20 Listing Removed — MiRealSource-MiMLS
- 2025-11-20 Price Changed $12,500 MiRealSource-MiMLS
- 2025-11-19 Price Changed $12,500 REALCOMP
- 2025-11-19 Price Changed $12,500 SW Michigan MLS
- 2025-10-15 Relisted — REALCOMP
- 2025-10-15 Relisted — MiRealSource-MiMLS
- 2025-09-17 Pending — REALCOMP
- 2025-09-17 Pending — MiRealSource-MiMLS
- 2025-09-17 Listing Removed — REALCOMP
- 2025-08-20 Listed $30,000 REALCOMP
- 2025-08-20 Listed $30,000 MiRealSource-MiMLS
Property tax history
+0.6%/yrLatest (2025): $865 · -45.0% YoY. Source: county tax records.
Cash-flow waterfall
monthlySold comps — $/sqft
last 12 mo · ≤1 miLoading sold comps…