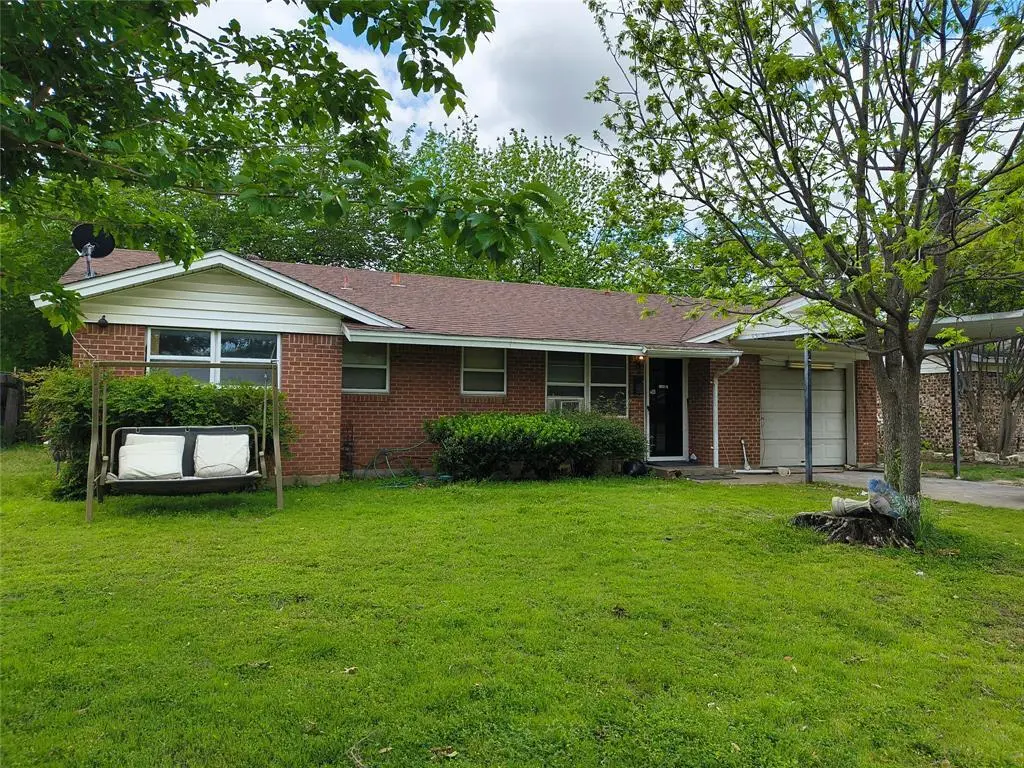
600 Thompson Dr · Saginaw, TX
Flood risk 4/10 · Minor
- FEMA flood zone
- X (unshaded)
- Chance of flooding over 30 yrs
- 0.21%
- Est. flood insurance / yr
- $507 – $1,088
Fire risk 1/10 · Minimal
- Est. fire insurance / yr
- $1,222 – $2,270
Heat risk 7/10 · Major
- Hot days now (above 109°F)
- 7 days/yr
- Hot days in 30 yrs
- 22 days/yr
Wind risk 4/10 · Minor
- Chance of severe wind over 30 yrs
- 21.0%
Air-quality risk 2/10 · Minimal
- Unhealthy air days now
- 1 days/yr
- Unhealthy air days in 30 yrs
- 2 days/yr
Risk factors via First Street. Map © Google.
Why this score? — see what drove the B- grade
The composite is a weighted blend of 9 inputs, each scored 0–100. Each bar is that input's sub-score; the figure is the points it added to the 100-point composite (weight × sub-score).
- Cash flow +23.9/30.0
- ARV discount +15.0/15.0
- DSCR +7.7/10.0
- 1% rule +7.0/10.0
- Livability +3.8/5.0
- Schools +3.5/10.0
- Rent growth +2.9/5.0
- Condition / age +2.5/5.0
- Appreciation +0.0/10.0
$165,000
🖨 Deal sheet (PDF) 📄 Offer letter ✓ Due diligence
Listing remarks
Estate sale, home needs total remodel, roof is bad, hvac needs replaced, perfect property for investor, sold as is
Key facts
- 7,405 sq ft lot
- Garage
- Built 1967
Property features AI
Finance
- Other: Possession: Negotiable
- Financial info: Listing terms include cash and conventional financing; Special listing condition: Probate listing
- HOA & community: No association
Exterior
- Parking: Carport; Covered parking for 2 vehicles; Attached 1-car garage with garage door opener (garage approx. 12' wide x 19' long); Carport spaces: 1
- Security: No specific security features listed
- Utilities: City water; City sewer; Electricity connected; Municipal utility district: No
- Home design: Single-family residence; Single-story (one level); Residential property
- Construction: Built in 1967; Slab foundation
- Exterior features: Curbs; Lot under 0.5 acre (approximately 0.17 acre); Subdivision: Rancho North Add
Interior
- Kitchen: Dishwasher; Disposal; Gas cooktop; Gas oven; Breakfast room adjacent to the kitchen
- Bedrooms: Three bedrooms (all on the main level); Primary bedroom on the main level
- Flooring: No flooring information provided
- Bathrooms: Two full bathrooms
- Heating & cooling: Wall unit(s) for cooling
- Interior features: Cable TV available; Walk-in closet(s); One living area; One dining area; Six total rooms
- Laundry & utility: No specific laundry appliances listed
Neighborhood map
What this means for you Summary
Snapshot
- This is a 3-bed/2.0-bath single-family listed at $165k.
Deal economics
- At list price, monthly cash flow is $320 ($4k/yr) — positive.
- The deal already cash-flows at list — no discount required.
- Meets the 1% rule at list price ($2k rent vs $165k).
- Recommended offer: $160k (3.0% below list) — sets the bar for market timing.
- Cap rate 8.6% vs local median 4.2% in Saginaw — top-decile yield for the area; either an underpriced asset or a hidden risk that comps aren't pricing in. Stress-test before assuming the spread holds.
Location & tenants
- Location reads 76/100 on livability (#112 in TX, #3,623 nationally) — a middle-class / working-renter tenant base. Strengths: employment A+, cost of living A+, housing A+; Watch: amenities F, commute F.
- Eagle Mt-Saginaw ISD (urban): math 35% / reading 42% proficiency, ranked #361 of 826 in TX (top 44%) — families likely to look elsewhere, expect single-tenant / working-renter base with shorter leases.
- Zoned schools: Saginaw El (math 22% / reading 27%, grade F, #3,052 of 4,322 statewide, top 74%, 333 students, 69% FRL); Prairie Vista (math 33% / reading 40%, grade F, #786 of 1,662 statewide, top 48%, 923 students, 52% FRL); Chisholm Trail H S (math 27% / reading 55%, grade F, #774 of 1,632 statewide, top 49%, 2,493 students, 48% FRL) — zoned schools average 56% FRL vs 36% district-wide (21 pts higher); higher-poverty schools than district average — tighter screening recommended.
- Market conditions: Rents rising (+1.5%/yr); 1074 active listings in the ZIP; 27 comparable units currently listed for rent nearby; rentals leasing fast (median 9d on market — plan ~1-2 weeks tenant-placement turnaround); solid renter incomes; 18,938 units permitted in Tarrant County in 2024 (8,336 in 5+ unit buildings).
Forward outlook
- Local home prices are declining (-3.0%/yr); year-one equity from $1k of loan paydown is wiped out by about $5k of value loss. Plan a longer hold.
- Tarrant County population projected at +41% by 2050 — long-run rental-demand tailwind backs the buy-and-hold thesis.
Negotiation context
- It's been on market 31 days — a 3% lower offer ($160k) is reasonable based on typical stale-listing flexibility.
Risks & watch-outs
- Climate carrying-cost: extreme-heat days projected 7→22/yr by 2055 (HVAC capex compounding) — expect insurance premiums to compound above CPI over the hold.
Questions for the listing agent
- It's been on market 31 days. Have you received any prior offers? Is the seller open to a 3% concession, seller financing, or rate buy-down credit?
- Built in 1967 — when were the roof, HVAC, electrical panel, plumbing, and water heater last replaced?
- Is there a deadline driving the sale (1031 exchange, divorce, estate, relocation)? That informs how much negotiation room exists.
- Schools are D-rated, which usually means shorter tenancies and higher turnover. Who's the typical renter profile here, and what's been the actual vacancy rate?
- What's the average days-on-market for RENTAL listings here right now (not sales)? A rising rental-DOM trend means longer vacancies and softer asking-rent achievability than the comps imply.
- What's the recent tenant-quality profile in this submarket — average credit score on applications, eviction rate, late-payment / NSF rate, and stable-employment percentage? A property-management company in the area should have these aggregated.
- How much new for-sale + rental construction is in the pipeline within 1–3 miles? Heavy new supply typically softens prices + rents 12–24 months out; constrained supply supports both.
Investment metrics
- 1% rule
- 1.20% ✓
- Cap rate
- 8.62%
- Cash-on-cash
- 8.31%
- DSCR
- 1.37
- GRM
- 7.0
CMA / ARV
- ARV (on-the-fly)
- $237,956
- Comps found
- 12
Show comp detail 12 sales within ~0.75 mi
| Address | Dist | Beds/Ba | Sqft | Sold | Price | $/sf | Match |
|---|---|---|---|---|---|---|---|
| 600 Thompson Dr | 0.00mi | 3/2.0 | 1,178 (0%) | 0mo | $165,000 | $140 | 100 |
| 308 Thompson Ct | 0.05mi | 3/2.0 | 1,217 (+3%) | 2mo | $264,900 | $218 | 90 |
| 256 Pimlico Way | 0.07mi | 3/1.5 | 1,136 (-4%) | 2mo | $239,000 | $210 | 87 |
| 404 Southern Ct | 0.27mi | 3/1.5 | 1,193 (+1%) | 1mo | $225,000 | $189 | 82 |
| 409 Opal St | 0.24mi | 3/2.0 | 1,140 (-3%) | 4mo | $159,900 | $140 | 80 |
| 363 Mustang Dr | 0.16mi | 3/2.0 | 1,246 (+6%) | 4mo | $225,000 | $181 | 79 |
| 316 Thompson Dr | 0.30mi | 3/1.5 | 1,164 (-1%) | 10mo | $235,000 | $202 | 74 |
| 363 Opal Ct | 0.29mi | 3/2.0 | 1,108 (-6%) | 5mo | $225,000 | $203 | 72 |
| 432 Indian Crest Dr | 0.43mi | 3/2.0 | 1,224 (+4%) | 10mo | $250,000 | $204 | 65 |
| 400 Blue Ridge Trl | 0.32mi | 3/2.0 | 1,335 (+13%) | 3mo | $268,000 | $201 | 61 |
| 120 Western Ave | 0.58mi | 3/1.0 | 1,172 (-0%) | 11mo | $249,900 | $213 | 59 |
| 824 Opal St | 0.31mi | 3/2.0 | 1,307 (+11%) | 12mo | $250,000 | $191 | 57 |
Match score weights: distance 35% · size 25% · config 20% · recency 20%. Top-matched comps best support the ARV.
Projected returns pro-forma
-3.0% appreciation · 1.51% rent growth · sell at horizon
- IRR
- -5.4%
- Equity multiple
- 0.80×
- Total profit
- $-9,185
- Equity at exit
- $24,602
- IRR
- 2.3%
- Equity multiple
- 1.15×
- Total profit
- $6,997
- Equity at exit
- $14,266
Cash invested: $46,200 (down + closing). Projections, not guarantees.
Landlord ↔ Tenant lean methodology
- Overall (STATE)
- 87 Strongly Landlord-Friendly
- State Texas
- 87 Strongly Landlord-Friendly · R+5
- County
- — inherits STATE
- City
- — inherits STATE
ZIP-level market 76179
- Rents YoY
- 1.5%
- Active inventory
- 1074
- Price-to-rent
- 7.0×
Monthly cashflow live
- Estimated rent
- $1,974 high interval (Pro) →
- Mortgage (P&I)
- −$865
- Tax from tax record
- −$305 /mo · $3,662/yr
- Insurance
- −$69
- HOA
- −$0
- Vacancy / Maint / Mgmt
- −$414
- Net cashflow
- $320
Break-even live
Sensitivity live
| Price | -10% $413 | -5% $367 | +0% $320 | +5% $273 | +10% $227 |
|---|---|---|---|---|---|
| Rent | -10% $164 | -5% $242 | +0% $320 | +5% $398 | +10% $476 |
| Rate | -1.0pp $403 | -0.5pp $362 | base $320 | +0.5pp $277 | +1.0pp $234 |
UW: 25.0% down · 7.5% · 30yr · 1.5% tax · 5.0% vac · 8.0% maint · 8.0% mgmt
Financing live
Cash to close
- Down payment
- $41,250
- Closing costs
- $4,950
- Reserves months
- —
- Total cash needed
- —
Loan-product check · same deal, 3 products live
Conventional
25% down · 7.5% · 30yr
- Down + closing
- —
- Monthly P&I
- —
- Monthly cashflow
- —
- DSCR
- —
- Eligible?
- —
Personal DTI + credit; lowest rate.
DSCR
20% down · 8.5% · 30yr
- Down + closing
- —
- Monthly P&I
- —
- Monthly cashflow
- —
- DSCR
- —
- Eligible?
- —
No personal income docs; deal must DSCR.
Hard money
10% down · 12.0% · 12mo
- Down + closing
- —
- Monthly P&I
- —
- Monthly cashflow
- —
- DSCR
- —
- Eligible?
- —
Short-term bridge; refi at stabilization.
Rent comps 27 comps
| Address | Beds | Baths | Sqft | Rent | $/sqft | DOM | Units | Dist |
|---|---|---|---|---|---|---|---|---|
| 820 W McLeroy Blvd Unit 2020 Saginaw, TX | 2.0 | 1.0 | 1048 | $3,495 | $3.33 | 3d | 1 | 0.80mi |
| 508 Alex St Saginaw, TX | 3.0 | 2.0 | 1496 | $1,900 | $1.27 | 9d | 1 | 0.84mi |
| 508 Alex St Saginaw, TX | 3.0 | 2.0 | 1496 | $1,900 | $1.27 | 0d | 1 | 0.84mi |
| 125 Cambridge Dr Unit 4 Saginaw, TX | 3.0 | 2.0 | 1044 | $1,495 | $1.43 | 26d | 1 | 1.03mi |
| 1101 Longhorn Rd Fort Worth, TX | 3.0 | 2.0 | 1315 | $1,915 | $1.46 | 4d | 1 | 1.04mi |
| 1101 Longhorn Rd Fort Worth, TX | 3.0 | 2.0 | 1315 | $2,120 | $1.61 | 12d | 1 | 1.04mi |
| 1101 Longhorn Rd Unit 1134 Fort Worth, TX | 3.0 | 2.0 | 1315 | $1,939 | $1.47 | 0d | 1 | 1.04mi |
| 833 White Rock St Saginaw, TX | 3.0 | 2.0 | 1179 | $1,495 | $1.27 | 8d | 1 | 1.04mi |
| 1101 Longhorn Rd Unit 1138 Fort Worth, TX | 2.0 | 2.0 | 1162 | $1,722 | $1.48 | 0d | 1 | 1.04mi |
| 5744 Giddyup Ln Fort Worth, TX | 3.0 | 2.5 | 1321 | $1,750 | $1.32 | 26d | 1 | 1.09mi |
| 218 Potsgrove Rd Saginaw, TX | 3.0 | 2.5 | 1490 | $2,319 | $1.56 | 0d | 1 | 1.14mi |
| 5624 Giddyup Ln Fort Worth, TX | 2.0 | 2.5 | 1160 | $1,700 | $1.47 | 13d | 1 | 1.14mi |
| 1116 Landsdale Ln Saginaw, TX | 2.0 | 1.0 | 970 | $1,295 | $1.34 | 26d | 1 | 1.16mi |
| 404 Asbury Dr Saginaw, TX | 3.0 | 2.0 | 1166 | $1,545 | $1.33 | 26d | 1 | 1.16mi |
| 102 Rutland Ct Saginaw, TX | 3.0 | 2.5 | 1490 | $2,319 | $1.56 | 18d | 1 | 1.18mi |
| 101 Rutland Ct Saginaw, TX | 3.0 | 2.5 | 1490 | $2,299 | $1.54 | 8d | 1 | 1.19mi |
| 206 Hardwick Dr Saginaw, TX | 3.0–4.0 | 2.5–3.0 | 1747 | $2,299 | $1.32 | 0d | 1 | 1.23mi |
| 1149 Landsdale Ln Saginaw, TX | 3.0 | 2.0 | 1179 | $1,495 | $1.27 | 20d | 1 | 1.23mi |
| 1149 Landsdale Ln Saginaw, TX | 3.0 | 2.0 | 1179 | $1,495 | $1.27 | 14d | 1 | 1.23mi |
| 701 N Saginaw Blvd Saginaw, TX | 1.0–2.0 | 1.0–2.0 | 1024 | $2,326 | $2.27 | 0d | 21 | 1.25mi |
| 524 Buckstone Dr Saginaw, TX | 3.0 | 2.0 | 1355 | $1,975 | $1.46 | 6d | 1 | 1.27mi |
| 612 S Blue Mound Rd Apt 3A Fort Worth, TX | 2.0 | 1.0 | 720 | $1,467 | $2.04 | 4d | 1 | 1.31mi |
| 612 S Blue Mound Rd Fort Worth, TX | 2.0 | 1.0 | 720 | $1,600 | $2.22 | 4d | 1 | 1.31mi |
| 612 S Blue Mound Rd Fort Worth, TX | 2.0 | 1.0 | 720 | $1,467 | $2.04 | 23d | 1 | 1.31mi |
| 612 S Blue Mound Rd Fort Worth, TX | 2.0 | 1.0 | 720 | $1,467 | $2.04 | 22d | 1 | 1.31mi |
| 102 Bedford Cir Saginaw, TX | 3.0 | 2.5 | 1490 | $2,319 | $1.56 | 18d | 1 | 1.33mi |
| 1628 Americana Blvd Blue Mound, TX | 3.0 | 2.0 | 1196 | $1,850 | $1.55 | 9d | 1 | 1.44mi |
Listing history 5 events
-
2026-05-12status Pending
-
2026-05-02price $165,000
-
2026-04-11$175,000 Active
-
2008-07-24soldstatus
-
1989-08-08soldstatus
ⓘ Source: listings_history table (triggers on properties + properties_extension) + one-shot
backfill from property_details.listing_events for pre-trigger history.
Tax reassessment forecast TX · Resets to sale price
- Current annual tax
- $3,662 · $305/mo
- Projected year-2 tax
- $3,662 · $305/mo
- Expected delta
- $0/yr ($0/mo · 0.0%)
ⓘ Screening estimate from a state-policy table — verify with the county assessor before closing.
Climate risk First Street
- Flood 4/10 Moderate FEMA zone X (unshaded) · 21% chance over 30 yrs
- Wildfire 1/10 Low
- Heat 7/10 Severe 7 d/yr ≥109°F today · 22 d/yr by 30 yrs out
- Wind 4/10 Moderate 21% chance of damaging wind over 30 yrs
- Air quality 2/10 Low 1 unhealthy d/yr today · 2 by 30 yrs out
Nearby sold comps map
Loading sold comps map…
Walkable amenities ~0.75 mi
Loading nearby amenities…
Taxation est. · year 1
- Rental income
- $23,683
- − Mortgage interest
- −$9,243
- − Property taxes
- −$3,662
- − Insurance
- −$825
- − Repairs & maintenance
- −$1,895
- − Management
- −$1,895
- − Depreciation
- −$4,800
- Taxable income
- $1,364
- Est. tax owed @ 24.0%
- −$327
- After-tax cash flow
- $3,512/yr
For passive investors: Depreciation is non-cash, so a rental often shows a tax loss while cash-flowing — sheltering income. Rental losses are passive: they offset passive income freely, and up to $25,000/yr can offset ordinary (W-2) income if you actively participate and your MAGI is under $100k (phasing out to $0 by $150k); unused losses carry forward. On sale, claimed depreciation is recaptured at up to 25%, and gains may owe capital-gains tax (a 1031 exchange can defer both). Figures are a year-1 estimate at your 24.0% rate — not tax advice; consult a CPA.
Schools (NCES district)
- District
- Eagle Mt-Saginaw ISD
- NCES district ID
- 4817700
- Math proficiency
- 35% ▼ -16.00%
- Reading proficiency
- 42% ▼ -9.00%
- Median HH income
- $72,781
- Composite
- 35.41/100
- National rank
- #4945
- State rank
- #361 of 826 in TX
Livability — Saginaw
- Score
- 76/100
- State rank
- #112
- US rank
- #3623
Category grades
Schools grade is shown separately in the Schools card above.
Census & demographics
- Census place
- Saginaw, TX
- County
- Tarrant County · 2,033,669 people
- City population
- 56,322
- Metro
- Dallas-Fort Worth-Arlington, TX
- Population (ZIP)
- 80,090
- Household income
- $107,428
- Rent vs Own
- Severe rent burden
- 1494.0
Population outlook (Tarrant County) Hauer SSP2
- Today (2025)
- 2,380,417 people
- By 2030
- 2,578,900 · +8.3%
- By 2040
- 2,974,995 · +25.0%
- By 2050
- 3,350,489 · +40.8%
- By 2075
- 4,216,909 · +77.2%
- By 2100
- 4,741,527 · +99.2%
Race, ethnicity, and origin ACS 2023
- Neighborhood character
- Diverse neighborhood (Simpson 0.63)
- Race & ethnicity
- White 53% Hispanic / Latino 28% Two or more races 14% Black 12% Asian 4%
- Hispanic origin (detail)
- Mexican 22% Puerto Rican 2%
- Common ancestry
- Slovak 2% Lithuanian 2% Italian 1%
- Foreign-born
- 8% · Canada, Jamaica
- Languages at home
- 81% English-only · Spanish 15% Other Asian/Pacific 2% Other Indo-European 1%
Political lean MEDSL · Tarrant
- 2024 margin
- Lean R (+5.1) · D 46.7% · R 51.9% · Other 1.4%
- 2008→2024 swing
- +6.6pp toward D · 2008: -11.7pp · 2024: -5.1pp
- All cycles
- 2024: R+5.1 2020: D+0.2 2016: R+8.7 2012: R+15.7 2008: R+11.7
Not yet ingested
- Civics
- —
Market trends
- HPI YoY
- ▼ -137.12%
- Current HPI
- 237.6676
- Rent YoY
- ▲ 1.51%
- Metro
- Dallas-Fort Worth-Arlington, TX
- State GDP YoY
- ▲ 3.95%
- F500 in state
- 110
Industry mix (Fortune 500 HQ in TX)
| Industry | F500 HQs | Revenue |
|---|---|---|
| Energy | 16 | $1,198B |
|
||
| Technology | 5 | $198B |
|
||
| Engineering / Construction | 4 | $72B |
|
||
| Energy Services | 3 | $60B |
|
||
| Utilities | 3 | $41B |
|
||
| Healthcare | 2 | $330B |
|
||
Price history
-5.7% since first listed5 events — show timeline
- 2026-05-12 Pending — NTREIS
- 2026-05-02 Price Changed $165,000 NTREIS
- 2026-04-11 Listed $175,000 NTREIS
- 2008-07-24 Sold (Public Records) — Public Records
- 1989-08-08 Sold (Public Records) — Public Records
Property tax history
+5.5%/yrLatest (2025): $3,662 · +5.8% YoY. Source: county tax records.
Cash-flow waterfall
monthlySold comps — $/sqft
last 12 mo · ≤1 miLoading sold comps…