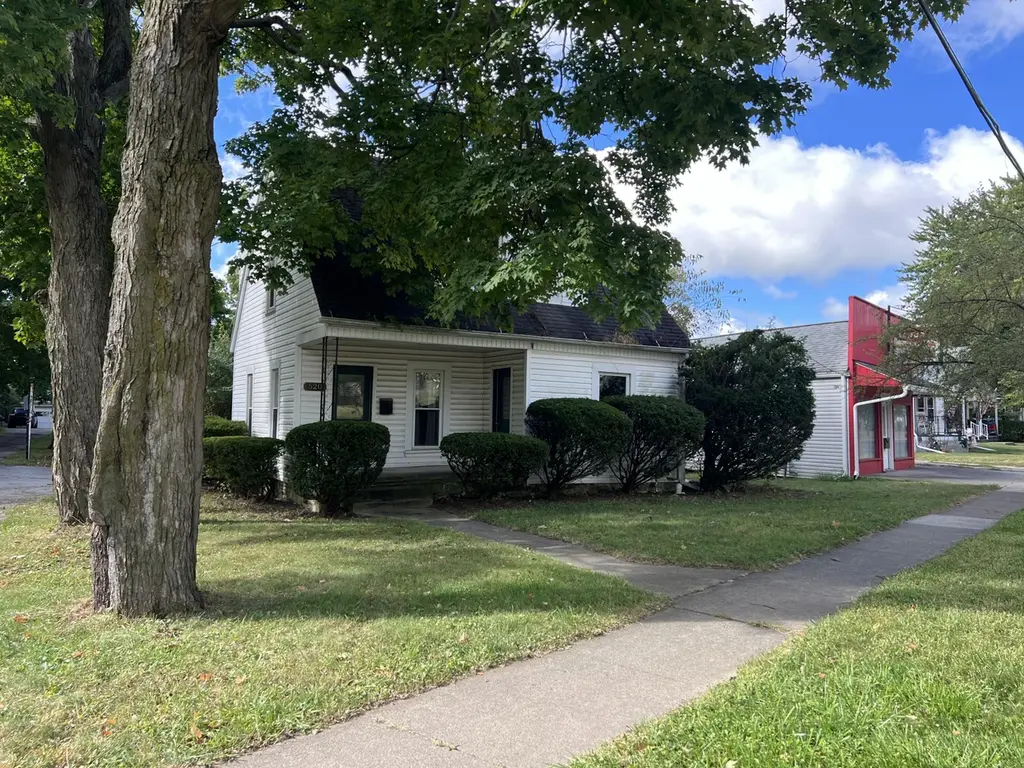
520 E Sandusky Ave · Bellefontaine, OH
Flood risk 6/10 · Moderate
- FEMA flood zone
- X (unshaded)
- Chance of flooding over 30 yrs
- 0.72%
- Est. flood insurance / yr
- $473 – $860
Fire risk 1/10 · Minimal
- Est. fire insurance / yr
- $713 – $1,323
Heat risk 3/10 · Minor
- Hot days now (above 98°F)
- 7 days/yr
- Hot days in 30 yrs
- 18 days/yr
Wind risk 2/10 · Minimal
- Chance of severe wind over 30 yrs
- —
Air-quality risk 2/10 · Minimal
- Unhealthy air days now
- 1 days/yr
- Unhealthy air days in 30 yrs
- 2 days/yr
Risk factors via First Street. Map © Google.
Why this score? — see what drove the B grade
The composite is a weighted blend of 9 inputs, each scored 0–100. Each bar is that input's sub-score; the figure is the points it added to the 100-point composite (weight × sub-score).
- Cash flow +26.4/30.0
- ARV discount +15.0/15.0
- DSCR +9.0/10.0
- 1% rule +7.2/10.0
- Schools +4.8/10.0
- Livability +3.8/5.0
- Rent growth +2.5/5.0
- Condition / age +2.5/5.0
- Appreciation +0.0/10.0
$139,900
🖨 Deal sheet (PDF) 📄 Offer letter ✓ Due diligence
Listing remarks
Welcome to this charming 3-bedroom, 1-bath home situated on a spacious 66x200 lot in the heart of Bellefontaine. Full of character and opportunity, this property is the perfect canvas for anyone looking to bring their modern farmhouse vision to life. Features include a large kitchen with abundant cabinetry and workspace, inviting living and dining areas, covered front porch with rocking chair charm, detached garage, and a deep back yard with mature trees offering privacy and shade. With a little imagination and creativity, this home could truly shine. Conveniently located within walking distance to downtown Bellefontaine, parks, the public pool, and the intermediate school, this property of
Key facts
- Covered front porch
- Deep back yard
- Large kitchen
Tags
Property features AI
Exterior
- Parking: Garage with space for 1 car
- Utilities: Public sewer; Natural gas connected
- Home design: Single-family residential property; Built in 1900
- Construction: Vinyl siding; Cellar foundation
- Exterior features: Residential lot; Lot dimensions about 66 x 200 (approximately 0.25 acre); Supplied water
Interior
- Bathrooms: 1 bathroom (full)
- Heating & cooling: Forced air heating; Natural gas heating
- Interior features: Partial, unfinished basement
Neighborhood map
What this means for you Summary
Snapshot
- This is a 3-bed/1.0-bath single-family listed at $140k.
Deal economics
- At list price, monthly cash flow is $366 ($4k/yr) — positive.
- The deal already cash-flows at list — no discount required.
- Meets the 1% rule at list price ($2k rent vs $140k).
- Recommended offer: $136k (3.0% below list) — sets the bar for market timing.
- Cap rate 9.4% vs local median 3.7% in Bellefontaine — top-decile yield for the area; either an underpriced asset or a hidden risk that comps aren't pricing in. Stress-test before assuming the spread holds.
Location & tenants
- Location reads 76/100 on livability (#213 in OH, #3,316 nationally) — a middle-class / working-renter tenant base. Strengths: crime A+, cost of living A+, housing A+; Watch: employment D+, amenities F, commute F.
- Bellefontaine City (town): math 55% / reading 59% proficiency, ranked #348 of 656 in OH (top 53%) — acceptable for families but not a draw, mixed tenant base, ~2y average lease.
- Zoned schools: Bellefontaine Elementary School (557 students, 50% FRL); Bellefontaine Middle School (math 55% / reading 54%, grade B-, #342 of 654 statewide, top 54%, 494 students, 45% FRL); Bellefontaine High School (math 42% / reading 67%, grade C-, #303 of 781 statewide, top 42%, 692 students, 41% FRL) — zoned schools at 45% FRL track the district average.
- Market conditions: 152 active listings in the ZIP; 1 comparable units currently listed for rent nearby; 121 units permitted in Logan County in 2024 (0 in 5+ unit buildings).
- This rent runs 32% of the median local income ($64k/yr) — at the standard rent-burdened threshold; future hikes will face affordability resistance.
Forward outlook
- Local home prices are declining (-3.0%/yr); year-one equity from $967 of loan paydown is wiped out by about $4k of value loss. Plan a longer hold.
- Logan County population projected at -15% by 2050 — secular population decline; favor cash flow + early exit over multi-decade hold.
- At projected returns (-3.0% appreciation + 3.0% rent growth), your $39k cash investment doubles in ~10 years — after that, you're playing with house money.
Negotiation context
- It's been on market 33 days — a 3% lower offer ($136k) is reasonable based on typical stale-listing flexibility.
- 5 sale attempts since 20y ago with the ask held roughly flat each time — persistent listings suggest the price (not the market) is what's stuck; bring a comps-based counter.
Risks & watch-outs
- Watch-outs: built in 1900 — expect roof / HVAC / electrical / plumbing capex.
- Climate carrying-cost: major flood risk — expect insurance premiums to compound above CPI over the hold.
Questions for the listing agent
- It's been on market 33 days. Have you received any prior offers? Is the seller open to a 3% concession, seller financing, or rate buy-down credit?
- Built in 1900 — when were the roof, HVAC, electrical panel, plumbing, and water heater last replaced?
- Is there a deadline driving the sale (1031 exchange, divorce, estate, relocation)? That informs how much negotiation room exists.
- What's the average days-on-market for RENTAL listings here right now (not sales)? A rising rental-DOM trend means longer vacancies and softer asking-rent achievability than the comps imply.
- What's the recent tenant-quality profile in this submarket — average credit score on applications, eviction rate, late-payment / NSF rate, and stable-employment percentage? A property-management company in the area should have these aggregated.
- How much new for-sale + rental construction is in the pipeline within 1–3 miles? Heavy new supply typically softens prices + rents 12–24 months out; constrained supply supports both.
Investment metrics
- 1% rule
- 1.22% ✓
- Cap rate
- 9.43%
- Cash-on-cash
- 11.20%
- DSCR
- 1.50
- GRM
- 6.9
CMA / ARV
- ARV (median comp)
- $194,641
- List price
- $139,900
- Delta
- -28.12%
- Verdict
- UNDERPRICED
- Comps
- 20 within 1.0 mi
Show comp detail 12 sales within ~0.75 mi
| Address | Dist | Beds/Ba | Sqft | Sold | Price | $/sf | Match |
|---|---|---|---|---|---|---|---|
| 305 N Park St | 0.29mi | 3/1.0 | 1,386 (-4%) | 6mo | $175,000 | $126 | 75 |
| 332 E Auburn Ave | 0.42mi | 4/1.0 (+1) | 1,424 (-1%) | 4mo | $225,000 | $158 | 70 |
| 137 N Stanley St | 0.09mi | 3/2.0 | 1,610 (+12%) | 5mo | $181,000 | $112 | 68 |
| 204 E Spring Ave | 0.64mi | 3/1.0 | 1,440 (+0%) | 5mo | $189,000 | $131 | 65 |
| 813 Cooper Ave | 0.54mi | 2/1.5 (-1) | 1,430 (-0%) | 7mo | $239,900 | $168 | 61 |
| 780 E Sandusky Ave | 0.41mi | 3/2.0 | 1,326 (-8%) | 6mo | $240,000 | $181 | 59 |
| 1112 Allison Rd | 0.74mi | 3/2.5 | 1,452 (+1%) | 3mo | $340,000 | $234 | 55 |
| 312 E Palmer Rd | 0.45mi | 3/1.5 | 1,250 (-13%) | 2mo | $195,000 | $156 | 54 |
| 104 Organ St | 0.65mi | 3/2.0 | 1,336 (-7%) | 6mo | $280,000 | $210 | 49 |
| 317 N Elm St | 0.68mi | 4/1.0 (+1) | 1,311 (-9%) | 1mo | $60,000 | $46 | 48 |
| 524 N Elm St | 0.72mi | 3/1.0 | 1,269 (-12%) | 6mo | $137,500 | $108 | 42 |
| 641 N Detroit St | 0.72mi | 3/1.0 | 1,231 (-14%) | 1mo | $172,000 | $140 | 42 |
Match score weights: distance 35% · size 25% · config 20% · recency 20%. Top-matched comps best support the ARV.
Projected returns pro-forma
-3.0% appreciation · 3.0% rent growth · sell at horizon
- IRR
- 0.4%
- Equity multiple
- 1.02×
- Total profit
- $643
- Equity at exit
- $20,860
- IRR
- 10.1%
- Equity multiple
- 1.78×
- Total profit
- $30,669
- Equity at exit
- $12,096
Cash invested: $39,172 (down + closing). Projections, not guarantees.
Landlord ↔ Tenant lean methodology
- Overall (STATE)
- 73 Landlord-Friendly
- State Ohio
- 73 Landlord-Friendly · R+6
- County
- — inherits STATE
- City
- — inherits STATE
ZIP-level market 43311
- Active inventory
- 152
- Price-to-rent
- 6.9×
Monthly cashflow live
- Estimated rent
- $1,700 medium interval (Pro) →
- Mortgage (P&I)
- −$734
- Tax from tax record
- −$186 /mo · $2,226/yr
- Insurance
- −$58
- HOA
- −$0
- Vacancy / Maint / Mgmt
- −$357
- Net cashflow
- $366
Break-even live
Sensitivity live
| Price | -10% $445 | -5% $405 | +0% $366 | +5% $326 | +10% $286 |
|---|---|---|---|---|---|
| Rent | -10% $231 | -5% $298 | +0% $366 | +5% $433 | +10% $500 |
| Rate | -1.0pp $436 | -0.5pp $401 | base $366 | +0.5pp $329 | +1.0pp $292 |
UW: 25.0% down · 7.5% · 30yr · 1.5% tax · 5.0% vac · 8.0% maint · 8.0% mgmt
Financing live
Cash to close
- Down payment
- $34,975
- Closing costs
- $4,197
- Reserves months
- —
- Total cash needed
- —
Loan-product check · same deal, 3 products live
Conventional
25% down · 7.5% · 30yr
- Down + closing
- —
- Monthly P&I
- —
- Monthly cashflow
- —
- DSCR
- —
- Eligible?
- —
Personal DTI + credit; lowest rate.
DSCR
20% down · 8.5% · 30yr
- Down + closing
- —
- Monthly P&I
- —
- Monthly cashflow
- —
- DSCR
- —
- Eligible?
- —
No personal income docs; deal must DSCR.
Hard money
10% down · 12.0% · 12mo
- Down + closing
- —
- Monthly P&I
- —
- Monthly cashflow
- —
- DSCR
- —
- Eligible?
- —
Short-term bridge; refi at stabilization.
Rent comps 1 comps
| Address | Beds | Baths | Sqft | Rent | $/sqft | DOM | Units | Dist |
|---|---|---|---|---|---|---|---|---|
| 520 N Madriver St Bellefontaine, OH | 4.0 | 1.5 | 1600 | $1,700 | $1.06 | 45d | 1 | 0.43mi |
Listing history 28 events
-
2026-06-21days on market $139,900 Active 33 DOM
-
2026-06-21days on market $139,900 Active 32 DOM
-
2026-06-18days on market $139,900 Active 30 DOM
-
2026-06-17days on market $139,900 Active 29 DOM
-
2026-06-16days on market $139,900 Active 28 DOM
-
2026-06-15days on market $139,900 Active 27 DOM
-
2026-06-13days on market $139,900 Active 25 DOM
-
2026-06-12days on market $139,900 Active 24 DOM
-
2026-06-09days on market $139,900 Active 21 DOM
-
2026-06-08days on market $139,900 Active 20 DOM
-
2026-06-07days on market $139,900 Active 19 DOM
-
2026-06-07days on market $139,900 Active 18 DOM
-
2026-06-04days on market $139,900 Active 15 DOM
-
2026-06-02days on market $139,900 Active 14 DOM
-
2026-06-01days on market $139,900 Active 13 DOM
-
2026-05-31days on market $139,900 Active 12 DOM
-
2026-05-19$139,900 Active 948-char remark
-
2026-05-15historical
-
2025-08-21price $139,900
-
2025-05-22price $147,500
-
2025-03-14price $159,900
-
2024-09-06$179,900 Active
-
2016-11-04historical
-
2009-06-30historical
-
2009-03-17$83,000
-
2007-03-12$83,000
-
2006-11-12historical
-
2006-02-12$88,500
ⓘ Source: listings_history table (triggers on properties + properties_extension) + one-shot
backfill from property_details.listing_events for pre-trigger history.
Tax reassessment forecast OH · Partial reset (capped growth)
- Current annual tax
- $2,226 · $186/mo
- Projected year-2 tax
- $2,226 · $186/mo
- Expected delta
- $0/yr ($0/mo · 0.0%)
ⓘ Screening estimate from a state-policy table — verify with the county assessor before closing.
Climate risk First Street
- Flood 6/10 Major FEMA zone X (unshaded) · 72% chance over 30 yrs
- Wildfire 1/10 Low
- Heat 3/10 Moderate 7 d/yr ≥98°F today · 18 d/yr by 30 yrs out
- Wind 2/10 Low
- Air quality 2/10 Low 1 unhealthy d/yr today · 2 by 30 yrs out
Nearby sold comps map
Loading sold comps map…
Walkable amenities ~0.75 mi
Loading nearby amenities…
Taxation est. · year 1
- Rental income
- $20,400
- − Mortgage interest
- −$7,837
- − Property taxes
- −$2,226
- − Insurance
- −$700
- − Repairs & maintenance
- −$1,632
- − Management
- −$1,632
- − Depreciation
- −$4,070
- Taxable income
- $2,304
- Est. tax owed @ 24.0%
- −$553
- After-tax cash flow
- $3,833/yr
For passive investors: Depreciation is non-cash, so a rental often shows a tax loss while cash-flowing — sheltering income. Rental losses are passive: they offset passive income freely, and up to $25,000/yr can offset ordinary (W-2) income if you actively participate and your MAGI is under $100k (phasing out to $0 by $150k); unused losses carry forward. On sale, claimed depreciation is recaptured at up to 25%, and gains may owe capital-gains tax (a 1031 exchange can defer both). Figures are a year-1 estimate at your 24.0% rate — not tax advice; consult a CPA.
Schools (NCES district)
- District
- Bellefontaine City
- NCES district ID
- 3904358
- Math proficiency
- 55% ▼ -10.00%
- Reading proficiency
- 59% ▼ -6.00%
- Median HH income
- $43,270
- Composite
- 47.94/100
- National rank
- #2207
- State rank
- #348 of 656 in OH
Livability — Bellefontaine
- Score
- 76/100
- State rank
- #213
- US rank
- #3316
Category grades
Schools grade is shown separately in the Schools card above.
Census & demographics
- Census place
- Bellefontaine, OH
- County
- Logan · 47,256 people
- City population
- 20,074
- Population (ZIP)
- 20,074
- Household income
- $64,217
- Rent vs Own
- Severe rent burden
- 10.1
Population outlook (Logan County) Hauer SSP2
- Today (2025)
- 44,240 people
- By 2030
- 43,166 · -2.4%
- By 2040
- 40,495 · -8.5%
- By 2050
- 37,511 · -15.2%
- By 2075
- 30,453 · -31.2%
- By 2100
- 23,081 · -47.8%
Race, ethnicity, and origin ACS 2023
- Neighborhood character
- Predominantly White (90%)
- Race & ethnicity
- White 90% Two or more races 5% Black 3% Hispanic / Latino 2%
- Common ancestry
- Italian 4% Slovak 4% Lithuanian 2%
- Foreign-born
- 2% · Canada
- Languages at home
- 98% English-only · Spanish 1%
Political lean MEDSL · Logan
- 2024 margin
- Solid R (+56.2) · D 21.5% · R 77.7%
- 2008→2024 swing
- -29.6pp toward R · 2008: -26.6pp · 2024: -56.2pp
- All cycles
- 2024: R+56.2 2020: R+55.2 2016: R+52.6 2012: R+31.8 2008: R+26.6
Not yet ingested
- Civics
- —
Market trends
- HPI YoY
- ▼ -182.18%
- Current HPI
- 243.9954
- Rent YoY
- —
- Metro
- —
- State GDP YoY
- ▲ 1.98%
- F500 in state
- 48
Industry mix (Fortune 500 HQ in OH)
| Industry | F500 HQs | Revenue |
|---|---|---|
| Insurance | 3 | $145B |
|
||
| Industrial Machinery | 3 | $49B |
|
||
| Financial Services | 3 | $24B |
|
||
| Consumer Goods | 2 | $93B |
|
||
| Aerospace / Defense | 2 | $47B |
|
||
| Utilities | 2 | $33B |
|
||
Price history
+58.1% since first listed12 events — show timeline
- 2026-05-19 Listed $139,900 WRIST
- 2026-05-15 Listing Removed — WRIST
- 2025-08-21 Price Changed $139,900 WRIST
- 2025-05-22 Price Changed $147,500 WRIST
- 2025-03-14 Price Changed $159,900 WRIST
- 2024-09-06 Listed $179,900 WRIST
- 2016-11-04 Listing Removed — WRIST
- 2009-06-30 Listing Removed — WRIST
- 2009-03-17 Listed $83,000 WRIST
- 2007-03-12 Listed $83,000 WRIST
- 2006-11-12 Listing Removed — WRIST
- 2006-02-12 Listed $88,500 WRIST
Property tax history
+6.8%/yrLatest (2025): $2,226 · +33.4% YoY. Source: county tax records.
Cash-flow waterfall
monthlySold comps — $/sqft
last 12 mo · ≤1 miLoading sold comps…