4995 Co Rd 48 · Russellville, AL
Flood risk 8/10 · Major
- FEMA flood zone
- X (unshaded)
- Chance of flooding over 30 yrs
- 0.99%
- Est. flood insurance / yr
- $507 – $1,088
Fire risk 5/10 · Moderate
- Est. fire insurance / yr
- $916 – $1,700
Heat risk 5/10 · Moderate
- Hot days now (above 106°F)
- 7 days/yr
- Hot days in 30 yrs
- 18 days/yr
Wind risk 4/10 · Minor
- Chance of severe wind over 30 yrs
- 22.0%
Air-quality risk 2/10 · Minimal
- Unhealthy air days now
- 1 days/yr
- Unhealthy air days in 30 yrs
- 1 days/yr
Risk factors via First Street. Map © Google.
Why this score? — see what drove the D+ grade
The composite is a weighted blend of 9 inputs, each scored 0–100. Each bar is that input's sub-score; the figure is the points it added to the 100-point composite (weight × sub-score).
- Cash flow +18.0/30.0
- ARV discount +7.5/15.0
- DSCR +5.6/10.0
- 1% rule +4.8/10.0
- Livability +3.6/5.0
- Rent growth +2.5/5.0
- Schools +2.2/10.0
- Condition / age +2.2/5.0
- Appreciation +0.6/10.0
$101,000
🖨 Deal sheet (PDF) 📄 Offer letter ✓ Due diligence
Listing remarks
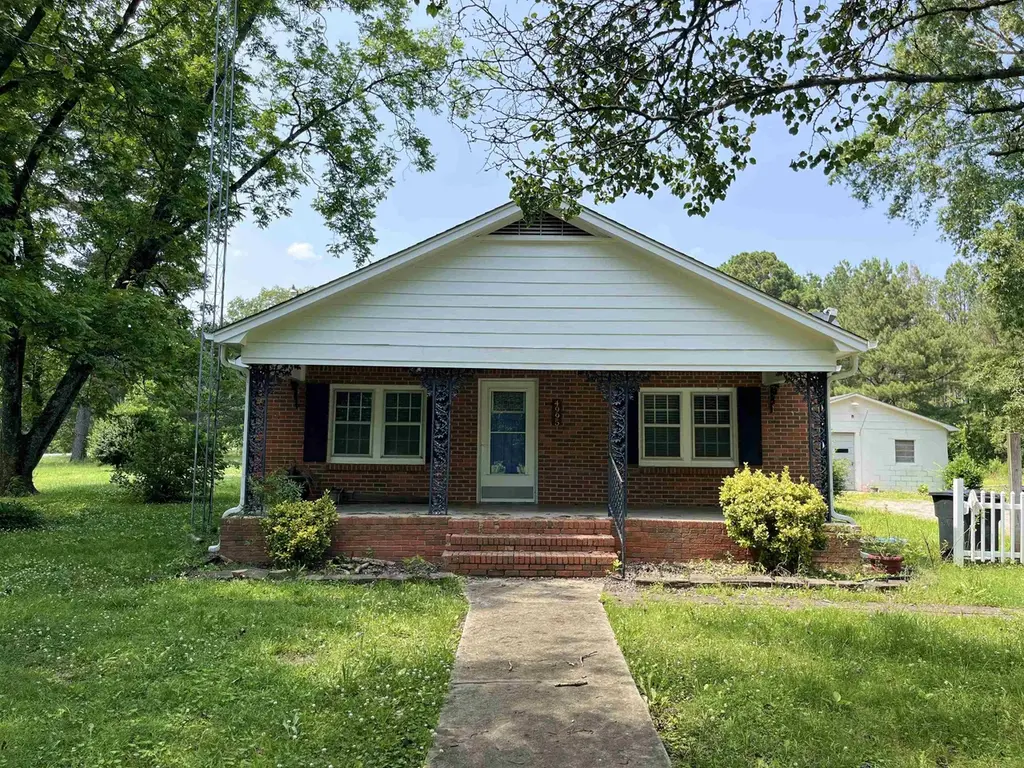
Quaint home in the country with acreage.
Key facts
- 2 acre lot
- Garage
- Built 1946
Neighborhood map
What this means for you Summary
Snapshot
- This is a 2-bed/2.0-bath single-family listed at $101k. Condition is rated fair.
Deal economics
- At list price, monthly cash flow is $20 ($244/yr) — positive.
- The deal already cash-flows at list — no discount required.
- To meet the 1% rule (rent ≥ 1% of price), the offer needs to be $99k (1.6% below list).
- Recommended offer: $99k (1.6% below list) — sets the bar for 1% rule.
- Cap rate 7.3% vs local median 2.9% in Russellville — top-decile yield for the area; either an underpriced asset or a hidden risk that comps aren't pricing in. Stress-test before assuming the spread holds.
Location & tenants
- Location reads 71/100 on livability (#37 in AL) — a middle-class / working-renter tenant base. Strengths: cost of living A+, housing A+, health & safety A+; Watch: employment D, amenities F, commute F.
- Franklin County (rural): math 17% / reading 36% proficiency, ranked #84 of 129 in AL (top 65%) — low school quality limits family demand, transient renter base, plan for 1-2y turnover.
- Market conditions: 43 active listings in the ZIP; 15 units permitted in Franklin County in 2024 (0 in 5+ unit buildings).
Forward outlook
- Local home prices are declining (-3.0%/yr); year-one equity from $698 of loan paydown is wiped out by about $3k of value loss. Plan a longer hold.
Negotiation context
- Only 1 days on market — expect competitive offers; lowballing is unlikely to land.
Risks & watch-outs
- Watch-outs: flood insurance adds $66/mo; built in 1946 — expect roof / HVAC / electrical / plumbing capex.
- Climate carrying-cost: severe flood risk; moderate wildfire risk; extreme-heat days projected 7→18/yr by 2055 (HVAC capex compounding) — expect insurance premiums to compound above CPI over the hold.
Questions for the listing agent
- Have any recent inspections been done? Can we get a copy of the seller's disclosures and any deferred-maintenance estimates?
- Built in 1946 — when were the roof, HVAC, electrical panel, plumbing, and water heater last replaced?
- What's the actual annual flood-insurance premium (NFIP or private), and is the property in a SFHA with mandatory coverage?
- Is there a deadline driving the sale (1031 exchange, divorce, estate, relocation)? That informs how much negotiation room exists.
- Schools are F-rated, which usually means shorter tenancies and higher turnover. Who's the typical renter profile here, and what's been the actual vacancy rate?
- The area grade is low — what's the realistic commute time and amenity access for the typical tenant pool here? Any planned neighborhood developments (good or bad) we should know about?
- What's the average days-on-market for RENTAL listings here right now (not sales)? A rising rental-DOM trend means longer vacancies and softer asking-rent achievability than the comps imply.
- What's the recent tenant-quality profile in this submarket — average credit score on applications, eviction rate, late-payment / NSF rate, and stable-employment percentage? A property-management company in the area should have these aggregated.
- How much new for-sale + rental construction is in the pipeline within 1–3 miles? Heavy new supply typically softens prices + rents 12–24 months out; constrained supply supports both.
Investment metrics
- 1% rule
- 0.98% ✗
- Cap rate
- 7.32%
- Cash-on-cash
- 3.68%
- DSCR
- 1.16
- GRM
- 8.5
CMA / ARV
- ARV (on-the-fly)
- $100,936
- Comps found
- 1
Show comp detail 1 sale within ~0.75 mi
| Address | Dist | Beds/Ba | Sqft | Sold | Price | $/sf | Match |
|---|---|---|---|---|---|---|---|
| 4995 Co Rd 48 | 0.00mi | 2/2.0 | 1,147 (0%) | 0mo | $101,000 | $88 | 100 |
Match score weights: distance 35% · size 25% · config 20% · recency 20%. Top-matched comps best support the ARV.
Projected returns pro-forma
-3.0% appreciation · 3.0% rent growth · sell at horizon
- IRR
- -14.9%
- Equity multiple
- 0.47×
- Total profit
- $-15,016
- Equity at exit
- $15,059
- IRR
- -6.1%
- Equity multiple
- 0.60×
- Total profit
- $-11,182
- Equity at exit
- $8,733
Cash invested: $28,280 (down + closing). Projections, not guarantees.
Landlord ↔ Tenant lean methodology
- Overall (STATE)
- 90 Strongly Landlord-Friendly
- State Alabama
- 90 Strongly Landlord-Friendly · R+15
- County
- — inherits STATE
- City
- — inherits STATE
ZIP-level market 35654
- Home prices YoY
- -4.6%
- Active inventory
- 43
- Price-to-rent
- 8.5×
Monthly cashflow live
- Estimated rent
- $993 medium interval (Pro) →
- Mortgage (P&I)
- −$530
- Tax est. 1.5%
- −$126 /mo · $1,515/yr
- Insurance
- −$42
- Flood insurance flood zone
- −$66 /mo · $798/yr
- HOA
- −$0
- Vacancy / Maint / Mgmt
- −$209
- Net cashflow
- $20
Break-even live
Sensitivity live
| Price | -10% $90 | -5% $55 | +0% $20 | +5% $-15 | +10% $-49 |
|---|---|---|---|---|---|
| Rent | -10% $-58 | -5% $-19 | +0% $20 | +5% $60 | +10% $99 |
| Rate | -1.0pp $71 | -0.5pp $46 | base $20 | +0.5pp $-6 | +1.0pp $-32 |
UW: 25.0% down · 7.5% · 30yr · 1.5% tax · 5.0% vac · 8.0% maint · 8.0% mgmt
Financing live
Cash to close
- Down payment
- $25,250
- Closing costs
- $3,030
- Reserves months
- —
- Total cash needed
- —
Loan-product check · same deal, 3 products live
Conventional
25% down · 7.5% · 30yr
- Down + closing
- —
- Monthly P&I
- —
- Monthly cashflow
- —
- DSCR
- —
- Eligible?
- —
Personal DTI + credit; lowest rate.
DSCR
20% down · 8.5% · 30yr
- Down + closing
- —
- Monthly P&I
- —
- Monthly cashflow
- —
- DSCR
- —
- Eligible?
- —
No personal income docs; deal must DSCR.
Hard money
10% down · 12.0% · 12mo
- Down + closing
- —
- Monthly P&I
- —
- Monthly cashflow
- —
- DSCR
- —
- Eligible?
- —
Short-term bridge; refi at stabilization.
Listing history 2 events
-
2026-04-22status Pending
-
2026-04-20$101,000 Active
ⓘ Source: listings_history table (triggers on properties + properties_extension) + one-shot
backfill from property_details.listing_events for pre-trigger history.
Climate risk First Street
- Flood 8/10 Severe FEMA zone X (unshaded) · 99% chance over 30 yrs
- Wildfire 5/10 Major
- Heat 5/10 Major 7 d/yr ≥106°F today · 18 d/yr by 30 yrs out
- Wind 4/10 Moderate 22% chance of damaging wind over 30 yrs
- Air quality 2/10 Low 1 unhealthy d/yr today · 1 by 30 yrs out
Nearby sold comps map
Loading sold comps map…
Walkable amenities ~0.75 mi
Loading nearby amenities…
Taxation est. · year 1
- Rental income
- $11,921
- − Mortgage interest
- −$5,658
- − Property taxes
- −$1,515
- − Insurance
- −$1,302
- − Repairs & maintenance
- −$954
- − Management
- −$954
- − Depreciation
- −$2,938
- Taxable loss
- −$1,400
- Est. tax savings @ 24.0%
- +$336
- After-tax cash flow
- $580/yr
For passive investors: Depreciation is non-cash, so a rental often shows a tax loss while cash-flowing — sheltering income. Rental losses are passive: they offset passive income freely, and up to $25,000/yr can offset ordinary (W-2) income if you actively participate and your MAGI is under $100k (phasing out to $0 by $150k); unused losses carry forward. On sale, claimed depreciation is recaptured at up to 25%, and gains may owe capital-gains tax (a 1031 exchange can defer both). Figures are a year-1 estimate at your 24.0% rate — not tax advice; consult a CPA.
Condition & rehab AI · 2 photos
The home requires significant repairs to the roof and siding, along with painting and landscaping improvements. These updates will substantially increase its value for both resale and rental.
Repairs flagged
- Major roof — Signs of damage and potential leaks are visible.
- Major siding — The siding is worn and peeling in places.
- Major paint — The paint is peeling in several areas, indicating a need for repainting.
Value-add opportunities
- Both repair and replace roof — A new roof will significantly improve the home's appearance and functionality, enhancing both resale and rental value.
- Both repair and replace siding — New siding will improve the home's curb appeal and increase its value for both resale and rental.
- Both paint exterior — Fresh paint will make the home look more inviting and well-maintained, boosting its value.
- Both landscaping and fencing — A well-maintained yard and fence will enhance the home's curb appeal and increase its value for both resale and rental.
Renovation cost estimate screening
| Repair item | Severity | Est. cost |
|---|---|---|
| roof · Signs of damage and potential leaks are visible. | Major | $15,000–50,000 |
| siding · The siding is worn and peeling in places. | Major | $15,000–50,000 |
| paint · The paint is peeling in several areas, indicating a need for repainting. | Major | $15,000–50,000 |
| Total estimated repair cost · 3 items | $45,000–150,000 |
Value-add ROI direction
- Both repair and replace roof — A new roof will significantly improve the home's appearance and functionality, enhancing both resale and rental value. ↑
- Both repair and replace siding — New siding will improve the home's curb appeal and increase its value for both resale and rental. ↑
- Both paint exterior — Fresh paint will make the home look more inviting and well-maintained, boosting its value. ↑
- Both landscaping and fencing — A well-maintained yard and fence will enhance the home's curb appeal and increase its value for both resale and rental. ↑
ⓘ Cost ranges are severity-bucket heuristics (US national rule-of-thumb). Get contractor quotes + a written scope before underwriting a rehab budget.
Schools (NCES district)
- District
- Franklin County
- NCES district ID
- 0101590
- Math proficiency
- 17% ▼ -21.00%
- Reading proficiency
- 36% ▼ -1.00%
- Median HH income
- $37,979
- Composite
- 22.08/100
- National rank
- #8187
- State rank
- #84 of 129 in AL
Livability — Russellville
- Score
- 71/100
- State rank
- #37
- US rank
- #6823
Category grades
Schools grade is shown separately in the Schools card above.
Census & demographics
- Population (ZIP)
- 8,396
Population outlook (Franklin County) Hauer SSP2
- Today (2025)
- 31,545 people
- By 2030
- 31,335 · -0.7%
- By 2040
- 30,983 · -1.8%
- By 2050
- 30,744 · -2.5%
- By 2075
- 30,173 · -4.3%
- By 2100
- 29,478 · -6.6%
Race, ethnicity, and origin ACS 2023
- Neighborhood character
- Predominantly White (76%)
- Race & ethnicity
- White 76% Hispanic / Latino 18% Two or more races 8% Black 4% Native American 1%
- Hispanic origin (detail)
- Mexican 11%
- Common ancestry
- Serbian 1% Italian 1% Lithuanian 1%
- Foreign-born
- 9% · Canada
- Languages at home
- 85% English-only · Spanish 15%
Political lean MEDSL · Franklin
- 2024 margin
- Solid R (+73.3) · D 13.0% · R 86.2%
- 2008→2024 swing
- -34.1pp toward R · 2008: -39.2pp · 2024: -73.3pp
- All cycles
- 2024: R+73.3 2020: R+65.9 2016: R+60.8 2012: R+40.5 2008: R+39.2
Not yet ingested
- Civics
- —
Market trends
- HPI YoY
- ▼ -8.75%
- Current HPI
- 181.7
- Rent YoY
- —
- Metro
- —
- State GDP YoY
- ▲ 2.94%
- F500 in state
- 4
Industry mix (Fortune 500 HQ in AL)
| Industry | F500 HQs | Revenue |
|---|---|---|
| Financial Services | 1 | $8B |
|
||
| Healthcare | 1 | $5B |
|
||
Price history
2 events — show timeline
- 2026-04-22 Pending — SAARMLS
- 2026-04-20 Listed $101,000 SAARMLS
Cash-flow waterfall
monthlySold comps — $/sqft
last 12 mo · ≤1 miLoading sold comps…