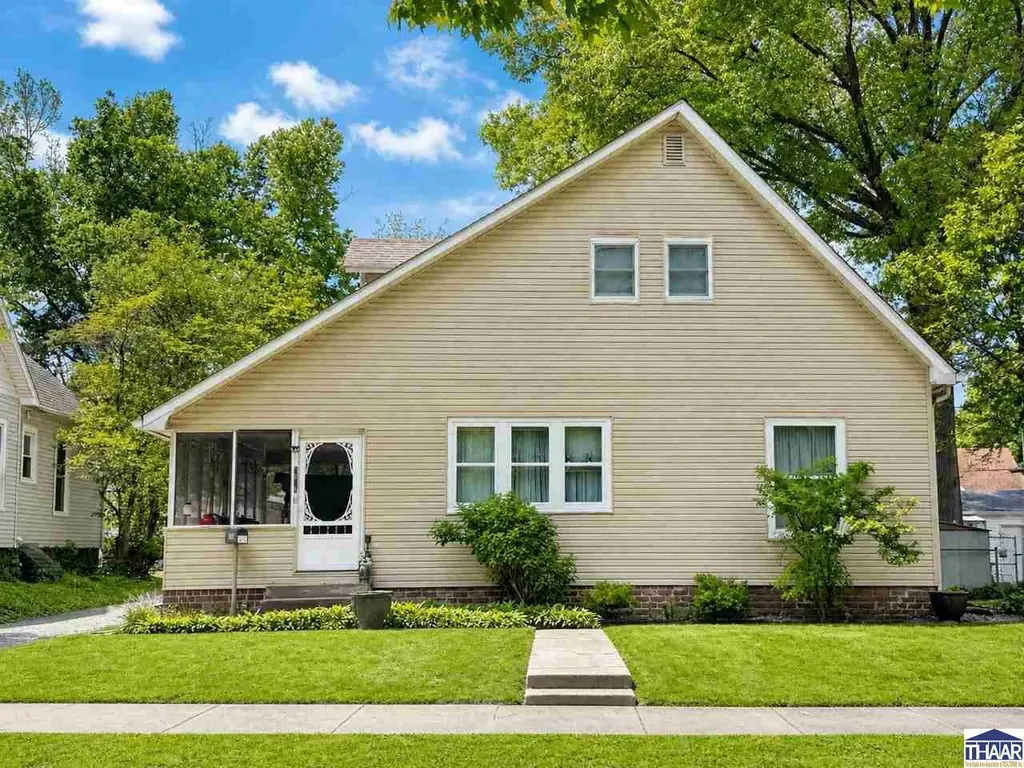
1016 N Walnut St · Brazil, IN
Flood risk 1/10 · Minimal
- FEMA flood zone
- X (unshaded)
- Chance of flooding over 30 yrs
- 0.0%
- Est. flood insurance / yr
- $473 – $860
Fire risk 1/10 · Minimal
- Est. fire insurance / yr
- $717 – $1,331
Heat risk 4/10 · Minor
- Hot days now (above 104°F)
- 7 days/yr
- Hot days in 30 yrs
- 19 days/yr
Wind risk 2/10 · Minimal
- Chance of severe wind over 30 yrs
- 1.0%
Air-quality risk 2/10 · Minimal
- Unhealthy air days now
- 1 days/yr
- Unhealthy air days in 30 yrs
- 1 days/yr
Risk factors via First Street. Map © Google.
Why this score? — see what drove the D grade
The composite is a weighted blend of 9 inputs, each scored 0–100. Each bar is that input's sub-score; the figure is the points it added to the 100-point composite (weight × sub-score).
- ARV discount +15.0/15.0
- Cash flow +10.6/30.0
- Schools +4.0/10.0
- Livability +3.3/5.0
- DSCR +3.1/10.0
- Rent growth +2.5/5.0
- Condition / age +2.5/5.0
- 1% rule +1.9/10.0
- Appreciation +0.0/10.0
$127,000
🖨 Deal sheet 📄 Offer letter ✓ Due diligence
Listing remarks
Welcome to this delightful home, where original doors and arched doorways set the tone for a life of warmth and charm. The inviting enclosed screened front porch is an absolute haven, perfect for relaxing and unwinding. The main level offers 2 bedrooms, a full bath, a spacious living room, and a formal dining room, all perfectly proportioned for comfort and elegance. The step-saver kitchen shines with stainless steel appliances, a large pantry, and a bright breakfast nook. An enclosed back porch provides extra space to lounge. The upper level boasts 2 spacious bedrooms, plus an unfinished area full of possibilities. Downstairs, the basement features a practical washer and dryer area, along
Key facts
- Original doors
- Formal dining room
- Arched doorways
Tags
Property features AI
Exterior
- Parking: Detached gravel garage (1 car)
- Security: Smoke detectors
- Utilities: Public sewer
- Home design: Single family residence; 1 story
- Construction: Vinyl siding; Shingle roof
- Exterior features: Porch (screened)
Interior
- Kitchen: Electric range; Electric oven; Microwave; Refrigerator; Freezer
- Flooring: Carpet; Hardwood
- Bathrooms: 1 full bathroom
- Heating & cooling: Forced air heating (natural gas); Central air; Ceiling fans
- Interior features: Window coverings; Insulated windows; Fireplace (1)
- Laundry & utility: Washer; Dryer; Partial unfinished basement
Neighborhood map
What this means for you Summary
Snapshot
- This is a 2-bed/1.0-bath single-family listed at $127k.
Deal economics
- At list price, monthly cash flow is $-62 ($-743/yr) — negative.
- To cash-flow at today's rent, offer at most $116k (8.6% below list).
- To meet the 1% rule (rent ≥ 1% of price), the offer needs to be $88k (31.1% below list).
- Recommended offer: $88k (31.1% below list) — sets the bar for 1% rule.
- Cap rate 5.7% vs local median 2.6% in Brazil — top-decile yield for the area; either an underpriced asset or a hidden risk that comps aren't pricing in. Stress-test before assuming the spread holds.
Location & tenants
- Location reads 66/100 on livability (#308 in IN) — a middle-class / working-renter tenant base. Strengths: cost of living A+, housing A+, health & safety A+; Watch: crime F, amenities F, commute F.
- Clay Community Schools (rural): math 46% / reading 49% proficiency, ranked #79 of 301 in IN (top 26%) — families likely to look elsewhere, expect single-tenant / working-renter base with shorter leases.
- Market conditions: 95 active listings in the ZIP; 70 units permitted in Clay County in 2024 (0 in 5+ unit buildings).
Forward outlook
- Local home prices are declining (-3.0%/yr); year-one equity from $878 of loan paydown is wiped out by about $4k of value loss. Plan a longer hold.
- Clay County population projected at -16% by 2050 — secular population decline; favor cash flow + early exit over multi-decade hold.
Negotiation context
- It's been on market 35 days — a 3% lower offer ($123k) is reasonable based on typical stale-listing flexibility.
Risks & watch-outs
- Watch-outs: built in 1900 — expect roof / HVAC / electrical / plumbing capex.
Questions for the listing agent
- What do current leases actually rent for vs. the listed asking? Can we see a recent rent roll and the last 12 months of T-12 income?
- It's been on market 35 days. Have you received any prior offers? Is the seller open to a 31% concession, seller financing, or rate buy-down credit?
- Built in 1900 — when were the roof, HVAC, electrical panel, plumbing, and water heater last replaced?
- Is there a deadline driving the sale (1031 exchange, divorce, estate, relocation)? That informs how much negotiation room exists.
- Crime grade is F in this area — have there been break-ins, vandalism, or insurance claims at this property in the last 3 years? What carrier currently insures it and at what premium?
- The area grade is low — what's the realistic commute time and amenity access for the typical tenant pool here? Any planned neighborhood developments (good or bad) we should know about?
- What's the average days-on-market for RENTAL listings here right now (not sales)? A rising rental-DOM trend means longer vacancies and softer asking-rent achievability than the comps imply.
- What's the recent tenant-quality profile in this submarket — average credit score on applications, eviction rate, late-payment / NSF rate, and stable-employment percentage? A property-management company in the area should have these aggregated.
- How much new for-sale + rental construction is in the pipeline within 1–3 miles? Heavy new supply typically softens prices + rents 12–24 months out; constrained supply supports both.
Investment metrics
- 1% rule
- 0.69% ✗
- Cap rate
- 5.71%
- Cash-on-cash
- -2.09%
- DSCR
- 0.91
- GRM
- 12.1
CMA / ARV
- ARV (median comp)
- $161,324
- List price
- $127,000
- Delta
- -21.28%
- Verdict
- UNDERPRICED
- Comps
- 20 within 1.0 mi
Show comp detail 12 sales within ~0.75 mi
| Address | Dist | Beds/Ba | Sqft | Sold | Price | $/sf | Match |
|---|---|---|---|---|---|---|---|
| 16 W Park St | 0.05mi | 3/2.0 (+1) | 1,952 (-7%) | 5mo | $157,500 | $81 | 73 |
| 1403 N Walnut St | 0.29mi | 3/2.0 (+1) | 1,984 (-5%) | 0mo | $270,000 | $136 | 69 |
| 921 N Meridian St St | 0.07mi | 3/2.0 (+1) | 1,923 (-8%) | 7mo | $182,000 | $95 | 68 |
| 807 N Alabama Street St | 0.39mi | 3/2.0 (+1) | 2,010 (-4%) | 1mo | $229,900 | $114 | 66 |
| 407 E Jackson St | 0.63mi | 2/1.0 | 2,016 (-4%) | 5mo | $120,000 | $60 | 60 |
| 11 Dr Daniel Biggs St | 0.44mi | 3/1.5 (+1) | 1,992 (-5%) | 7mo | $155,000 | $78 | 59 |
| 334 E Vermont St | 0.26mi | 3/1.0 (+1) | 1,810 (-13%) | 10mo | $115,000 | $64 | 52 |
| 617 N Meridian St | 0.26mi | 3/2.5 (+1) | 1,792 (-14%) | 2mo | $285,000 | $159 | 51 |
| 10325 N Meridian St Rd | 0.63mi | 3/1.5 (+1) | 2,020 (-3%) | 11mo | $279,000 | $138 | 49 |
| 623 N Harrison St | 0.46mi | 3/1.0 (+1) | 1,786 (-14%) | 10mo | $62,000 | $35 | 41 |
| 804 E Hendrix St | 0.54mi | 3/1.0 (+1) | 1,830 (-12%) | 11mo | $130,000 | $71 | 40 |
| 3342 W State Road 340 | 0.55mi | 3/1.0 (+1) | 1,858 (-11%) | 21mo | $166,750 | $90 | 34 |
Match score weights: distance 35% · size 25% · config 20% · recency 20%. Top-matched comps best support the ARV.
Projected returns pro-forma
-3.0% appreciation · 3.0% rent growth · sell at horizon
- IRR
- -19.8%
- Equity multiple
- 0.31×
- Total profit
- $-24,588
- Equity at exit
- $18,936
- IRR
- -12.8%
- Equity multiple
- 0.25×
- Total profit
- $-26,749
- Equity at exit
- $10,981
Cash invested: $35,560 (down + closing). Projections, not guarantees.
Landlord ↔ Tenant lean methodology
- Overall (STATE)
- 90 Strongly Landlord-Friendly
- State Indiana
- 90 Strongly Landlord-Friendly · R+11
- County
- — inherits STATE
- City
- — inherits STATE
ZIP-level market 47834
- Home prices YoY
- -20.8%
- Active inventory
- 95
- Price-to-rent
- 12.1×
Monthly cashflow live
- Estimated rent
- $875 medium interval (Pro) →
- Mortgage (P&I)
- −$666
- Tax from tax record
- −$35 /mo · $415/yr
- Insurance
- −$53
- HOA
- −$0
- Vacancy / Maint / Mgmt
- −$184
- Net cashflow
- $-62
Break-even live
UW: 25.0% down · 7.5% · 30yr · 1.5% tax · 5.0% vac · 8.0% maint · 8.0% mgmt
Financing live
Cash to close
- Down payment
- $31,750
- Closing costs
- $3,810
- Reserves months
- —
- Total cash needed
- —
Loan-product check · same deal, 3 products live
Conventional
25% down · 7.5% · 30yr
- Down + closing
- —
- Monthly P&I
- —
- Monthly cashflow
- —
- DSCR
- —
- Eligible?
- —
Personal DTI + credit; lowest rate.
DSCR
20% down · 8.5% · 30yr
- Down + closing
- —
- Monthly P&I
- —
- Monthly cashflow
- —
- DSCR
- —
- Eligible?
- —
No personal income docs; deal must DSCR.
Hard money
10% down · 12.0% · 12mo
- Down + closing
- —
- Monthly P&I
- —
- Monthly cashflow
- —
- DSCR
- —
- Eligible?
- —
Short-term bridge; refi at stabilization.
Listing history 10 events
-
2026-06-09status $127,000 Pending 35 DOM
-
2026-06-08days on market $127,000 Active 35 DOM
-
2026-06-07days on market $127,000 Active 34 DOM
-
2026-06-05days on market $127,000 Active 31 DOM
-
2026-06-02days on market $127,000 Active 29 DOM
-
2026-06-01days on market $127,000 Active 28 DOM
-
2026-05-31days on market $127,000 Active 27 DOM
-
2026-05-30days on market $127,000 Active 26 DOM
-
2026-05-08price $137,000 801-char remark
-
2026-05-04$147,000 Active 801-char remark
ⓘ Source: listings_history table (triggers on properties + properties_extension) + one-shot
backfill from property_details.listing_events for pre-trigger history.
Tax reassessment forecast IN · Partial reset (capped growth)
- Current annual tax
- $415 · $35/mo
- Projected year-2 tax
- $747 · $62/mo
- Expected delta
- +$332/yr (+$28/mo · 80.2%)
ⓘ Screening estimate from a state-policy table — verify with the county assessor before closing.
Climate risk First Street
- Flood 1/10 Low FEMA zone X (unshaded) · 0% chance over 30 yrs
- Wildfire 1/10 Low
- Heat 4/10 Moderate 7 d/yr ≥104°F today · 19 d/yr by 30 yrs out
- Wind 2/10 Low 100% chance of damaging wind over 30 yrs
- Air quality 2/10 Low 1 unhealthy d/yr today · 1 by 30 yrs out
Nearby sold comps map
Loading sold comps map…
Walkable amenities ~0.75 mi
Loading nearby amenities…
Taxation est. · year 1
- Rental income
- $10,504
- − Mortgage interest
- −$7,114
- − Property taxes
- −$415
- − Insurance
- −$635
- − Repairs & maintenance
- −$840
- − Management
- −$840
- − Depreciation
- −$3,695
- Taxable loss
- −$3,035
- Est. tax savings @ 24.0%
- +$728
- After-tax cash flow
- $-15/yr
For passive investors: Depreciation is non-cash, so a rental often shows a tax loss while cash-flowing — sheltering income. Rental losses are passive: they offset passive income freely, and up to $25,000/yr can offset ordinary (W-2) income if you actively participate and your MAGI is under $100k (phasing out to $0 by $150k); unused losses carry forward. On sale, claimed depreciation is recaptured at up to 25%, and gains may owe capital-gains tax (a 1031 exchange can defer both). Figures are a year-1 estimate at your 24.0% rate — not tax advice; consult a CPA.
Schools (NCES district)
- District
- Clay Community Schools
- NCES district ID
- 1800840
- Math proficiency
- 46% ▼ -6.00%
- Reading proficiency
- 49% ▼ -1.00%
- Median HH income
- $46,673
- Composite
- 40.39/100
- National rank
- #3733
- State rank
- #79 of 301 in IN
Livability — Brazil
- Score
- 66/100
- State rank
- #308
- US rank
- #12163
Category grades
Schools grade is shown separately in the Schools card above.
Census & demographics
- Census place
- Brazil, IN
- City population
- 18,773
- Population (ZIP)
- 18,773
Population outlook (Clay County) Hauer SSP2
- Today (2025)
- 25,820 people
- By 2030
- 25,182 · -2.5%
- By 2040
- 23,562 · -8.7%
- By 2050
- 21,829 · -15.5%
- By 2075
- 17,939 · -30.5%
- By 2100
- 14,042 · -45.6%
Race, ethnicity, and origin ACS 2023
- Neighborhood character
- Predominantly White (94%)
- Race & ethnicity
- White 94% Two or more races 4% Hispanic / Latino 2%
- Common ancestry
- Slovak 1% Iranian 1% Italian 1%
- Foreign-born
- 1% · Canada, Jamaica
- Languages at home
- 99% English-only · Spanish 1%
Political lean MEDSL · Clay
- 2024 margin
- Solid R (+56.9) · D 20.7% · R 77.6% · Other 1.7%
- 2008→2024 swing
- -45.4pp toward R · 2008: -11.5pp · 2024: -56.9pp
- All cycles
- 2024: R+56.9 2020: R+56.6 2016: R+55.3 2012: R+31.4 2008: R+11.5
Not yet ingested
- Civics
- —
Market trends
- HPI YoY
- ▼ -58.68%
- Current HPI
- 223.6707
- Rent YoY
- —
- Metro
- —
- State GDP YoY
- ▲ 2.90%
- F500 in state
- 18
Industry mix (Fortune 500 HQ in IN)
| Industry | F500 HQs | Revenue |
|---|---|---|
| Industrial Machinery | 2 | $37B |
|
||
| Healthcare | 1 | $177B |
|
||
| Pharmaceuticals | 1 | $45B |
|
||
| Metals / Steel | 1 | $18B |
|
||
| Agriculture | 1 | $17B |
|
||
| Packaging | 1 | $12B |
|
||
Price history
-13.6% since first listed4 events — show timeline
- 2026-06-08 Pending — THAAR
- 2026-05-21 Price Changed $127,000 THAAR
- 2026-05-08 Price Changed $137,000 THAAR
- 2026-05-04 Listed $147,000 THAAR
Property tax history
+2.5%/yrLatest (2024): $415 · +63.3% YoY. Source: county tax records.
Cash-flow waterfall
monthlySold comps — $/sqft
last 12 mo · ≤1 miLoading sold comps…