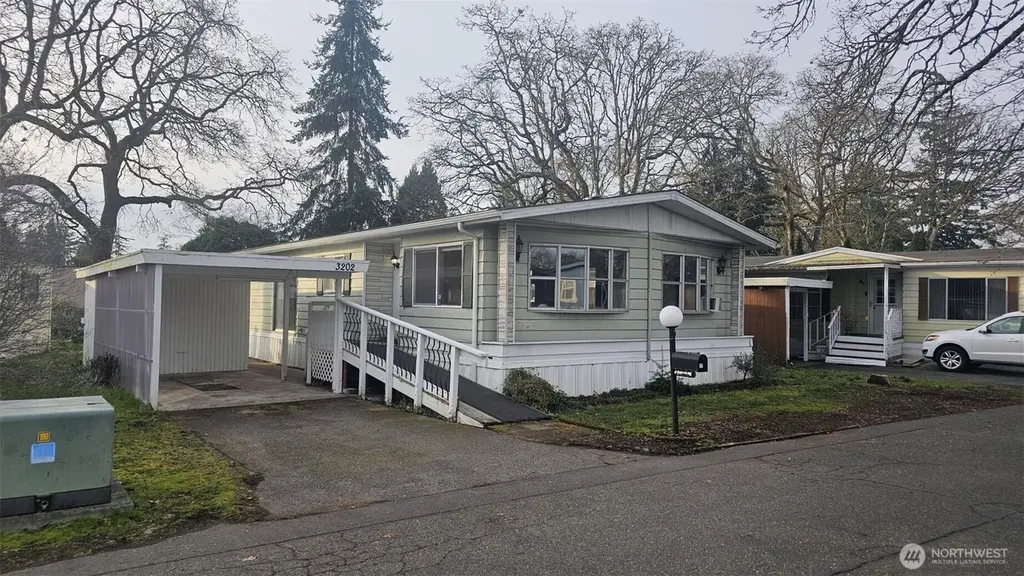
3202 85th St S #57 · Lakewood, WA
Flood risk 6/10 · Moderate
- FEMA flood zone
- X (unshaded)
- Chance of flooding over 30 yrs
- 0.74%
- Est. flood insurance / yr
- $507 – $1,088
Fire risk 1/10 · Minimal
- Est. fire insurance / yr
- $604 – $1,122
Heat risk 3/10 · Minor
- Hot days now (above 86°F)
- 7 days/yr
- Hot days in 30 yrs
- 14 days/yr
Wind risk 1/10 · Minimal
- Chance of severe wind over 30 yrs
- —
Air-quality risk 7/10 · Major
- Unhealthy air days now
- 11 days/yr
- Unhealthy air days in 30 yrs
- 12 days/yr
Risk factors via First Street. Map © Google.
Why this score? — see what drove the C- grade
The composite is a weighted blend of 9 inputs, each scored 0–100. Each bar is that input's sub-score; the figure is the points it added to the 100-point composite (weight × sub-score).
- Cash flow +15.0/30.0
- ARV discount +15.0/15.0
- 1% rule +5.0/10.0
- DSCR +5.0/10.0
- Schools +4.0/10.0
- Livability +3.7/5.0
- Rent growth +3.2/5.0
- Condition / age +2.5/5.0
- Appreciation +0.0/10.0
$44,950
🖨 Deal sheet 📄 Offer letter ✓ Due diligence
Listing remarks
Conveniently located near the freeway in a larger quiet park setting. This large doublewide features a separate living and dining room with 2 beds and 2 baths. The primary bathroom has a walk in jetted tub. Clean, Tidy and ready to move in or, Either some new carpeting or new flooring and it will feel like new.
Key facts
- Quiet park setting
- Walk in jetted tub
- Built 1979
Tags
Neighborhood map
What this means for you Summary
Snapshot
- This is a 3-bed/2.0-bath manufactured listed at $45k.
Deal economics
- At list price, monthly cash flow is $1k ($15k/yr) — positive.
- The deal already cash-flows at list — no discount required.
- Meets the 1% rule at list price ($2k rent vs $45k).
- Recommended offer: $41k (9.0% below list) — sets the bar for market timing.
- Cap rate 40.3% vs local median 2.6% in Lakewood — top-decile yield for the area; either an underpriced asset or a hidden risk that comps aren't pricing in. Stress-test before assuming the spread holds.
Location & tenants
- Location reads 74/100 on livability (#182 in WA, #4,754 nationally) — a middle-class / working-renter tenant base. Strengths: commute A+, health & safety A+, housing A-; Watch: schools C-, cost of living D, crime F.
- Clover Park School District (urban): math 39% / reading 51% proficiency, ranked #190 of 291 in WA (top 65%) — families likely to look elsewhere, expect single-tenant / working-renter base with shorter leases.
- Market conditions: Rents rising (+3.0%/yr); 129 active listings in the ZIP; 29 comparable units currently listed for rent nearby; rentals at typical pace (median 15d on market — plan ~3-4 weeks tenant-placement turnaround); 3,209 units permitted in Pierce County in 2024 (1,269 in 5+ unit buildings).
- This rent runs 36% of the median local income ($67k/yr) — at the standard rent-burdened threshold; future hikes will face affordability resistance.
Forward outlook
- Local home prices are declining (-3.0%/yr); year-one equity from $310 of loan paydown is wiped out by about $1k of value loss. Plan a longer hold.
- Pierce County population projected at +26% by 2050 — long-run rental-demand tailwind backs the buy-and-hold thesis.
- At projected returns (-3.0% appreciation + 3.0% rent growth), your $13k cash investment doubles in ~1 year — after that, you're playing with house money.
Negotiation context
- It's been on market 115 days — a 9% lower offer ($41k) is reasonable based on typical stale-listing flexibility.
- 2 sale attempts; this cycle's ask has dropped $33k (42%) from the opening price — seller is motivated, your offer sets the floor, not the list.
Risks & watch-outs
- Climate carrying-cost: major flood risk — expect insurance premiums to compound above CPI over the hold.
Questions for the listing agent
- It's been on market 115 days. Have you received any prior offers? Is the seller open to a 9% concession, seller financing, or rate buy-down credit?
- Built in 1979 — when were the roof, HVAC, electrical panel, plumbing, and water heater last replaced?
- Why hasn't it sold? Are there any deal-killer items the seller is aware of (foundation, flood, title, zoning, code violations)?
- Is there a deadline driving the sale (1031 exchange, divorce, estate, relocation)? That informs how much negotiation room exists.
- Crime grade is F in this area — have there been break-ins, vandalism, or insurance claims at this property in the last 3 years? What carrier currently insures it and at what premium?
- What's the average days-on-market for RENTAL listings here right now (not sales)? A rising rental-DOM trend means longer vacancies and softer asking-rent achievability than the comps imply.
- What's the recent tenant-quality profile in this submarket — average credit score on applications, eviction rate, late-payment / NSF rate, and stable-employment percentage? A property-management company in the area should have these aggregated.
- How much new for-sale + rental construction is in the pipeline within 1–3 miles? Heavy new supply typically softens prices + rents 12–24 months out; constrained supply supports both.
Investment metrics
- 1% rule
- 4.48% ✓
- Cap rate
- 40.26%
- Cash-on-cash
- 121.29%
- DSCR
- 6.40
- GRM
- 1.9
CMA / ARV
- ARV (median comp)
- $77,529
- List price
- $44,950
- Delta
- -35.51%
- Verdict
- UNDERPRICED
- Comps
- 8 within 1.0 mi
Show comp detail 8 sales within ~0.75 mi
| Address | Dist | Beds/Ba | Sqft | Sold | Price | $/sf | Match |
|---|---|---|---|---|---|---|---|
| 3229 85th St S | 0.07mi | 2/2.0 (-1) | 1,428 (+2%) | 10mo | $88,500 | $62 | 80 |
| 3110 86th Street Ct S | 0.12mi | 2/2.0 (-1) | 1,440 (+2%) | 6mo | $74,950 | $52 | 80 |
| 3209 85th St S #47 | 0.03mi | 2/2.0 (-1) | 1,339 (-5%) | 10mo | $110,000 | $82 | 78 |
| 8620 32ND Avenue Ct SW #111 | 0.14mi | 2/2.0 (-1) | 1,360 (-3%) | 7mo | $42,000 | $31 | 77 |
| 3111 82nd Street Ct S #11 | 0.20mi | 4/2.0 (+1) | 1,456 (+4%) | 4mo | $159,995 | $110 | 76 |
| 3206 85th St S #56 | 0.01mi | 2/2.0 (-1) | 1,243 (-12%) | 11mo | $69,000 | $56 | 66 |
| 3250 S 77th St | 0.48mi | 2/2.0 (-1) | 1,336 (-5%) | 2mo | $80,000 | $60 | 62 |
| 3011 80th St Ct S #50 | 0.27mi | 4/2.0 (+1) | 1,568 (+12%) | 15mo | $143 | — | 51 |
Match score weights: distance 35% · size 25% · config 20% · recency 20%. Top-matched comps best support the ARV.
Projected returns pro-forma
-3.0% appreciation · 3.0% rent growth · sell at horizon
- IRR
- —
- Equity multiple
- 6.86×
- Total profit
- $73,777
- Equity at exit
- $6,702
- IRR
- —
- Equity multiple
- 14.41×
- Total profit
- $168,720
- Equity at exit
- $3,886
Cash invested: $12,586 (down + closing). Projections, not guarantees.
Landlord ↔ Tenant lean methodology
- Overall (STATE)
- 28 Tenant-Leaning
- State Washington
- 28 Tenant-Leaning · D+8
- County
- — inherits STATE
- City
- — inherits STATE
ZIP-level market 98499
- Rents YoY
- 3.0%
- Active inventory
- 129
- Price-to-rent
- 1.9×
Monthly cashflow live
- Estimated rent
- $2,014 high interval (Pro) →
- Mortgage (P&I)
- −$236
- Tax from tax record
- −$64 /mo · $771/yr
- Insurance
- −$19
- HOA
- −$0
- Vacancy / Maint / Mgmt
- −$423
- Net cashflow
- $1,272
Break-even live
UW: 25.0% down · 7.5% · 30yr · 1.5% tax · 5.0% vac · 8.0% maint · 8.0% mgmt
Financing live
Cash to close
- Down payment
- $11,238
- Closing costs
- $1,348
- Reserves months
- —
- Total cash needed
- —
Loan-product check · same deal, 3 products live
Conventional
25% down · 7.5% · 30yr
- Down + closing
- —
- Monthly P&I
- —
- Monthly cashflow
- —
- DSCR
- —
- Eligible?
- —
Personal DTI + credit; lowest rate.
DSCR
20% down · 8.5% · 30yr
- Down + closing
- —
- Monthly P&I
- —
- Monthly cashflow
- —
- DSCR
- —
- Eligible?
- —
No personal income docs; deal must DSCR.
Hard money
10% down · 12.0% · 12mo
- Down + closing
- —
- Monthly P&I
- —
- Monthly cashflow
- —
- DSCR
- —
- Eligible?
- —
Short-term bridge; refi at stabilization.
Rent comps 29 comps
| Address | Beds | Baths | Sqft | Rent | $/sqft | DOM | Units | Dist |
|---|---|---|---|---|---|---|---|---|
| 2611 84th Street Ct S Tacoma, WA | 1.0–2.0 | 1.0 | 850 | $1,895 | $2.23 | 21d | 6 | 0.18mi |
| 2604 92nd St S Unit B Lakewood, WA | 3.0 | 2.0 | 1120 | $1,995 | $1.78 | 43d | 1 | 0.53mi |
| 2604 92nd St S Unit B Lakewood, WA | 3.0 | 2.0 | 1120 | $1,995 | $1.78 | 24d | 1 | 0.53mi |
| 2425 S 96th St Tacoma, WA | 1.0–2.0 | 1.0 | 850 | $1,225 | $1.44 | 1d | 15 | 0.72mi |
| 9210 S Hosmer St Tacoma, WA | 1.0–2.0 | 1.0–2.0 | 787 | $1,685 | $2.14 | 1d | 12 | 0.74mi |
| 9009 S Hosmer St Tacoma, WA | 2.0 | 1.5 | 1177 | $1,650 | $1.40 | 7d | 5 | 0.75mi |
| 7245 S Prospect St Tacoma, WA | 3.0 | 1.5 | 1488 | $3,150 | $2.12 | 24d | 1 | 0.79mi |
| 9318 S Steele St Unit DD520 Tacoma, WA | 2.0 | 2.0 | 1000 | $1,695 | $1.70 | 43d | 1 | 0.79mi |
| 9318 S Steele St Unit D61 Tacoma, WA | 2.0 | 2.0 | 1000 | $1,695 | $1.70 | 14d | 1 | 0.79mi |
| 9318 S Steele St Unit Q367 Tacoma, WA | 2.0 | 1.0 | 960 | $1,650 | $1.72 | 43d | 1 | 0.79mi |
| 1819 S 93rd St Unit A Tacoma, WA | 2.0 | 1.0 | 912 | $1,575 | $1.73 | 10d | 1 | 0.85mi |
| 1819 S 93rd St Tacoma, WA | 2.0 | 1.0 | 912 | $1,588 | $1.74 | 17d | 2 | 0.85mi |
| 1721 S 82nd St Unit 1807-02 Tacoma, WA | 2.0 | 1.0 | 897 | $1,500 | $1.67 | 2d | 1 | 0.87mi |
| 9314 S Ash St Tacoma, WA | 1.0–2.0 | 1.0 | 800 | $1,683 | $2.10 | 1d | 21 | 0.88mi |
| 2205 S 74th St Tacoma, WA | 2.0 | 1.0 | 880 | $1,720 | $1.95 | 2d | 1 | 0.89mi |
| 1721 S 82nd St Tacoma, WA | 1.0–2.0 | 1.0 | 753 | $1,500 | $1.99 | 4d | 4 | 0.90mi |
| 1721 S 82nd St Tacoma, WA | 1.0–2.0 | 1.0 | 753 | $1,400 | $1.86 | 23d | 3 | 0.90mi |
| 7025 S Puget Sound Ave Tacoma, WA | 3.0 | 1.5 | 1200 | $2,600 | $2.17 | 24d | 1 | 0.93mi |
| 2415 100th Street Ct S Tacoma, WA | 2.0–3.0 | 1.0–2.0 | 912 | $2,050 | $2.25 | 4d | 2 | 0.99mi |
| 10102 Sales Rd S Lakewood, WA | 2.0 | 1.0–1.5 | 596 | $1,550 | $2.60 | 43d | 26 | 1.04mi |
| 6815 S Warner St Tacoma, WA | 3.0 | 1.0 | 1034 | $2,400 | $2.32 | 2d | 1 | 1.05mi |
| 6841 S Wapato St Tacoma, WA | 3.0 | 2.0 | 1190 | $2,550 | $2.14 | 19d | 1 | 1.06mi |
| 6830 Tacoma Mall Blvd Tacoma, WA | 2.0 | 1.0 | 980 | $1,560 | $1.59 | 7d | 1 | 1.20mi |
| 9616 16th Avenue Ct S Unit 9614 Tacoma, WA | 3.0 | 2.5 | 1534 | $2,297 | $1.50 | 24d | 1 | 1.22mi |
| 2201 104th St S Tacoma, WA | 1.0–3.0 | 1.0–2.0 | 929 | $2,500 | $2.69 | 1d | 16 | 1.28mi |
| 5101 88th Street Ct SW Lakewood, WA | 3.0 | 1.0–2.0 | 832 | $2,600 | $3.12 | 2d | 16 | 1.34mi |
| 6601 S Tyler St Unit 13 Tacoma, WA | 2.0 | 1.0 | 880 | $1,300 | $1.48 | 23d | 1 | 1.39mi |
| 4031 S 66th St Tacoma, WA | 3.0 | 2.0 | 1550 | $3,000 | $1.94 | 24d | 1 | 1.41mi |
| 1809 105th Street Ct S Tacoma, WA | 2.0–3.0 | 1.0–2.0 | 1050 | $2,509 | $2.39 | 1d | 7 | 1.41mi |
Listing history 21 events
-
2026-06-18days on market $44,950 Active 115 DOM
-
2026-06-18price $44,950 Active 114 DOM
-
2026-06-17days on market $49,995 Active 114 DOM
-
2026-06-16days on market $49,995 Active 113 DOM
-
2026-06-15days on market $49,995 Active 112 DOM
-
2026-06-13days on market $49,995 Active 110 DOM
-
2026-06-09days on market $49,995 Active 106 DOM
-
2026-06-08days on market $49,995 Active 105 DOM
-
2026-06-07days on market $49,995 Active 104 DOM
-
2026-06-04days on market $49,995 Active 101 DOM
-
2026-06-03days on market $49,995 Active 100 DOM
-
2026-06-02days on market $49,995 Active 99 DOM
-
2026-06-01days on market $49,995 Active 98 DOM
-
2026-05-31days on market $49,995 Active 97 DOM
-
2026-05-20price $49,995
-
2026-04-22status Active
-
2026-03-29status Pending
-
2026-03-21price $59,995
-
2026-03-01price $67,450
-
2026-02-15price $69,950
-
2026-01-30$77,500 Active
ⓘ Source: listings_history table (triggers on properties + properties_extension) + one-shot
backfill from property_details.listing_events for pre-trigger history.
Tax reassessment forecast WA · Resets to sale price
- Current annual tax
- $771 · $64/mo
- Projected year-2 tax
- $771 · $64/mo
- Expected delta
- $0/yr ($0/mo · 0.0%)
ⓘ Screening estimate from a state-policy table — verify with the county assessor before closing.
Climate risk First Street
- Flood 6/10 Major FEMA zone X (unshaded) · 74% chance over 30 yrs
- Wildfire 1/10 Low
- Heat 3/10 Moderate 7 d/yr ≥86°F today · 14 d/yr by 30 yrs out
- Wind 1/10 Low
- Air quality 7/10 Severe 11 unhealthy d/yr today · 12 by 30 yrs out
Nearby sold comps map
Loading sold comps map…
Walkable amenities ~0.75 mi
Loading nearby amenities…
Taxation est. · year 1
- Rental income
- $24,165
- − Mortgage interest
- −$2,518
- − Property taxes
- −$771
- − Insurance
- −$225
- − Repairs & maintenance
- −$1,933
- − Management
- −$1,933
- − Depreciation
- −$1,308
- Taxable income
- $15,477
- Est. tax owed @ 24.0%
- −$3,715
- After-tax cash flow
- $11,551/yr
For passive investors: Depreciation is non-cash, so a rental often shows a tax loss while cash-flowing — sheltering income. Rental losses are passive: they offset passive income freely, and up to $25,000/yr can offset ordinary (W-2) income if you actively participate and your MAGI is under $100k (phasing out to $0 by $150k); unused losses carry forward. On sale, claimed depreciation is recaptured at up to 25%, and gains may owe capital-gains tax (a 1031 exchange can defer both). Figures are a year-1 estimate at your 24.0% rate — not tax advice; consult a CPA.
Schools (NCES district)
- District
- Clover Park School District
- NCES district ID
- 5301410
- Math proficiency
- 39% ▼ -2.00%
- Reading proficiency
- 51% ▲ 2.00%
- Median HH income
- $42,344
- Composite
- 40.11/100
- National rank
- #7858
- State rank
- #190 of 291 in WA
Livability — Lakewood
- Score
- 74/100
- State rank
- #182
- US rank
- #4754
Category grades
Schools grade is shown separately in the Schools card above.
Census & demographics
- Census place
- Lakewood, WA
- County
- Pierce County · 788,257 people
- City population
- 61,673
- Metro
- Seattle-Tacoma-Bellevue, WA
- Population (ZIP)
- 32,464
- Household income
- $67,292
- Rent vs Own
- Severe rent burden
- 2313.0
Population outlook (Pierce County) Hauer SSP2
- Today (2025)
- 956,648 people
- By 2030
- 1,010,862 · +5.7%
- By 2040
- 1,113,170 · +16.4%
- By 2050
- 1,206,524 · +26.1%
- By 2075
- 1,436,425 · +50.2%
- By 2100
- 1,563,654 · +63.5%
Race, ethnicity, and origin ACS 2023
- Neighborhood character
- Highly diverse neighborhood (Simpson 0.76)
- Race & ethnicity
- White 39% Hispanic / Latino 25% Two or more races 17% Black 15% Asian 8% Pacific Islander 6%
- Hispanic origin (detail)
- Mexican 17% Puerto Rican 2% Cuban 1%
- Common ancestry
- Portuguese 3% Slovak 2% Lithuanian 2%
- Foreign-born
- 18% · Canada, South Korea, Vietnam
- Languages at home
- 74% English-only · Spanish 16% Korean 3% Tagalog/Filipino 2%
Political lean MEDSL · Pierce
- 2024 margin
- D (+10.8) · D 53.9% · R 43.1% · Other 3.0%
- 2008→2024 swing
- -1.4pp toward R · 2008: 12.2pp · 2024: 10.8pp
- All cycles
- 2024: D+10.8 2020: D+11.2 2016: D+7.5 2012: D+11.0 2008: D+12.2
Not yet ingested
- Civics
- —
Market trends
- HPI YoY
- ▼ -536.54%
- Current HPI
- 288.2797
- Rent YoY
- ▲ 3.00%
- Metro
- Seattle-Tacoma-Bellevue, WA
- State GDP YoY
- ▲ 4.65%
- F500 in state
- 22
Industry mix (Fortune 500 HQ in WA)
| Industry | F500 HQs | Revenue |
|---|---|---|
| Retail | 2 | $269B |
|
||
| Technology / Retail | 1 | $638B |
|
||
| Technology | 1 | $245B |
|
||
| Telecommunications | 1 | $38B |
|
||
| Food / Beverage | 1 | $36B |
|
||
| Automotive / Trucks | 1 | $34B |
|
||
Price history
-35.5% since first listed7 events — show timeline
- 2026-05-20 Price Changed $49,995 NWMLS as Distributed by MLS Grid
- 2026-04-22 Relisted — NWMLS as Distributed by MLS Grid
- 2026-03-29 Pending — NWMLS as Distributed by MLS Grid
- 2026-03-21 Price Changed $59,995 NWMLS as Distributed by MLS Grid
- 2026-03-01 Price Changed $67,450 NWMLS as Distributed by MLS Grid
- 2026-02-15 Price Changed $69,950 NWMLS as Distributed by MLS Grid
- 2026-01-30 Listed $77,500 NWMLS as Distributed by MLS Grid
Property tax history
+6.2%/yrLatest (2026): $771 · -0.7% YoY. Source: county tax records.
Cash-flow waterfall
monthlySold comps — $/sqft
last 12 mo · ≤1 miLoading sold comps…