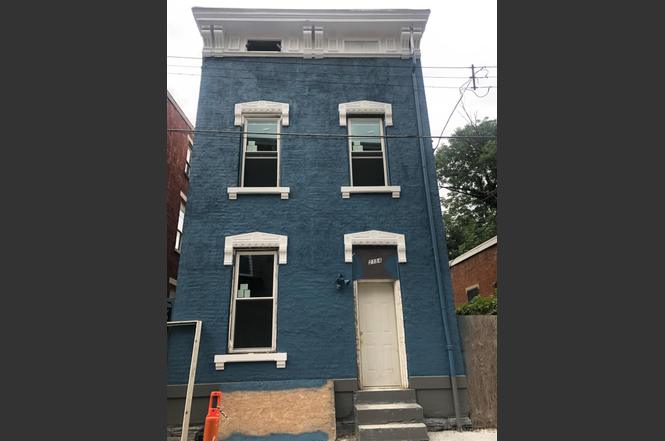
2154 Staebler St · Cincinnati, OH
Flood risk 7/10 · Major
- FEMA flood zone
- X (unshaded)
- Chance of flooding over 30 yrs
- 0.99%
- Est. flood insurance / yr
- $473 – $860
Fire risk 1/10 · Minimal
- Est. fire insurance / yr
- $713 – $1,323
Heat risk 5/10 · Moderate
- Hot days now (above 103°F)
- 7 days/yr
- Hot days in 30 yrs
- 20 days/yr
Wind risk 2/10 · Minimal
- Chance of severe wind over 30 yrs
- 1.0%
Air-quality risk 3/10 · Minor
- Unhealthy air days now
- 3 days/yr
- Unhealthy air days in 30 yrs
- 5 days/yr
Risk factors via First Street. Map © Google.
Why this score? — see what drove the B- grade
The composite is a weighted blend of 9 inputs, each scored 0–100. Each bar is that input's sub-score; the figure is the points it added to the 100-point composite (weight × sub-score).
- Cash flow +30.0/30.0
- 1% rule +10.0/10.0
- DSCR +10.0/10.0
- ARV discount +7.5/15.0
- Livability +4.0/5.0
- Rent growth +2.5/5.0
- Schools +2.5/10.0
- Condition / age +2.5/5.0
- Appreciation +0.0/10.0
$89,000
🖨 Deal sheet 📄 Offer letter ✓ Due diligence
Listing remarks MLS
Solid home with lots of potential in up and coming Price Hill area. Bring your tools and imagination, and bring this one back to it's former glory! Has potential to convert into a two-family. Property Sold As-Is/Where-Is. Make an offer today!
Key facts
- 4,530 sq ft lot
- Built 1895
- Listed 2 days
Property features AI
Finance
- Other: Zoned residential
- HOA & community: No HOA
Exterior
- Utilities: Public water; Public sewer; Natural gas
- Home design: Italianate style single-family home; Stone foundation
- Construction: Brick construction; Shingle/composition roof
- Exterior features: Vinyl windows
Interior
- Bedrooms: Four bedrooms; Primary bedroom about 16 x 18 (on level 2); Second bedroom about 16 x 18 (on level 2); Third bedroom about 16 x 14 (on level 3); Fourth bedroom about 16 x 14 (on level 3)
- Bathrooms: Two full bathrooms (one on level 2, one on level 3)
- Heating & cooling: Forced air heating
- Interior features: Eight total rooms; Full basement
Neighborhood map
What this means for you Summary
Snapshot
- This is a 3-bed/2.0-bath single-family listed at $89k.
Deal economics
- At list price, monthly cash flow is $689 ($8k/yr) — positive.
- The deal already cash-flows at list — no discount required.
- Meets the 1% rule at list price ($2k rent vs $89k).
- Cap rate 16.3% vs local median 3.9% in Cincinnati — top-decile yield for the area; either an underpriced asset or a hidden risk that comps aren't pricing in. Stress-test before assuming the spread holds.
Location & tenants
- Location reads 80/100 on livability (#130 in OH, #1,856 nationally) — a professional / high-income tenant draw. Strengths: amenities A+, commute A+, cost of living A+; Watch: employment D, crime F.
- Cincinnati Public Schools (urban): math 25% / reading 36% proficiency, ranked #581 of 656 in OH (top 89%) — families likely to look elsewhere, expect single-tenant / working-renter base with shorter leases; 70% free/reduced lunch — lower-income household profile, screen leases tightly.
- Market conditions: 33 active listings in the ZIP; 9 comparable units currently listed for rent nearby; rentals at typical pace (median 17d on market — plan ~3-4 weeks tenant-placement turnaround); lower-income renter base — watch delinquency; 801 units permitted in Hamilton County in 2024 (190 in 5+ unit buildings).
- At $1,671/mo this rent would consume 64% of the median local household income ($31k/yr) (locally 487% of renters already pay >50% of income on rent) — very limited rent-growth headroom before tenants either downsize or default.
Forward outlook
- Local home prices are declining (-3.0%/yr); year-one equity from $615 of loan paydown is wiped out by about $3k of value loss. Plan a longer hold.
- At projected returns (-3.0% appreciation + 3.0% rent growth), your $25k cash investment doubles in ~4 years — after that, you're playing with house money.
Negotiation context
- Only 2 days on market — expect competitive offers; lowballing is unlikely to land.
- 3 sale attempts since 8y ago with the ask held roughly flat each time — persistent listings suggest the price (not the market) is what's stuck; bring a comps-based counter.
- Current owner paid $16k; list at $89k implies a 456% gain — meaningful room to come down on a strong offer.
Risks & watch-outs
- Watch-outs: flood insurance adds $56/mo; built in 1895 — expect roof / HVAC / electrical / plumbing capex.
- Climate carrying-cost: major flood risk; extreme-heat days projected 7→20/yr by 2055 (HVAC capex compounding) — expect insurance premiums to compound above CPI over the hold.
Questions for the listing agent
- Built in 1895 — when were the roof, HVAC, electrical panel, plumbing, and water heater last replaced?
- What's the actual annual flood-insurance premium (NFIP or private), and is the property in a SFHA with mandatory coverage?
- Is there a deadline driving the sale (1031 exchange, divorce, estate, relocation)? That informs how much negotiation room exists.
- Schools are B-rated — typically a magnet for longer-tenancy family renters. What's the average tenant stay here, and is there a school-zone premium baked into asking?
- Crime grade is F in this area — have there been break-ins, vandalism, or insurance claims at this property in the last 3 years? What carrier currently insures it and at what premium?
- What's the average days-on-market for RENTAL listings here right now (not sales)? A rising rental-DOM trend means longer vacancies and softer asking-rent achievability than the comps imply.
- What's the recent tenant-quality profile in this submarket — average credit score on applications, eviction rate, late-payment / NSF rate, and stable-employment percentage? A property-management company in the area should have these aggregated.
- How much new for-sale + rental construction is in the pipeline within 1–3 miles? Heavy new supply typically softens prices + rents 12–24 months out; constrained supply supports both.
Investment metrics
- 1% rule
- 1.88% ✓
- Cap rate
- 16.34%
- Cash-on-cash
- 35.88%
- DSCR
- 2.60
- GRM
- 4.4
CMA / ARV
- ARV (on-the-fly)
- $246,169
- Comps found
- 12
Show comp detail 12 sales within ~0.75 mi
| Address | Dist | Beds/Ba | Sqft | Sold | Price | $/sf | Match |
|---|---|---|---|---|---|---|---|
| 2491 Warsaw Ave | 0.32mi | 3/3.0 | 1,854 (+5%) | 10mo | $258,000 | $139 | 65 |
| 26 Butler St | 0.64mi | 3/2.5 | 1,858 (+5%) | 6mo | $338,000 | $182 | 55 |
| 18 Butler St | 0.61mi | 2/2.5 (-1) | 1,800 (+2%) | 9mo | $303,000 | $168 | 54 |
| 700 Hawthorne Ave | 0.51mi | 3/1.0 | 1,673 (-6%) | 11mo | $150,000 | $90 | 54 |
| 578 Considine Ave | 0.57mi | 4/1.0 (+1) | 1,728 (-2%) | 10mo | $150,000 | $87 | 52 |
| 2832 Claypole Ave | 0.74mi | 3/2.5 | 1,668 (-6%) | 2mo | $229,900 | $138 | 52 |
| 432 Hawthorne Ave | 0.65mi | 3/2.0 | 1,592 (-10%) | 4mo | $220,000 | $138 | 49 |
| 551 Wilsonia Dr | 0.44mi | 3/2.0 | 1,519 (-14%) | 10mo | $258,000 | $170 | 47 |
| 440 Victoria St | 0.71mi | 4/2.0 (+1) | 1,840 (+4%) | 13mo | $359,900 | $196 | 45 |
| 741 Considine Ave | 0.60mi | 3/1.5 | 1,939 (+10%) | 12mo | $260,000 | $134 | 44 |
| 420 Grand Ave | 0.61mi | 3/2.0 | 1,557 (-12%) | 11mo | $587,000 | $377 | 42 |
| 1026 Considine Ave | 0.72mi | 2/1.5 (-1) | 1,642 (-7%) | 9mo | $140,000 | $85 | 40 |
Match score weights: distance 35% · size 25% · config 20% · recency 20%. Top-matched comps best support the ARV.
Projected returns pro-forma
-3.0% appreciation · 3.0% rent growth · sell at horizon
- IRR
- 28.4%
- Equity multiple
- 2.18×
- Total profit
- $29,527
- Equity at exit
- $13,270
- IRR
- 35.9%
- Equity multiple
- 4.31×
- Total profit
- $82,400
- Equity at exit
- $7,695
Cash invested: $24,920 (down + closing). Projections, not guarantees.
Landlord ↔ Tenant lean methodology
- Overall (STATE)
- 73 Landlord-Friendly
- State Ohio
- 73 Landlord-Friendly · R+6
- County
- — inherits STATE
- City
- — inherits STATE
ZIP-level market 45204
- Home prices YoY
- -21.2%
- Active inventory
- 33
- Price-to-rent
- 4.4×
Monthly cashflow live
- Estimated rent
- $1,671 high interval (Pro) →
- Mortgage (P&I)
- −$467
- Tax from tax record
- −$71 /mo · $855/yr
- Insurance
- −$37
- Flood insurance flood zone
- −$56 /mo · $666/yr
- HOA
- −$0
- Vacancy / Maint / Mgmt
- −$351
- Net cashflow
- $689
Break-even live
UW: 25.0% down · 7.5% · 30yr · 1.5% tax · 5.0% vac · 8.0% maint · 8.0% mgmt
Financing live
Cash to close
- Down payment
- $22,250
- Closing costs
- $2,670
- Reserves months
- —
- Total cash needed
- —
Loan-product check · same deal, 3 products live
Conventional
25% down · 7.5% · 30yr
- Down + closing
- —
- Monthly P&I
- —
- Monthly cashflow
- —
- DSCR
- —
- Eligible?
- —
Personal DTI + credit; lowest rate.
DSCR
20% down · 8.5% · 30yr
- Down + closing
- —
- Monthly P&I
- —
- Monthly cashflow
- —
- DSCR
- —
- Eligible?
- —
No personal income docs; deal must DSCR.
Hard money
10% down · 12.0% · 12mo
- Down + closing
- —
- Monthly P&I
- —
- Monthly cashflow
- —
- DSCR
- —
- Eligible?
- —
Short-term bridge; refi at stabilization.
Rent comps 9 comps
| Address | Beds | Baths | Sqft | Rent | $/sqft | DOM | Units | Dist |
|---|---|---|---|---|---|---|---|---|
| 2454 River Rd Unit 2 Cincinnati, OH | 4.0 | 1.0 | 1400 | $1,595 | $1.14 | 23d | 1 | 0.44mi |
| 927 Chateau Ave Cincinnati, OH | 3.0 | 1.0 | 1354 | $1,550 | $1.14 | 21d | 1 | 0.47mi |
| 1014 Considine Ave Cincinnati, OH | 4.0 | 2.0 | 2200 | $2,000 | $0.91 | 1d | 1 | 0.69mi |
| 916 Fairbanks Ave Cincinnati, OH | 4.0 | 1.0 | 1438 | $1,695 | $1.18 | 23d | 1 | 0.87mi |
| 931 Olive Ave Cincinnati, OH | 3.0 | 1.0 | 1852 | $1,500 | $0.81 | 2d | 1 | 1.16mi |
| 3666 Glenway Ave Cincinnati, OH | 3.0 | 1.0 | 1339 | $1,250 | $0.93 | 23d | 1 | 1.31mi |
| 22 Swain Ct Covington, KY | 1.0–3.0 | 1.0–2.0 | 951 | $2,295 | $2.41 | 1d | 3 | 1.41mi |
| 862 Academy Ave Unit 2 Cincinnati, OH | 4.0 | 1.0 | 1627 | $1,450 | $0.89 | 16d | 1 | 1.43mi |
| 1925 Colerain Ave Unit 1056034P Cincinnati, OH | 2.0 | 1.0 | 1453 | $2,790 | $1.92 | 12d | 1 | 1.46mi |
Listing history 2 events
-
2026-06-18days on market $89,000 Active 2 DOM
-
2026-06-16$89,000 Active 1 DOM
ⓘ Source: listings_history table (triggers on properties + properties_extension) + one-shot
backfill from property_details.listing_events for pre-trigger history.
Tax reassessment forecast OH · Partial reset (capped growth)
- Current annual tax
- $855 · $71/mo
- Projected year-2 tax
- $1,122 · $93/mo
- Expected delta
- +$267/yr (+$22/mo · 31.2%)
ⓘ Screening estimate from a state-policy table — verify with the county assessor before closing.
Climate risk First Street
- Flood 7/10 Severe FEMA zone X (unshaded) · 99% chance over 30 yrs
- Wildfire 1/10 Low
- Heat 5/10 Major 7 d/yr ≥103°F today · 20 d/yr by 30 yrs out
- Wind 2/10 Low 100% chance of damaging wind over 30 yrs
- Air quality 3/10 Moderate 3 unhealthy d/yr today · 5 by 30 yrs out
Nearby sold comps map
Loading sold comps map…
Walkable amenities ~0.75 mi
Loading nearby amenities…
Taxation est. · year 1
- Rental income
- $20,052
- − Mortgage interest
- −$4,985
- − Property taxes
- −$855
- − Insurance
- −$1,112
- − Repairs & maintenance
- −$1,604
- − Management
- −$1,604
- − Depreciation
- −$2,589
- Taxable income
- $7,303
- Est. tax owed @ 24.0%
- −$1,753
- After-tax cash flow
- $6,521/yr
For passive investors: Depreciation is non-cash, so a rental often shows a tax loss while cash-flowing — sheltering income. Rental losses are passive: they offset passive income freely, and up to $25,000/yr can offset ordinary (W-2) income if you actively participate and your MAGI is under $100k (phasing out to $0 by $150k); unused losses carry forward. On sale, claimed depreciation is recaptured at up to 25%, and gains may owe capital-gains tax (a 1031 exchange can defer both). Figures are a year-1 estimate at your 24.0% rate — not tax advice; consult a CPA.
Schools (NCES district)
- District
- Cincinnati Public Schools
- NCES district ID
- 3904375
- Math proficiency
- 25% ▼ -19.00%
- Reading proficiency
- 36% ▼ -14.00%
- Median HH income
- $35,743
- Composite
- 25.21/100
- National rank
- #7508
- State rank
- #581 of 656 in OH
Livability — Cincinnati
- Score
- 80/100
- State rank
- #130
- US rank
- #1856
Category grades
Schools grade is shown separately in the Schools card above.
Census & demographics
- Census place
- Cincinnati, OH
- County
- Hamilton County · 701,295 people
- City population
- 505,555
- Metro
- Cincinnati, OH-KY-IN
- Population (ZIP)
- 8,412
- Household income
- $31,236
- Rent vs Own
- Severe rent burden
- 487.0
Population outlook (Hamilton County) Hauer SSP2
- Today (2025)
- 826,054 people
- By 2030
- 830,947 · +0.6%
- By 2040
- 832,319 · +0.8%
- By 2050
- 822,428 · -0.4%
- By 2075
- 788,688 · -4.5%
- By 2100
- 710,674 · -14.0%
Race, ethnicity, and origin ACS 2023
- Neighborhood character
- Diverse neighborhood (Simpson 0.64)
- Race & ethnicity
- White 44% Black 41% Two or more races 13% Hispanic / Latino 2%
- Common ancestry
- Slovak 1% Lithuanian 1% Italian 1%
- Foreign-born
- 3% · Canada
- Languages at home
- 94% English-only · Spanish 3% Other Indo-European 2% Other Asian/Pacific 1%
Political lean MEDSL · Hamilton
- 2024 margin
- D (+14.9) · D 57.0% · R 42.1%
- 2008→2024 swing
- +7.9pp toward D · 2008: 7.0pp · 2024: 14.9pp
- All cycles
- 2024: D+14.9 2020: D+15.9 2016: D+9.5 2012: D+4.9 2008: D+7.0
Not yet ingested
- Civics
- —
Market trends
- HPI YoY
- ▼ -43.12%
- Current HPI
- 160.5953
- Rent YoY
- —
- Metro
- Cincinnati, OH-KY-IN
- State GDP YoY
- ▲ 1.98%
- F500 in state
- 48
Industry mix (Fortune 500 HQ in OH)
| Industry | F500 HQs | Revenue |
|---|---|---|
| Insurance | 3 | $145B |
|
||
| Industrial Machinery | 3 | $49B |
|
||
| Financial Services | 3 | $24B |
|
||
| Consumer Goods | 2 | $93B |
|
||
| Aerospace / Defense | 2 | $47B |
|
||
| Utilities | 2 | $33B |
|
||
Price history
+178.1% since first listed12 events — show timeline
- 2026-06-16 Listed $89,000 Cincy MLS
- 2023-01-09 Price Changed $99,999 Cincy MLS
- 2023-01-09 Listing Removed — Cincy MLS
- 2022-12-05 Price Changed $75,999 Cincy MLS
- 2022-10-17 Price Changed $79,999 Cincy MLS
- 2022-09-27 Price Changed $89,999 Cincy MLS
- 2022-09-01 Listed $99,999 Cincy MLS
- 2018-12-21 Sold (MLS) $16,000 Cincy MLS
- 2018-12-19 Contingent — Cincy MLS
- 2018-11-16 Price Changed $21,000 Cincy MLS
- 2018-11-05 Price Changed $30,000 Cincy MLS
- 2018-10-17 Listed $32,000 Cincy MLS
Property tax history
+17.4%/yrLatest (2025): $855 · +0.1% YoY. Source: county tax records.
Cash-flow waterfall
monthlySold comps — $/sqft
last 12 mo · ≤1 miLoading sold comps…