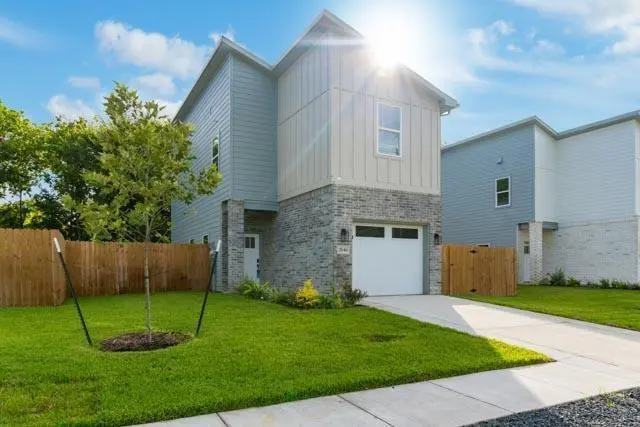
2646 Sutton St · Dallas, TX
Flood risk 1/10 · Minimal
- FEMA flood zone
- X (unshaded)
- Chance of flooding over 30 yrs
- 0.0%
- Est. flood insurance / yr
- $507 – $1,088
Fire risk 3/10 · Minor
- Est. fire insurance / yr
- $1,222 – $2,270
Heat risk 7/10 · Major
- Hot days now (above 110°F)
- 7 days/yr
- Hot days in 30 yrs
- 24 days/yr
Wind risk 6/10 · Moderate
- Chance of severe wind over 30 yrs
- 27.0%
Air-quality risk 2/10 · Minimal
- Unhealthy air days now
- 2 days/yr
- Unhealthy air days in 30 yrs
- 2 days/yr
Risk factors via First Street. Map © Google.
Why this score? — see what drove the D- grade
The composite is a weighted blend of 9 inputs, each scored 0–100. Each bar is that input's sub-score; the figure is the points it added to the 100-point composite (weight × sub-score).
- Cash flow +7.7/30.0
- ARV discount +7.5/15.0
- Appreciation +5.5/10.0
- Livability +4.0/5.0
- 1% rule +2.9/10.0
- Schools +2.8/10.0
- Rent growth +2.5/5.0
- Condition / age +2.5/5.0
- DSCR +1.8/10.0
$249,900
🖨 Deal sheet 📄 Offer letter ✓ Due diligence
Listing remarks MLS
Welcome to this beautifully built 3-bedroom, 2.5-bath home located in the historic Mill City neighborhood. Nestled in vibrant South Dallas, this property offers unmatched proximity, long-term equity, and tremendous opportunity. This home also features a wrap around backyard; ideal for families with pets who may desire to fence off a pet section. Just minutes from Fair Park—future site of the 2026 World Cup—and with quick access to I-45, I-75 and I-30, getting around the city is a breeze. While most comparable 3 and 4 bedroom homes in the area are priced above $300K, this home offers potential instant equity, making it an ideal choice for buyers who've found homeownership just out of reach. Don’t miss this chance to own a brand-new home in a growing community! See additional documents for preferred lender information, DHAP program details, and other grant opportunities. Incentives include
Key facts
- Quick access to i-45
- Wrap around backyard
- Quick access to i-75
Tags
Neighborhood map
What this means for you Summary
Snapshot
- This is a 3-bed/2.0-bath single-family listed at $250k.
Deal economics
- At list price, monthly cash flow is $-288 ($-3k/yr) — negative.
- To cash-flow at today's rent, offer at most $199k (20.3% below list).
- To meet the 1% rule (rent ≥ 1% of price), the offer needs to be $196k (21.5% below list).
- Recommended offer: $196k (21.5% below list) — sets the bar for 1% rule.
- Cap rate 4.9% vs local median 2.3% in Dallas — top-decile yield for the area; either an underpriced asset or a hidden risk that comps aren't pricing in. Stress-test before assuming the spread holds.
Location & tenants
- Location reads 81/100 on livability (#24 in TX, #1,380 nationally) — a professional / high-income tenant draw. Strengths: amenities A+, commute A+, housing A+; Watch: schools C-, crime F.
- Dallas ISD (urban): math 31% / reading 36% proficiency, ranked #559 of 826 in TX (top 68%) — families likely to look elsewhere, expect single-tenant / working-renter base with shorter leases; 83% free/reduced lunch — lower-income household profile, screen leases tightly.
- Market conditions: 80 active listings in the ZIP; 40 comparable units currently listed for rent nearby; rentals at typical pace (median 17d on market — plan ~3-4 weeks tenant-placement turnaround); 12,577 units permitted in Dallas County in 2024 (6,829 in 5+ unit buildings).
Forward outlook
- In year one you build about $4k of equity ($2k loan paydown + $3k appreciation (1.1% local appreciation)).
- Dallas County population projected at +35% by 2050 — long-run rental-demand tailwind backs the buy-and-hold thesis.
- By year 8, paydown + projected appreciation supports a ~$35k cash-out refi (75% LTV) — recoverable capital for the next deal without selling this one.
Negotiation context
- It's been on market 38 days — a 3% lower offer ($242k) is reasonable based on typical stale-listing flexibility.
- 3 sale attempts with the ask held roughly flat each time — persistent listings suggest the price (not the market) is what's stuck; bring a comps-based counter.
Risks & watch-outs
- Climate carrying-cost: major wind risk, 27% chance of damaging wind over 30y; extreme-heat days projected 7→24/yr by 2055 (HVAC capex compounding) — expect insurance premiums to compound above CPI over the hold.
Questions for the listing agent
- What do current leases actually rent for vs. the listed asking? Can we see a recent rent roll and the last 12 months of T-12 income?
- It's been on market 38 days. Have you received any prior offers? Is the seller open to a 21% concession, seller financing, or rate buy-down credit?
- Is there a deadline driving the sale (1031 exchange, divorce, estate, relocation)? That informs how much negotiation room exists.
- Crime grade is F in this area — have there been break-ins, vandalism, or insurance claims at this property in the last 3 years? What carrier currently insures it and at what premium?
- The area grade is low — what's the realistic commute time and amenity access for the typical tenant pool here? Any planned neighborhood developments (good or bad) we should know about?
- What's the average days-on-market for RENTAL listings here right now (not sales)? A rising rental-DOM trend means longer vacancies and softer asking-rent achievability than the comps imply.
- What's the recent tenant-quality profile in this submarket — average credit score on applications, eviction rate, late-payment / NSF rate, and stable-employment percentage? A property-management company in the area should have these aggregated.
- How much new for-sale + rental construction is in the pipeline within 1–3 miles? Heavy new supply typically softens prices + rents 12–24 months out; constrained supply supports both.
Investment metrics
- 1% rule
- 0.79% ✗
- Cap rate
- 4.91%
- Cash-on-cash
- -4.94%
- DSCR
- 0.78
- GRM
- 10.6
CMA / ARV
- ARV (median comp)
- $249,900
- List price
- $249,900
- Delta
- —
- Verdict
- FAIR
- Comps
- 20 within 1.0 mi
Show comp detail 12 sales within ~0.75 mi
| Address | Dist | Beds/Ba | Sqft | Sold | Price | $/sf | Match |
|---|---|---|---|---|---|---|---|
| 3610 Frank | 0.20mi | 3/2.0 | 1,320 (-1%) | 1mo | $234,900 | $178 | 89 |
| 4307 Jamaica St | 0.34mi | 3/2.0 | 1,471 (+11%) | 2mo | $319,000 | $217 | 65 |
| 4219 Frank St | 0.25mi | 3/2.0 | 1,145 (-14%) | 2mo | $199,900 | $175 | 64 |
| 4827 Baldwin St | 0.70mi | 3/2.0 | 1,300 (-2%) | 1mo | $289,999 | $223 | 63 |
| 3910 Hancock St | 0.64mi | 3/2.0 | 1,300 (-2%) | 4mo | $275,000 | $212 | 63 |
| 3915 Coolidge St | 0.47mi | 4/2.0 (+1) | 1,416 (+7%) | 2mo | $230,000 | $162 | 61 |
| 4311 Metropolitan Ave | 0.42mi | 3/2.0 | 1,175 (-12%) | 2mo | $239,000 | $203 | 59 |
| 4606 Metropolitan Ave | 0.61mi | 3/2.0 | 1,415 (+7%) | 2mo | $272,800 | $193 | 59 |
| 4614 Metropolitan Ave | 0.63mi | 3/2.0 | 1,415 (+7%) | 3mo | $272,800 | $193 | 58 |
| 3719 Meadow St | 0.63mi | 3/2.0 | 1,222 (-8%) | 2mo | $225,000 | $184 | 55 |
| 3622 Cauthorn Dr | 0.75mi | 3/2.0 | 1,200 (-10%) | 1mo | $210,000 | $175 | 48 |
| 3626 Meyers St | 0.73mi | 3/2.0 | 1,144 (-14%) | 1mo | $167,000 | $146 | 42 |
Match score weights: distance 35% · size 25% · config 20% · recency 20%. Top-matched comps best support the ARV.
Projected returns pro-forma
1.07% appreciation · 3.0% rent growth · sell at horizon
- IRR
- -3.6%
- Equity multiple
- 0.82×
- Total profit
- $-12,745
- Equity at exit
- $86,179
- IRR
- 1.6%
- Equity multiple
- 1.19×
- Total profit
- $13,631
- Equity at exit
- $115,198
Cash invested: $69,972 (down + closing). Projections, not guarantees.
Landlord ↔ Tenant lean methodology
- Overall (STATE)
- 87 Strongly Landlord-Friendly
- State Texas
- 87 Strongly Landlord-Friendly · R+5
- County
- — inherits STATE
- City
- — inherits STATE
ZIP-level market 75210
- Home prices YoY
- 0.6%
- Active inventory
- 80
- Price-to-rent
- 10.6×
Monthly cashflow live
- Estimated rent
- $1,963 high interval (Pro) →
- Mortgage (P&I)
- −$1,311
- Tax from tax record
- −$424 /mo · $5,085/yr
- Insurance
- −$104
- HOA
- −$0
- Vacancy / Maint / Mgmt
- −$412
- Net cashflow
- $-288
Break-even live
UW: 25.0% down · 7.5% · 30yr · 1.5% tax · 5.0% vac · 8.0% maint · 8.0% mgmt
Financing live
Cash to close
- Down payment
- $62,475
- Closing costs
- $7,497
- Reserves months
- —
- Total cash needed
- —
Loan-product check · same deal, 3 products live
Conventional
25% down · 7.5% · 30yr
- Down + closing
- —
- Monthly P&I
- —
- Monthly cashflow
- —
- DSCR
- —
- Eligible?
- —
Personal DTI + credit; lowest rate.
DSCR
20% down · 8.5% · 30yr
- Down + closing
- —
- Monthly P&I
- —
- Monthly cashflow
- —
- DSCR
- —
- Eligible?
- —
No personal income docs; deal must DSCR.
Hard money
10% down · 12.0% · 12mo
- Down + closing
- —
- Monthly P&I
- —
- Monthly cashflow
- —
- DSCR
- —
- Eligible?
- —
Short-term bridge; refi at stabilization.
Rent comps 40 comps
| Address | Beds | Baths | Sqft | Rent | $/sqft | DOM | Units | Dist |
|---|---|---|---|---|---|---|---|---|
| 2714 Hector St Dallas, TX | 3.0 | 2.0 | 1233 | $2,100 | $1.70 | 24d | 1 | 0.14mi |
| 3639 Pine St Dallas, TX | 3.0 | 2.0 | 1090 | $1,490 | $1.37 | 13d | 1 | 0.15mi |
| 3726 Copeland St Dallas, TX | 3.0 | 2.0 | 1298 | $1,690 | $1.30 | 6d | 1 | 0.15mi |
| 3801 Carpenter Ave Dallas, TX | 4.0 | 2.0 | 1454 | $2,400 | $1.65 | 43d | 1 | 0.21mi |
| 4014 Marshall Dr Dallas, TX | 4.0 | 2.0 | 1600 | $1,850 | $1.16 | 24d | 1 | 0.22mi |
| 2724 Swanson St Dallas, TX | 4.0 | 2.0 | 1368 | $2,350 | $1.72 | 43d | 1 | 0.22mi |
| 2811 Morning Ave Dallas, TX | 3.0 | 2.0 | 1634 | $2,200 | $1.35 | 14d | 1 | 0.23mi |
| 3523 Herrling St Dallas, TX | 3.0 | 2.0 | 1525 | $1,800 | $1.18 | 16d | 1 | 0.25mi |
| 2720 Morning Ave Dallas, TX | 3.0 | 2.0 | 1332 | $2,350 | $1.76 | 43d | 1 | 0.26mi |
| 4303 Jamaica St Dallas, TX | 3.0 | 2.0 | 1027 | $1,375 | $1.34 | 6d | 1 | 0.34mi |
| 3331 Spring Ave Dallas, TX | 3.0 | 2.0 | 1652 | $2,200 | $1.33 | 7d | 1 | 0.37mi |
| 3331 Spring Ave Dallas, TX | 3.0 | 2.0 | 1652 | $2,200 | $1.33 | 24d | 1 | 0.37mi |
| 3619 York St Dallas, TX | 3.0 | 2.0 | 1298 | $1,740 | $1.34 | 7d | 1 | 0.39mi |
| 4220 Hamilton Ave Dallas, TX | 4.0 | 2.0 | 1692 | $2,350 | $1.39 | 43d | 1 | 0.42mi |
| 3915 Coolidge St Dallas, TX | 4.0 | 2.0 | 1416 | $2,100 | $1.48 | 43d | 1 | 0.49mi |
| 3907 Roberts Ave Dallas, TX | 3.0 | 1.0 | 908 | $1,395 | $1.54 | 14d | 1 | 0.54mi |
| 3526 Elsie Faye Heggins St Dallas, TX | 3.0 | 2.0 | 1113 | $1,795 | $1.61 | 24d | 1 | 0.54mi |
| 3526 Elsie Faye Heggins St Dallas, TX | 3.0 | 2.0 | 1113 | $1,795 | $1.61 | 7d | 1 | 0.54mi |
| 3627 Sidney St Dallas, TX | 3.0 | 2.0 | 1090 | $1,614 | $1.48 | 6d | 1 | 0.55mi |
| 4621 Collins Ave Dallas, TX | 4.0 | 2.5 | 1700 | $2,350 | $1.38 | 43d | 1 | 0.56mi |
| 4706 Spring Ave Dallas, TX | 3.0 | 2.0 | 1287 | $3,900 | $3.03 | 43d | 1 | 0.56mi |
| 4503 Bradshaw St Dallas, TX | 4.0 | 2.0 | 1263 | $1,600 | $1.27 | 7d | 1 | 0.57mi |
| 4525 Metropolitan Ave Dallas, TX | 3.0 | 2.0 | 1090 | $1,490 | $1.37 | 13d | 1 | 0.61mi |
| 4611 Bradshaw St Dallas, TX | 3.0 | 2.0 | 1145 | $1,550 | $1.35 | 24d | 1 | 0.62mi |
| 3308 Birmingham Ave Unit 6 Dallas, TX | 2.0 | 2.5 | 1341 | $2,175 | $1.62 | 16d | 1 | 0.68mi |
| 3308 Birmingham Ave Unit 1 Dallas, TX | 2.0 | 2.5 | 1451 | $2,275 | $1.57 | 24d | 1 | 0.68mi |
| 3308 Birmingham Ave Unit 03 Dallas, TX | 2.0 | 2.5 | 1451 | $2,275 | $1.57 | 43d | 1 | 0.68mi |
| 3308 Birmingham Ave Unit 7 Dallas, TX | 2.0 | 2.5 | 1287 | $2,125 | $1.65 | 14d | 1 | 0.68mi |
| 3308 Birmingham Ave Unit 11 Dallas, TX | 2.0 | 2.5 | 1505 | $2,375 | $1.58 | 43d | 1 | 0.68mi |
| 1514 Washington St Unit 105 Dallas, TX | 2.0 | 2.5 | 1404 | $2,950 | $2.10 | 7d | 1 | 0.79mi |
| 4722 Meadow St Dallas, TX | 2.0–3.0 | 2.0 | 1107 | $1,475 | $1.33 | 11d | 4 | 0.81mi |
| 2847 Metropolitan Ave Dallas, TX | 3.0 | 1.0 | 1344 | $2,050 | $1.53 | 21d | 1 | 0.83mi |
| 4717 Owenwood Ave Dallas, TX | 3.0 | 2.0 | 1090 | $1,490 | $1.37 | 13d | 1 | 0.83mi |
| 2822 McDermott Ave Dallas, TX | 3.0 | 2.0 | 1200 | $1,795 | $1.50 | 24d | 1 | 0.85mi |
| 4024 Myrtle St Dallas, TX | 3.0 | 2.0 | 1106 | $1,595 | $1.44 | 4d | 1 | 0.95mi |
| 5340 Dimple Jackson St Dallas, TX | 3.0 | 2.0 | 1298 | $1,864 | $1.44 | 6d | 1 | 1.00mi |
| 3711 Guaranty St Dallas, TX | 3.0 | 1.0 | 984 | $1,800 | $1.83 | 14d | 1 | 1.04mi |
| 1333 S Fitzhugh Ave Dallas, TX | 4.0 | 2.0 | 1670 | $1,895 | $1.13 | 7d | 1 | 1.09mi |
| 2840 Oakdale St Dallas, TX | 3.0 | 2.0 | 1379 | $1,900 | $1.38 | 43d | 1 | 1.11mi |
| 2829 Oakdale St Dallas, TX | 3.0 | 2.0 | 1028 | $1,840 | $1.79 | 7d | 1 | 1.11mi |
Listing history 6 events
-
2026-05-16status Pending 926-char remark
Show marketing remark (926 chars)
Welcome to this beautifully built 3-bedroom, 2.5-bath home located in the historic Mill City neighborhood. Nestled in vibrant South Dallas, this property offers unmatched proximity, long-term equity, and tremendous opportunity. This home also features a wrap around backyard; ideal for families with pets who may desire to fence off a pet section. Just minutes from Fair Park—future site of the 2026 World Cup—and with quick access to I-45, I-75 and I-30, getting around the city is a breeze. While most comparable 3 and 4 bedroom homes in the area are priced above $300K, this home offers potential instant equity, making it an ideal choice for buyers who've found homeownership just out of reach. Don’t miss this chance to own a brand-new home in a growing community! See additional documents for preferred lender information, DHAP program details, and other grant opportunities. Incentives include
-
2026-04-07$249,900 Active 926-char remark
Show marketing remark (926 chars)
Welcome to this beautifully built 3-bedroom, 2.5-bath home located in the historic Mill City neighborhood. Nestled in vibrant South Dallas, this property offers unmatched proximity, long-term equity, and tremendous opportunity. This home also features a wrap around backyard; ideal for families with pets who may desire to fence off a pet section. Just minutes from Fair Park—future site of the 2026 World Cup—and with quick access to I-45, I-75 and I-30, getting around the city is a breeze. While most comparable 3 and 4 bedroom homes in the area are priced above $300K, this home offers potential instant equity, making it an ideal choice for buyers who've found homeownership just out of reach. Don’t miss this chance to own a brand-new home in a growing community! See additional documents for preferred lender information, DHAP program details, and other grant opportunities. Incentives include
-
2025-12-24historical
-
2025-12-19status Active
-
2025-09-03status Pending
-
2025-08-28$249,900 Active
ⓘ Source: listings_history table (triggers on properties + properties_extension) + one-shot
backfill from property_details.listing_events for pre-trigger history.
Tax reassessment forecast TX · Resets to sale price
- Current annual tax
- $5,085 · $424/mo
- Projected year-2 tax
- $5,085 · $424/mo
- Expected delta
- $0/yr ($0/mo · 0.0%)
ⓘ Screening estimate from a state-policy table — verify with the county assessor before closing.
Climate risk First Street
- Flood 1/10 Low FEMA zone X (unshaded) · 0% chance over 30 yrs
- Wildfire 3/10 Moderate
- Heat 7/10 Severe 7 d/yr ≥110°F today · 24 d/yr by 30 yrs out
- Wind 6/10 Major 27% chance of damaging wind over 30 yrs
- Air quality 2/10 Low 2 unhealthy d/yr today · 2 by 30 yrs out
Nearby sold comps map
Loading sold comps map…
Walkable amenities ~0.75 mi
Loading nearby amenities…
Taxation est. · year 1
- Rental income
- $23,553
- − Mortgage interest
- −$13,998
- − Property taxes
- −$5,085
- − Insurance
- −$1,250
- − Repairs & maintenance
- −$1,884
- − Management
- −$1,884
- − Depreciation
- −$7,270
- Taxable loss
- −$7,818
- Est. tax savings @ 24.0%
- +$1,876
- After-tax cash flow
- $-1,577/yr
For passive investors: Depreciation is non-cash, so a rental often shows a tax loss while cash-flowing — sheltering income. Rental losses are passive: they offset passive income freely, and up to $25,000/yr can offset ordinary (W-2) income if you actively participate and your MAGI is under $100k (phasing out to $0 by $150k); unused losses carry forward. On sale, claimed depreciation is recaptured at up to 25%, and gains may owe capital-gains tax (a 1031 exchange can defer both). Figures are a year-1 estimate at your 24.0% rate — not tax advice; consult a CPA.
Schools (NCES district)
- District
- Dallas ISD
- NCES district ID
- 4816230
- Math proficiency
- 31% ▼ -16.00%
- Reading proficiency
- 36% ▼ -4.00%
- Median HH income
- $42,881
- Composite
- 28.41/100
- National rank
- #6763
- State rank
- #559 of 826 in TX
Livability — Dallas
- Score
- 81/100
- State rank
- #24
- US rank
- #1380
Category grades
Schools grade is shown separately in the Schools card above.
Census & demographics
- Census place
- Dallas, TX
- City population
- 1,168,437
- Population (ZIP)
- 7,458
Population outlook (Dallas County) Hauer SSP2
- Today (2025)
- 2,979,839 people
- By 2030
- 3,191,823 · +7.1%
- By 2040
- 3,619,611 · +21.5%
- By 2050
- 4,026,915 · +35.1%
- By 2075
- 4,957,073 · +66.4%
- By 2100
- 5,508,725 · +84.9%
Race, ethnicity, and origin ACS 2023
- Neighborhood character
- Majority Black (56%)
- Race & ethnicity
- Black 56% Hispanic / Latino 39% Two or more races 12% White 3% Asian 2%
- Hispanic origin (detail)
- Mexican 17%
- Foreign-born
- 23% · Canada, Vietnam
- Languages at home
- 66% English-only · Spanish 32% Vietnamese 2%
Political lean MEDSL · Dallas
- 2024 margin
- Strong D (+22.2) · D 60.2% · R 38.0% · Other 1.8%
- 2008→2024 swing
- +6.9pp toward D · 2008: 15.3pp · 2024: 22.2pp
- All cycles
- 2024: D+22.2 2020: D+31.6 2016: D+26.2 2012: D+15.4 2008: D+15.3
Not yet ingested
- Civics
- —
Market trends
- HPI YoY
- ▲ 1.07%
- Current HPI
- 177.2281
- Rent YoY
- —
- Metro
- —
- State GDP YoY
- ▲ 3.95%
- F500 in state
- 110
Industry mix (Fortune 500 HQ in TX)
| Industry | F500 HQs | Revenue |
|---|---|---|
| Energy | 16 | $1,198B |
|
||
| Technology | 5 | $198B |
|
||
| Engineering / Construction | 4 | $72B |
|
||
| Energy Services | 3 | $60B |
|
||
| Utilities | 3 | $41B |
|
||
| Healthcare | 2 | $330B |
|
||
Price history
+0.0% since first listed6 events — show timeline
- 2026-05-16 Pending — NTREIS
- 2026-04-07 Listed $249,900 NTREIS
- 2025-12-24 Listing Removed — NTREIS
- 2025-12-19 Relisted — NTREIS
- 2025-09-03 Pending — NTREIS
- 2025-08-28 Listed $249,900 NTREIS
Property tax history
+15.8%/yrLatest (2025): $5,085 · +544.5% YoY. Source: county tax records.
Cash-flow waterfall
monthlySold comps — $/sqft
last 12 mo · ≤1 miLoading sold comps…