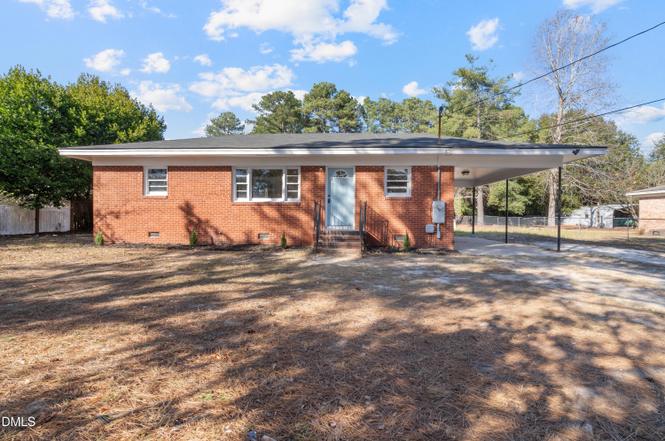
1546 Eloise St · Fayetteville, NC
Flood risk 1/10 · Minimal
- FEMA flood zone
- X (unshaded)
- Chance of flooding over 30 yrs
- 0.0%
- Est. flood insurance / yr
- $507 – $1,088
Fire risk 5/10 · Moderate
- Est. fire insurance / yr
- $906 – $1,684
Heat risk 7/10 · Major
- Hot days now (above 105°F)
- 7 days/yr
- Hot days in 30 yrs
- 16 days/yr
Wind risk 6/10 · Moderate
- Chance of severe wind over 30 yrs
- 76.0%
Air-quality risk 2/10 · Minimal
- Unhealthy air days now
- 0 days/yr
- Unhealthy air days in 30 yrs
- 1 days/yr
Risk factors via First Street. Map © Google.
Why this score? — see what drove the D grade
The composite is a weighted blend of 9 inputs, each scored 0–100. Each bar is that input's sub-score; the figure is the points it added to the 100-point composite (weight × sub-score).
- Cash flow +14.2/30.0
- ARV discount +9.9/15.0
- DSCR +4.3/10.0
- Livability +3.8/5.0
- Rent growth +3.2/5.0
- 1% rule +3.1/10.0
- Schools +3.1/10.0
- Condition / age +2.5/5.0
- Appreciation +0.0/10.0
$159,500
🖨 Deal sheet 📄 Offer letter ✓ Due diligence
Listing remarks
Welcome Home to Fayetteville! Discover a welcoming property tucked into an established Fayetteville area. This home offers a comfortable setting with spaces that can suit a variety of lifestyles, whether you're relaxing, hosting, or getting creative with your personal style. * Spring Special, ask us what we are offering for this season!
Key facts
- 0.46 acre lot
- Built 1959
- Listed 198 days
Property features AI
Finance
- Other: Living area approximately 1,001; Located in Cumberland County; Directions available
- HOA & community: No homeowners association; Not a senior community
Exterior
- Utilities: Public water; Public sewer
- Home design: House; One level
- Construction: Brick and other construction materials
- Exterior features: Shingle roof; Lot approximately 0.46 acres; Public maintained road access
Interior
- Bedrooms: 3 bedrooms
- Flooring: Hardwood; Vinyl
- Bathrooms: 1 full bathroom
- Heating & cooling: Forced air heating; Central air conditioning
- Interior features: Hardwood and vinyl flooring; 1 full bathroom
Neighborhood map
What this means for you Summary
Snapshot
- This is a 3-bed/1.0-bath single-family listed at $160k.
Deal economics
- At list price, monthly cash flow is $25 ($299/yr) — positive.
- The deal already cash-flows at list — no discount required.
- To meet the 1% rule (rent ≥ 1% of price), the offer needs to be $128k (19.5% below list).
- Recommended offer: $128k (19.5% below list) — sets the bar for 1% rule.
- Cap rate 6.5% vs local median 4.9% in Fayetteville — top-decile yield for the area; either an underpriced asset or a hidden risk that comps aren't pricing in. Stress-test before assuming the spread holds.
Location & tenants
- Location reads 75/100 on livability (#45 in NC, #4,031 nationally) — a middle-class / working-renter tenant base. Strengths: commute A+, cost of living A+, housing A+; Watch: crime F, employment D-.
- Cumberland County Schools (urban): math 32% / reading 41% proficiency, ranked #126 of 178 in NC (top 71%) — families likely to look elsewhere, expect single-tenant / working-renter base with shorter leases.
- Zoned schools: Pine Forest Middle (math 38% / reading 49%, grade D, #182 of 475 statewide, top 40%, 738 students, 56% FRL); Pine Forest High (math 73% / reading 51%, grade B-, #184 of 535 statewide, top 37%, 1,572 students, 62% FRL) — zoned schools at 59% FRL track the district average.
- Zoned-school proficiency averages 53% at this address vs 36% district-wide (+16 pts) — the actual schools serving this property are materially stronger than the Cumberland County Schools average implies; a family-tenant draw the district grade alone would hide.
- Market conditions: Rents rising (+2.8%/yr); 360 active listings in the ZIP; 22 comparable units currently listed for rent nearby; rentals at typical pace (median 24d on market — plan ~3-4 weeks tenant-placement turnaround); 1,125 units permitted in Cumberland County in 2024 (104 in 5+ unit buildings).
Forward outlook
- Local home prices are declining (-3.0%/yr); year-one equity from $1k of loan paydown is wiped out by about $5k of value loss. Plan a longer hold.
Negotiation context
- It's been on market 198 days — a 12% lower offer ($140k) is reasonable based on typical stale-listing flexibility.
- Current owner paid $70k; list at $160k implies a 128% gain — meaningful room to come down on a strong offer.
Risks & watch-outs
- Watch-outs: built in 1959 — expect roof / HVAC / electrical / plumbing capex.
- Climate carrying-cost: major wind risk, 76% chance of damaging wind over 30y; moderate wildfire risk; extreme-heat days projected 7→16/yr by 2055 (HVAC capex compounding) — expect insurance premiums to compound above CPI over the hold.
Questions for the listing agent
- It's been on market 198 days. Have you received any prior offers? Is the seller open to a 19% concession, seller financing, or rate buy-down credit?
- Built in 1959 — when were the roof, HVAC, electrical panel, plumbing, and water heater last replaced?
- Why hasn't it sold? Are there any deal-killer items the seller is aware of (foundation, flood, title, zoning, code violations)?
- Is there a deadline driving the sale (1031 exchange, divorce, estate, relocation)? That informs how much negotiation room exists.
- Crime grade is F in this area — have there been break-ins, vandalism, or insurance claims at this property in the last 3 years? What carrier currently insures it and at what premium?
- The area grade is low — what's the realistic commute time and amenity access for the typical tenant pool here? Any planned neighborhood developments (good or bad) we should know about?
- What's the average days-on-market for RENTAL listings here right now (not sales)? A rising rental-DOM trend means longer vacancies and softer asking-rent achievability than the comps imply.
- What's the recent tenant-quality profile in this submarket — average credit score on applications, eviction rate, late-payment / NSF rate, and stable-employment percentage? A property-management company in the area should have these aggregated.
- How much new for-sale + rental construction is in the pipeline within 1–3 miles? Heavy new supply typically softens prices + rents 12–24 months out; constrained supply supports both.
Investment metrics
- 1% rule
- 0.81% ✗
- Cap rate
- 6.48%
- Cash-on-cash
- 0.67%
- DSCR
- 1.03
- GRM
- 10.3
CMA / ARV
- ARV (on-the-fly)
- $168,336
- Comps found
- 8
Show comp detail 8 sales within ~0.75 mi
| Address | Dist | Beds/Ba | Sqft | Sold | Price | $/sf | Match |
|---|---|---|---|---|---|---|---|
| 576 Braxton Blvd | 0.62mi | 3/2.0 | 1,011 (+0%) | 1mo | $175,000 | $173 | 65 |
| 6122 Pine St | 0.09mi | 3/1.0 | 877 (-13%) | 18mo | $145,000 | $165 | 59 |
| 6546 Winthrop Dr | 0.55mi | 3/1.0 | 945 (-6%) | 14mo | $156,000 | $165 | 52 |
| 6402 Beacon St | 0.64mi | 3/1.0 | 890 (-12%) | 8mo | $130,000 | $146 | 44 |
| 656 Woodburn Dr | 0.68mi | 3/1.0 | 1,095 (+9%) | 17mo | $176,000 | $161 | 40 |
| 6569 Cushing Dr | 0.68mi | 3/1.5 | 1,128 (+12%) | 10mo | $188,000 | $167 | 38 |
| 616 Woodburn Dr | 0.70mi | 3/2.0 | 1,101 (+9%) | 17mo | $192,000 | $174 | 34 |
| 618 Woodburn Dr | 0.70mi | 3/1.0 | 897 (-11%) | 18mo | $156,135 | $174 | 34 |
Match score weights: distance 35% · size 25% · config 20% · recency 20%. Top-matched comps best support the ARV.
Projected returns pro-forma
-3.0% appreciation · 2.82% rent growth · sell at horizon
- IRR
- -15.5%
- Equity multiple
- 0.45×
- Total profit
- $-24,539
- Equity at exit
- $23,782
- IRR
- -7.3%
- Equity multiple
- 0.54×
- Total profit
- $-20,474
- Equity at exit
- $13,791
Cash invested: $44,660 (down + closing). Projections, not guarantees.
Landlord ↔ Tenant lean methodology
- Overall (STATE)
- 85 Strongly Landlord-Friendly
- State North Carolina
- 85 Strongly Landlord-Friendly · R+3
- County
- — inherits STATE
- City
- — inherits STATE
ZIP-level market 28311
- Home prices YoY
- -18.4%
- Rents YoY
- 2.8%
- Active inventory
- 360
- Price-to-rent
- 10.3×
Monthly cashflow live
- Estimated rent
- $1,285 high interval (Pro) →
- Mortgage (P&I)
- −$836
- Tax from tax record
- −$87 /mo · $1,044/yr
- Insurance
- −$66
- HOA
- −$0
- Vacancy / Maint / Mgmt
- −$270
- Net cashflow
- $25
Break-even live
UW: 25.0% down · 7.5% · 30yr · 1.5% tax · 5.0% vac · 8.0% maint · 8.0% mgmt
Financing live
Cash to close
- Down payment
- $39,875
- Closing costs
- $4,785
- Reserves months
- —
- Total cash needed
- —
Loan-product check · same deal, 3 products live
Conventional
25% down · 7.5% · 30yr
- Down + closing
- —
- Monthly P&I
- —
- Monthly cashflow
- —
- DSCR
- —
- Eligible?
- —
Personal DTI + credit; lowest rate.
DSCR
20% down · 8.5% · 30yr
- Down + closing
- —
- Monthly P&I
- —
- Monthly cashflow
- —
- DSCR
- —
- Eligible?
- —
No personal income docs; deal must DSCR.
Hard money
10% down · 12.0% · 12mo
- Down + closing
- —
- Monthly P&I
- —
- Monthly cashflow
- —
- DSCR
- —
- Eligible?
- —
Short-term bridge; refi at stabilization.
Rent comps 22 comps
| Address | Beds | Baths | Sqft | Rent | $/sqft | DOM | Units | Dist |
|---|---|---|---|---|---|---|---|---|
| 1547 Center St Fayetteville, NC | 2.0 | 1.0 | 802 | $850 | $1.06 | 23d | 1 | 0.14mi |
| 1527 McArthur Rd Fayetteville, NC | 3.0 | 1.0 | 864 | $925 | $1.07 | 23d | 1 | 0.23mi |
| 1725 Cumberland Dr Fayetteville, NC | 2.0 | 1.0 | 750 | $900 | $1.20 | 23d | 1 | 0.35mi |
| 549 Braxton Blvd Fayetteville, NC | 2.0 | 1.5 | 950 | $1,075 | $1.13 | 23d | 1 | 0.57mi |
| 557 Braxton Blvd Fayetteville, NC | 2.0 | 1.5 | 950 | $1,075 | $1.13 | 21d | 1 | 0.57mi |
| 561 Braxton Blvd Fayetteville, NC | 2.0 | 1.5 | 950 | $1,075 | $1.13 | 14d | 2 | 0.57mi |
| 575 Braxton Blvd Fayetteville, NC | 3.0 | 2.0 | 1001 | $1,295 | $1.29 | 14d | 1 | 0.59mi |
| 1009 Louisburg Pl Fayetteville, NC | 3.0 | 2.0 | 1362 | $1,550 | $1.14 | 23d | 1 | 0.76mi |
| 6637 Abbey Ln Fayetteville, NC | 2.0 | 1.0 | 753 | $895 | $1.19 | 23d | 1 | 0.82mi |
| 5327 Chesapeake Rd Fayetteville, NC | 3.0 | 2.0 | 1400 | $1,600 | $1.14 | 14d | 1 | 0.83mi |
| 1017 Xavier Ct Fayetteville, NC | 3.0 | 2.0 | 1401 | $1,595 | $1.14 | 23d | 1 | 0.85mi |
| 633 Winthrop Ct Fayetteville, NC | 3.0 | 2.0 | 1104 | $1,500 | $1.36 | 14d | 1 | 0.88mi |
| 806 Carnegie Dr Fayetteville, NC | 3.0 | 1.5 | 1118 | $1,400 | $1.25 | 23d | 1 | 0.89mi |
| 644 Clayton Dr Fayetteville, NC | 3.0 | 1.5 | 1150 | $1,100 | $0.96 | 23d | 1 | 0.90mi |
| 1018 Appalachin Dr Fayetteville, NC | 3.0 | 2.0 | 1118 | $1,700 | $1.52 | 23d | 1 | 0.92mi |
| 3405 Revolution Rd Fayetteville, NC | 1.0–2.0 | 1.0–2.0 | 977 | $1,587 | $1.62 | 14d | 7 | 0.92mi |
| 6702 Agnes Scott Ct Fayetteville, NC | 3.0 | 1.0 | 954 | $1,200 | $1.26 | 23d | 1 | 0.93mi |
| 1003 Madiera Ct Fayetteville, NC | 2.0 | 2.0 | 950 | $1,275 | $1.34 | 23d | 1 | 1.09mi |
| 318 Nugget Ct Fayetteville, NC | 4.0 | 2.0 | 1425 | $1,650 | $1.16 | 14d | 1 | 1.25mi |
| 2500 McArthur Landing Cir Fayetteville, NC | 2.0–3.0 | 2.0 | 1226 | $1,420 | $1.16 | 14d | 13 | 1.45mi |
| 790 Arthington St Fayetteville, NC | 2.0 | 2.5 | 1000 | $1,350 | $1.35 | 23d | 1 | 1.47mi |
| 417 Nottingham Dr Fayetteville, NC | 3.0 | 2.0 | 1024 | $1,400 | $1.37 | 23d | 1 | 1.49mi |
Listing history 21 events
-
2026-06-18days on market $159,500 Active 198 DOM
-
2026-06-17days on market $159,500 Active 197 DOM
-
2026-06-16days on market $159,500 Active 196 DOM
-
2026-06-15days on market $159,500 Active 195 DOM
-
2026-06-14days on market $159,500 Active 193 DOM
-
2026-06-13days on market $159,500 Active 192 DOM
-
2026-06-10days on market $159,500 Active 190 DOM
-
2026-06-09days on market $159,500 Active 189 DOM
-
2026-06-08days on market $159,500 Active 188 DOM
-
2026-06-07days on market $159,500 Active 187 DOM
-
2026-06-03days on market $159,500 Active 183 DOM
-
2026-06-02days on market $159,500 Active 182 DOM
-
2026-06-01days on market $159,500 Active 181 DOM
-
2026-05-31days on market $159,500 Active 180 DOM
-
2026-05-30days on market $159,500 Active 179 DOM
-
2026-03-21price $159,500
-
2026-03-13price $159,600
-
2026-03-08price $159,700
-
2026-02-26price $159,800
-
2025-11-18$159,900 Active
-
2022-03-28soldstatus $70,000
ⓘ Source: listings_history table (triggers on properties + properties_extension) + one-shot
backfill from property_details.listing_events for pre-trigger history.
Tax reassessment forecast NC · Resets to sale price
- Current annual tax
- $1,044 · $87/mo
- Projected year-2 tax
- $1,308 · $109/mo
- Expected delta
- +$264/yr (+$22/mo · 25.2%)
ⓘ Screening estimate from a state-policy table — verify with the county assessor before closing.
Climate risk First Street
- Flood 1/10 Low FEMA zone X (unshaded) · 0% chance over 30 yrs
- Wildfire 5/10 Major
- Heat 7/10 Severe 7 d/yr ≥105°F today · 16 d/yr by 30 yrs out
- Wind 6/10 Major 76% chance of damaging wind over 30 yrs
- Air quality 2/10 Low 0 unhealthy d/yr today · 1 by 30 yrs out
Nearby sold comps map
Loading sold comps map…
Walkable amenities ~0.75 mi
Loading nearby amenities…
Taxation est. · year 1
- Rental income
- $15,416
- − Mortgage interest
- −$8,934
- − Property taxes
- −$1,044
- − Insurance
- −$798
- − Repairs & maintenance
- −$1,233
- − Management
- −$1,233
- − Depreciation
- −$4,640
- Taxable loss
- −$2,467
- Est. tax savings @ 24.0%
- +$592
- After-tax cash flow
- $891/yr
For passive investors: Depreciation is non-cash, so a rental often shows a tax loss while cash-flowing — sheltering income. Rental losses are passive: they offset passive income freely, and up to $25,000/yr can offset ordinary (W-2) income if you actively participate and your MAGI is under $100k (phasing out to $0 by $150k); unused losses carry forward. On sale, claimed depreciation is recaptured at up to 25%, and gains may owe capital-gains tax (a 1031 exchange can defer both). Figures are a year-1 estimate at your 24.0% rate — not tax advice; consult a CPA.
Schools (NCES district)
- District
- Cumberland County Schools
- NCES district ID
- 3700011
- Math proficiency
- 32% ▼ -2.00%
- Reading proficiency
- 41% ▼ -1.00%
- Median HH income
- $44,168
- Composite
- 31.0/100
- National rank
- #6096
- State rank
- #126 of 178 in NC
Livability — Fayetteville
- Score
- 75/100
- State rank
- #45
- US rank
- #4031
Category grades
Schools grade is shown separately in the Schools card above.
Census & demographics
- County
- Cumberland County · 265,314 people
- City population
- 226,118
- Metro
- Fayetteville, NC
- Population (ZIP)
- 36,629
- Household income
- $62,170
- Rent vs Own
- Severe rent burden
- 1645.0
Population outlook (Cumberland County) Hauer SSP2
- Today (2025)
- 330,855 people
- By 2030
- 333,523 · +0.8%
- By 2040
- 335,583 · +1.4%
- By 2050
- 335,325 · +1.4%
- By 2075
- 342,853 · +3.6%
- By 2100
- 340,698 · +3.0%
Race, ethnicity, and origin ACS 2023
- Neighborhood character
- Diverse neighborhood (Simpson 0.67)
- Race & ethnicity
- Black 42% White 38% Hispanic / Latino 9% Two or more races 8% Asian 3% Native American 1%
- Hispanic origin (detail)
- Mexican 3% Puerto Rican 4%
- Common ancestry
- Slovak 1% Lithuanian 1% Italian 1%
- Foreign-born
- 7% · Canada, South Korea, Jamaica
- Languages at home
- 89% English-only · Spanish 6% German/W. Germanic 1% Other Indo-European 1%
Political lean MEDSL · Cumberland
- 2024 margin
- D (+13.4) · D 56.1% · R 42.7% · Other 1.2%
- 2008→2024 swing
- -4.3pp toward R · 2008: 17.7pp · 2024: 13.4pp
- All cycles
- 2024: D+13.4 2020: D+16.6 2016: D+16.0 2012: D+19.7 2008: D+17.7
Not yet ingested
- Civics
- —
Market trends
- HPI YoY
- ▼ -45.88%
- Current HPI
- 203.0731
- Rent YoY
- ▲ 2.82%
- Metro
- Fayetteville, NC
- State GDP YoY
- ▲ 3.28%
- F500 in state
- 26
Industry mix (Fortune 500 HQ in NC)
| Industry | F500 HQs | Revenue |
|---|---|---|
| Financial Services | 2 | $213B |
|
||
| Retail | 2 | $95B |
|
||
| Industrial Conglomerate | 1 | $38B |
|
||
| Metals / Steel | 1 | $35B |
|
||
| Utilities | 1 | $30B |
|
||
| Industrial Machinery | 1 | $19B |
|
||
Price history
+127.9% since first listed6 events — show timeline
- 2026-03-21 Price Changed $159,500 TMLS
- 2026-03-13 Price Changed $159,600 TMLS
- 2026-03-08 Price Changed $159,700 TMLS
- 2026-02-26 Price Changed $159,800 TMLS
- 2025-11-18 Listed $159,900 TMLS
- 2022-03-28 Sold (Public Records) $70,000 Public Records
Property tax history
+5.8%/yrLatest (2025): $1,044 · +37.0% YoY. Source: county tax records.
Cash-flow waterfall
monthlySold comps — $/sqft
last 12 mo · ≤1 miLoading sold comps…