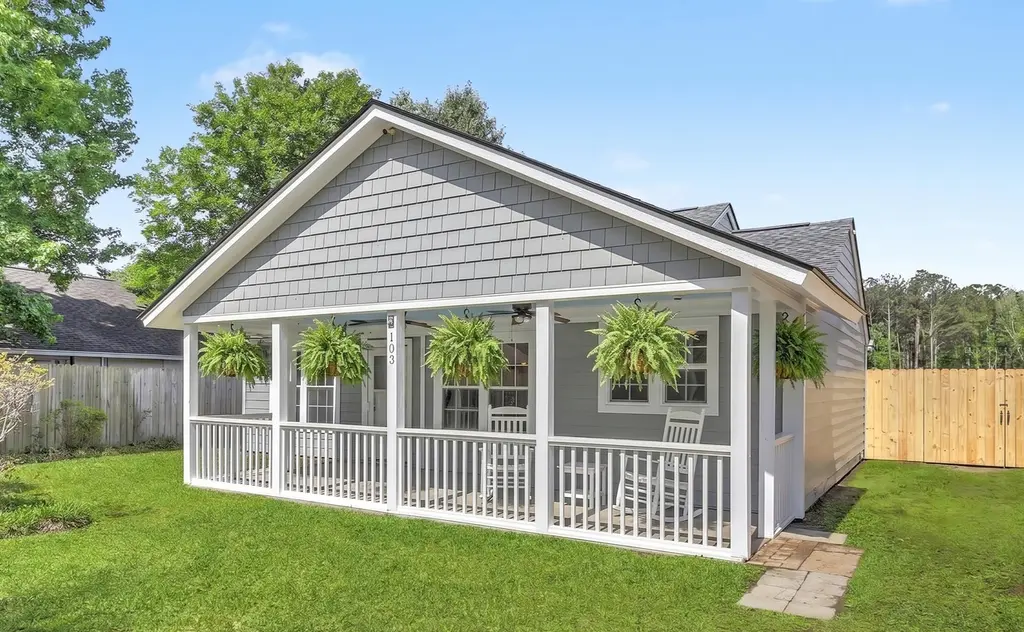
103 Tweed Ct · Sangaree, SC
Flood risk 1/10 · Minimal
- FEMA flood zone
- X (unshaded)
- Chance of flooding over 30 yrs
- 0.0%
- Est. flood insurance / yr
- $507 – $1,088
Fire risk 4/10 · Minor
- Est. fire insurance / yr
- $783 – $1,453
Heat risk 9/10 · Severe
- Hot days now (above 108°F)
- 7 days/yr
- Hot days in 30 yrs
- 17 days/yr
Wind risk 8/10 · Major
- Chance of severe wind over 30 yrs
- 97.0%
Air-quality risk 2/10 · Minimal
- Unhealthy air days now
- 2 days/yr
- Unhealthy air days in 30 yrs
- 2 days/yr
Risk factors via First Street. Map © Google.
Why this score? — see what drove the F grade
The composite is a weighted blend of 9 inputs, each scored 0–100. Each bar is that input's sub-score; the figure is the points it added to the 100-point composite (weight × sub-score).
- Cash flow +14.4/30.0
- DSCR +4.4/10.0
- Schools +3.6/10.0
- Rent growth +3.2/5.0
- Livability +3.2/5.0
- 1% rule +2.7/10.0
- Condition / age +2.5/5.0
- ARV discount +0.0/15.0
- Appreciation +0.0/10.0
$289,000
🖨 Deal sheet (PDF) 📄 Offer letter ✓ Due diligence
Listing remarks
Move-in ready and fully renovated including a NEW ROOF, this charming 3-bedroom home in Summerville offers the rare combination of NO HOA, a large, fenced yard, and a detached powered workshop--all tucked away on a quiet cul-de-sac just minutes from downtown Summerville and an easy drive to Charleston. Located at 103 Tweed Court, this updated single-story home is ideal for first-time buyers, downsizers, investors, or anyone searching for a low-maintenance home with space to park a boat, trailer, or recreational vehicles. The . 21-acre lot features double-gate backyard access, making it easy to store outdoor toys, work vehicles, or equipment without HOA restrictions. Inside, the bright open
Key facts
- Large fenced yard
- Vaulted ceilings
- No hoa
Tags
Property features AI
Finance
- HOA & community: Trash service in community
Exterior
- Parking: Off-street parking
- Utilities: Public sewer
- Home design: Single-family detached home; One story; Ground-level entry; Located in a cul-de-sac; Lot under 0.5 acre; Architectural roof
- Construction: Wood fencing noted; Architectural roof
- Exterior features: Privacy wood fencing (fully enclosed); Shed(s), storage and workshop structures
Interior
- Kitchen: Dishwasher; Electric range; Microwave
- Bedrooms: 3 bedrooms; Primary bedroom on lower level with ceiling fan
- Flooring: Ceramic tile; Luxury vinyl
- Bathrooms: 1 bathroom
- Heating & cooling: Central heating (electric); Central air conditioning
- Interior features: Beamed ceilings; Cathedral/vaulted ceilings; Smooth ceilings; Ceiling fans; Eat-in kitchen; Family room
- Laundry & utility: Laundry room with washer hookup; Electric dryer hookup
Neighborhood map
What this means for you Summary
Snapshot
- This is a 3-bed/1.0-bath single-family listed at $289k.
Deal economics
- At list price, monthly cash flow is $57 ($688/yr) — positive.
- The deal already cash-flows at list — no discount required.
- To meet the 1% rule (rent ≥ 1% of price), the offer needs to be $223k (23.0% below list).
- Recommended offer: $223k (23.0% below list) — sets the bar for 1% rule.
- Cap rate 6.5% vs local median 4.7% in Sangaree — top-decile yield for the area; either an underpriced asset or a hidden risk that comps aren't pricing in. Stress-test before assuming the spread holds.
Location & tenants
- Location reads 63/100 on livability (#166 in SC) — a middle-class / working-renter tenant base. Strengths: cost of living A+, housing A+, employment B; Watch: amenities F, commute F, health & safety F.
- Berkeley 01 (suburban): math 35% / reading 48% proficiency, ranked #30 of 80 in SC (top 38%) — families likely to look elsewhere, expect single-tenant / working-renter base with shorter leases.
- Zoned schools: Sangaree Elementary (659 students, 66% FRL); Sangaree Middle (math 20% / reading 34%, grade F, #153 of 229 statewide, top 68%, 826 students, 55% FRL); Stratford High (math 49% / reading 79%, grade B-, #92 of 196 statewide, top 48%, 2,653 students, 42% FRL).
- Market conditions: Rents rising (+2.7%/yr); 1301 active listings in the ZIP; 11 comparable units currently listed for rent nearby; rentals leasing fast (median 5d on market — plan ~1-2 weeks tenant-placement turnaround); solid renter incomes; 3,183 units permitted in Berkeley County in 2024 (580 in 5+ unit buildings).
Forward outlook
- Local home prices are declining (-3.0%/yr); year-one equity from $2k of loan paydown is wiped out by about $9k of value loss. Plan a longer hold.
- Berkeley County population projected at +48% by 2050 — long-run rental-demand tailwind backs the buy-and-hold thesis.
Negotiation context
- It's been on market 34 days — a 3% lower offer ($280k) is reasonable based on typical stale-listing flexibility.
- 2 sale attempts since 23y ago with the ask held roughly flat each time — persistent listings suggest the price (not the market) is what's stuck; bring a comps-based counter.
- Current owner paid $50k; list at $289k implies a 478% gain — meaningful room to come down on a strong offer.
Risks & watch-outs
- Climate carrying-cost: severe wind risk, 97% chance of damaging wind over 30y; extreme-heat days projected 7→17/yr by 2055 (HVAC capex compounding) — expect insurance premiums to compound above CPI over the hold.
Questions for the listing agent
- It's been on market 34 days. Have you received any prior offers? Is the seller open to a 23% concession, seller financing, or rate buy-down credit?
- Is there a deadline driving the sale (1031 exchange, divorce, estate, relocation)? That informs how much negotiation room exists.
- Schools are D-rated, which usually means shorter tenancies and higher turnover. Who's the typical renter profile here, and what's been the actual vacancy rate?
- The area grade is low — what's the realistic commute time and amenity access for the typical tenant pool here? Any planned neighborhood developments (good or bad) we should know about?
- What's the average days-on-market for RENTAL listings here right now (not sales)? A rising rental-DOM trend means longer vacancies and softer asking-rent achievability than the comps imply.
- What's the recent tenant-quality profile in this submarket — average credit score on applications, eviction rate, late-payment / NSF rate, and stable-employment percentage? A property-management company in the area should have these aggregated.
- How much new for-sale + rental construction is in the pipeline within 1–3 miles? Heavy new supply typically softens prices + rents 12–24 months out; constrained supply supports both.
Investment metrics
- 1% rule
- 0.77% ✗
- Cap rate
- 6.53%
- Cash-on-cash
- 0.85%
- DSCR
- 1.04
- GRM
- 10.8
CMA / ARV
- ARV (on-the-fly)
- $241,296
- Comps found
- 10
Show comp detail 10 sales within ~0.75 mi
| Address | Dist | Beds/Ba | Sqft | Sold | Price | $/sf | Match |
|---|---|---|---|---|---|---|---|
| 136 Tabby Creek Circle Cir | 0.13mi | 3/1.0 | 1,013 (+11%) | 8mo | $250,000 | $247 | 69 |
| 1009 Douglas Wayne Rd | 0.49mi | 2/1.0 (-1) | 951 (+4%) | 3mo | $260,000 | $273 | 63 |
| 154 Tabby Creek Cir | 0.17mi | 3/2.0 | 1,015 (+11%) | 13mo | $235,000 | $232 | 59 |
| 103 Bruce Ct | 0.29mi | 3/2.0 | 1,008 (+10%) | 8mo | $277,500 | $275 | 58 |
| 129 Heather Dr | 0.34mi | 3/2.0 | 1,008 (+10%) | 7mo | $294,000 | $292 | 57 |
| 113 Pine Ct | 0.50mi | 3/1.0 | 1,050 (+15%) | 1mo | $260,000 | $248 | 50 |
| 123 Harold Drive Dr | 0.52mi | 3/1.0 | 1,025 (+12%) | 6mo | $215,000 | $210 | 50 |
| 1019 Tj Ln | 0.48mi | 3/1.5 | 1,000 (+9%) | 13mo | $255,000 | $255 | 49 |
| 320 Winding Ln | 0.44mi | 3/2.0 | 1,028 (+12%) | 10mo | $275,000 | $268 | 47 |
| 1555 Royle Rd | 0.39mi | 3/2.0 | 1,040 (+14%) | 21mo | $275,000 | $264 | 37 |
Match score weights: distance 35% · size 25% · config 20% · recency 20%. Top-matched comps best support the ARV.
Projected returns pro-forma
-3.0% appreciation · 2.67% rent growth · sell at horizon
- IRR
- -15.3%
- Equity multiple
- 0.46×
- Total profit
- $-44,066
- Equity at exit
- $43,091
- IRR
- -7.4%
- Equity multiple
- 0.54×
- Total profit
- $-37,278
- Equity at exit
- $24,987
Cash invested: $80,920 (down + closing). Projections, not guarantees.
Landlord ↔ Tenant lean methodology
- Overall (STATE)
- 90 Strongly Landlord-Friendly
- State South Carolina
- 90 Strongly Landlord-Friendly · R+6
- County
- — inherits STATE
- City
- — inherits STATE
ZIP-level market 29486
- Home prices YoY
- -15.6%
- Rents YoY
- 2.7%
- Active inventory
- 1301
- Price-to-rent
- 10.8×
Monthly cashflow live
- Estimated rent
- $2,226 high interval (Pro) →
- Mortgage (P&I)
- −$1,516
- Tax from tax record
- −$65 /mo · $780/yr
- Insurance
- −$120
- HOA
- −$0
- Vacancy / Maint / Mgmt
- −$467
- Net cashflow
- $57
Break-even live
Sensitivity live
| Price | -10% $221 | -5% $139 | +0% $57 | +5% $-24 | +10% $-106 |
|---|---|---|---|---|---|
| Rent | -10% $-119 | -5% $-31 | +0% $57 | +5% $145 | +10% $233 |
| Rate | -1.0pp $203 | -0.5pp $131 | base $57 | +0.5pp $-18 | +1.0pp $-94 |
UW: 25.0% down · 7.5% · 30yr · 1.5% tax · 5.0% vac · 8.0% maint · 8.0% mgmt
Financing live
Cash to close
- Down payment
- $72,250
- Closing costs
- $8,670
- Reserves months
- —
- Total cash needed
- —
Loan-product check · same deal, 3 products live
Conventional
25% down · 7.5% · 30yr
- Down + closing
- —
- Monthly P&I
- —
- Monthly cashflow
- —
- DSCR
- —
- Eligible?
- —
Personal DTI + credit; lowest rate.
DSCR
20% down · 8.5% · 30yr
- Down + closing
- —
- Monthly P&I
- —
- Monthly cashflow
- —
- DSCR
- —
- Eligible?
- —
No personal income docs; deal must DSCR.
Hard money
10% down · 12.0% · 12mo
- Down + closing
- —
- Monthly P&I
- —
- Monthly cashflow
- —
- DSCR
- —
- Eligible?
- —
Short-term bridge; refi at stabilization.
Rent comps 11 comps
| Address | Beds | Baths | Sqft | Rent | $/sqft | DOM | Units | Dist |
|---|---|---|---|---|---|---|---|---|
| 146 Highland Ave Summerville, SC | 3.0 | 2.0 | 1073 | $2,500 | $2.33 | 25d | 1 | 0.13mi |
| 800 Sangaree Pkwy Summerville, SC | 2.0–3.0 | 2.0 | 1202 | $1,377 | $1.15 | 5d | 1 | 0.46mi |
| 801 Temple Rd Unit A Ladson, SC | 2.0 | 2.0 | 1025 | $1,400 | $1.37 | 13d | 1 | 0.55mi |
| 1000 Marlowe Vista Pl Summerville, SC | 1.0–3.0 | 1.0–3.5 | 1339 | $4,196 | $3.13 | 5d | 49 | 0.66mi |
| 2500 Gault Way Dr Summerville, SC | 2.0 | 1.0–2.0 | 913 | $1,928 | $2.11 | 5d | 21 | 1.01mi |
| 292 Pittsburg Lndg Summerville, SC | 2.0 | 2.0 | 850 | $1,450 | $1.71 | 25d | 1 | 1.04mi |
| 11000 Eagle Hall Ln Summerville, SC | 1.0–2.0 | 1.0–2.0 | 1066 | $2,090 | $1.96 | 5d | 7 | 1.24mi |
| 2601 N Main St Summerville, SC | 3.0 | 1.0–2.0 | 934 | $2,359 | $2.53 | 5d | 16 | 1.26mi |
| 1398 S University Dr Ladson, SC | 2.0 | 3.0 | 1063 | $1,715 | $1.61 | 25d | 1 | 1.32mi |
| 721 Emma Meredith Cir Summerville, SC | 1.0–3.0 | 1.0–2.0 | 925 | $1,612 | $1.74 | 5d | 12 | 1.34mi |
| 900 Brookstone Way Summerville, SC | 2.0 | 2.0 | 950 | $1,413 | $1.49 | 16d | 1 | 1.39mi |
Listing history 22 events
-
2026-06-21days on market $289,000 Active 34 DOM
-
2026-06-18days on market $289,000 Active 31 DOM
-
2026-06-17days on market $289,000 Active 30 DOM
-
2026-06-16days on market $289,000 Active 29 DOM
-
2026-06-15days on market $289,000 Active 28 DOM
-
2026-06-13days on market $289,000 Active 26 DOM
-
2026-06-13days on market $289,000 Active 25 DOM
-
2026-06-10pricedays on market $289,000 Active 23 DOM
-
2026-06-09days on market $295,000 Active 22 DOM
-
2026-06-08days on market $295,000 Active 21 DOM
-
2026-06-07days on market $295,000 Active 20 DOM
-
2026-06-05days on market $295,000 Active 17 DOM
-
2026-06-03days on market $295,000 Active 16 DOM
-
2026-06-03days on market $295,000 Active 15 DOM
-
2026-06-01days on market $295,000 Active 14 DOM
-
2026-05-31days on market $295,000 Active 13 DOM
-
2026-05-18$295,000 Active
-
2014-04-08soldstatus $50,000
-
2003-07-18soldstatus $56,900
-
2003-07-15soldstatus $53,350
-
2003-04-16$59,000
-
1994-09-13soldstatus $43,047
ⓘ Source: listings_history table (triggers on properties + properties_extension) + one-shot
backfill from property_details.listing_events for pre-trigger history.
Tax reassessment forecast SC · Resets to sale price
- Current annual tax
- $780 · $65/mo
- Projected year-2 tax
- $1,647 · $137/mo
- Expected delta
- +$867/yr (+$72/mo · 111.2%)
ⓘ Screening estimate from a state-policy table — verify with the county assessor before closing.
Climate risk First Street
- Flood 1/10 Low FEMA zone X (unshaded) · 0% chance over 30 yrs
- Wildfire 4/10 Moderate
- Heat 9/10 Extreme 7 d/yr ≥108°F today · 17 d/yr by 30 yrs out
- Wind 8/10 Severe 97% chance of damaging wind over 30 yrs
- Air quality 2/10 Low 2 unhealthy d/yr today · 2 by 30 yrs out
Nearby sold comps map
Loading sold comps map…
Walkable amenities ~0.75 mi
Loading nearby amenities…
Taxation est. · year 1
- Rental income
- $26,708
- − Mortgage interest
- −$16,188
- − Property taxes
- −$780
- − Insurance
- −$1,445
- − Repairs & maintenance
- −$2,137
- − Management
- −$2,137
- − Depreciation
- −$8,407
- Taxable loss
- −$4,386
- Est. tax savings @ 24.0%
- +$1,053
- After-tax cash flow
- $1,740/yr
For passive investors: Depreciation is non-cash, so a rental often shows a tax loss while cash-flowing — sheltering income. Rental losses are passive: they offset passive income freely, and up to $25,000/yr can offset ordinary (W-2) income if you actively participate and your MAGI is under $100k (phasing out to $0 by $150k); unused losses carry forward. On sale, claimed depreciation is recaptured at up to 25%, and gains may owe capital-gains tax (a 1031 exchange can defer both). Figures are a year-1 estimate at your 24.0% rate — not tax advice; consult a CPA.
Schools (NCES district)
- District
- Berkeley 01
- NCES district ID
- 4501170
- Math proficiency
- 35% ▼ -8.00%
- Reading proficiency
- 48% ▼ -2.00%
- Median HH income
- $52,724
- Composite
- 35.95/100
- National rank
- #4799
- State rank
- #30 of 80 in SC
Livability — Sangaree
- Score
- 63/100
- State rank
- #166
- US rank
- #15096
Category grades
Schools grade is shown separately in the Schools card above.
Census & demographics
- Census place
- Sangaree, SC
- County
- Berkeley County · 198,768 people
- Metro
- Charleston-North Charleston, SC
- Population (ZIP)
- 53,975
- Household income
- $89,578
- Rent vs Own
- Severe rent burden
- 1017.0
Population outlook (Berkeley County) Hauer SSP2
- Today (2025)
- 254,184 people
- By 2030
- 279,677 · +10.0%
- By 2040
- 329,379 · +29.6%
- By 2050
- 375,557 · +47.8%
- By 2075
- 476,740 · +87.6%
- By 2100
- 535,945 · +110.8%
Race, ethnicity, and origin ACS 2023
- Neighborhood character
- Diverse neighborhood (Simpson 0.56)
- Race & ethnicity
- White 62% Black 19% Two or more races 10% Hispanic / Latino 10% Asian 2%
- Hispanic origin (detail)
- Mexican 4% Puerto Rican 2%
- Common ancestry
- Lithuanian 4% Italian 2% Romanian 2%
- Foreign-born
- 5% · Canada, Jamaica
- Languages at home
- 91% English-only · Spanish 6% German/W. Germanic 1%
Political lean MEDSL · Berkeley
- 2024 margin
- R (+16.3) · D 41.1% · R 57.4% · Other 1.4%
- 2008→2024 swing
- -3.2pp toward R · 2008: -13.1pp · 2024: -16.3pp
- All cycles
- 2024: R+16.3 2020: R+11.7 2016: R+17.4 2012: R+18.9 2008: R+13.1
Not yet ingested
- Civics
- —
Market trends
- HPI YoY
- ▼ -52.74%
- Current HPI
- 285.0567
- Rent YoY
- ▲ 2.67%
- Metro
- Charleston-North Charleston, SC
- State GDP YoY
- ▲ 4.51%
- F500 in state
- 2
Industry mix (Fortune 500 HQ in SC)
| Industry | F500 HQs | Revenue |
|---|---|---|
| Packaging | 1 | $7B |
|
||
Price history
+585.3% since first listed6 events — show timeline
- 2026-05-18 Listed $295,000 Charleston Trident MLS
- 2014-04-08 Sold (Public Records) $50,000 Public Records
- 2003-07-18 Sold (Public Records) $56,900 Public Records
- 2003-07-15 Sold (MLS) $53,350 Charleston Trident MLS
- 2003-04-16 Listed $59,000 Charleston Trident MLS
- 1994-09-13 Sold (Public Records) $43,047 Public Records
Property tax history
+2.0%/yrLatest (2025): $780 · +4.6% YoY. Source: county tax records.
Cash-flow waterfall
monthlySold comps — $/sqft
last 12 mo · ≤1 miLoading sold comps…