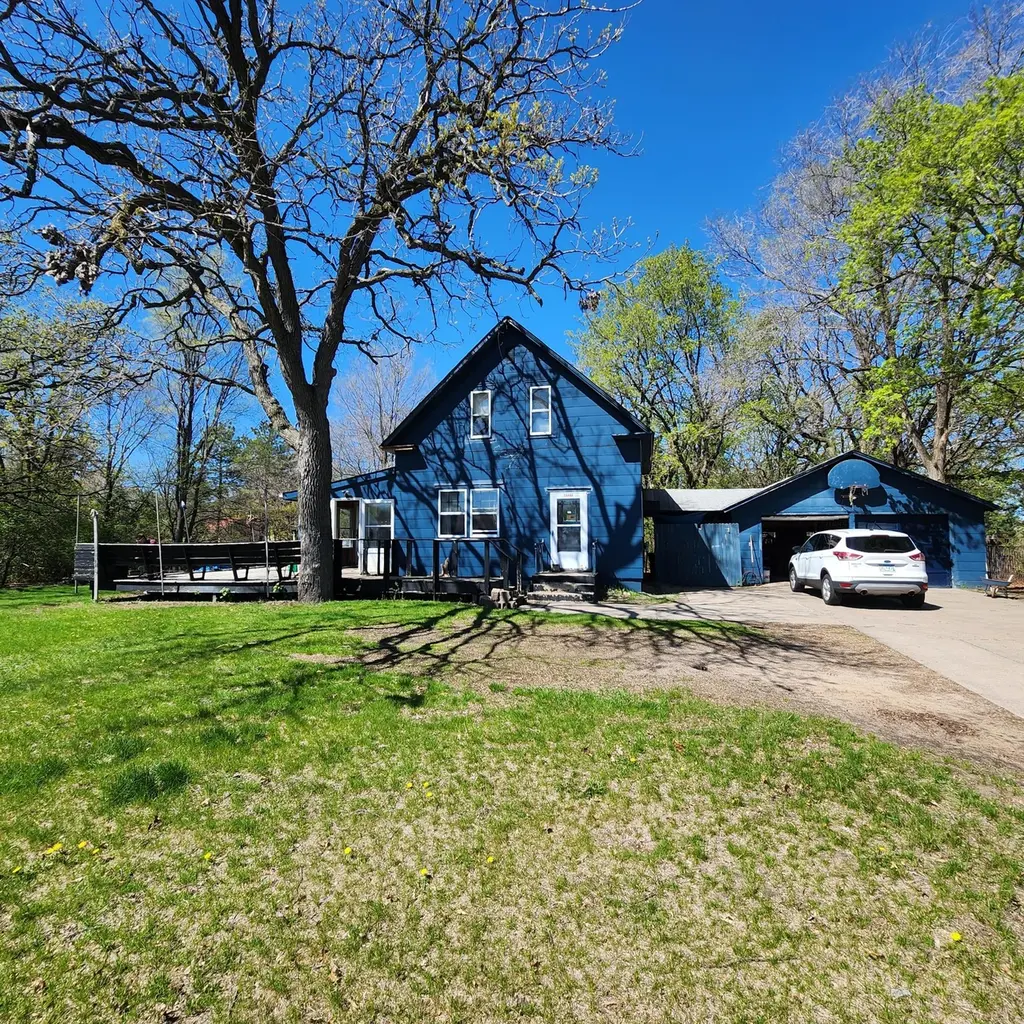
11444 Hanson Blvd NW · Coon Rapids, MN
Flood risk 1/10 · Minimal
- FEMA flood zone
- X (unshaded)
- Chance of flooding over 30 yrs
- 0.0%
- Est. flood insurance / yr
- $507 – $1,088
Fire risk 2/10 · Minimal
- Est. fire insurance / yr
- $888 – $1,650
Heat risk 2/10 · Minimal
- Hot days now (above 99°F)
- 7 days/yr
- Hot days in 30 yrs
- 14 days/yr
Wind risk 2/10 · Minimal
- Chance of severe wind over 30 yrs
- —
Air-quality risk 2/10 · Minimal
- Unhealthy air days now
- 2 days/yr
- Unhealthy air days in 30 yrs
- 2 days/yr
Risk factors via First Street. Map © Google.
Why this score? — see what drove the D grade
The composite is a weighted blend of 9 inputs, each scored 0–100. Each bar is that input's sub-score; the figure is the points it added to the 100-point composite (weight × sub-score).
- ARV discount +15.0/15.0
- Cash flow +8.3/30.0
- Schools +4.7/10.0
- Livability +4.3/5.0
- Rent growth +3.9/5.0
- Condition / age +2.5/5.0
- DSCR +2.3/10.0
- 1% rule +1.6/10.0
- Appreciation +0.0/10.0
$280,000
🖨 Deal sheet 📄 Offer letter ✓ Due diligence
Listing remarks
Nestled on a generous 1-acre wooded lot with a coveted commercial zoning, this charming 1940-built home presents a prime opportunity for future development. This residential home has original hardwood floors hidden beneath well-loved carpeting, the home is ripe for renovations that can unlock significant equity potential. Whether you're an investor or a buyer seeking a spacious homestead, this property offers endless possibilities. Its convenient location near the Hanson Blvd exit off Highway 10 ensures easy access to local amenities, including Cub Foods, shopping Coon Rapids Middle School and Highschool just a few steps away. Capitalize on this rare find that combines potential rental inco
Key facts
- 1.04 acre lot
- 2 garage spots
- Built 1940
Property features AI
Finance
- Other: Lot is approximately 1.04 acres (about 200 x 166); Above-grade finished area reported as 1,800; Living area reported as 1,800
Exterior
- Parking: 2-car garage; Concrete driveway
- Utilities: City water connected; City sewer connected; Natural gas
- Home design: Residential property; Two levels; Main level entry; Block foundation
- Construction: Block foundation area listed; Foundation area 1,245
- Exterior features: Wood exterior
Interior
- Bedrooms: 3 bedrooms
- Bathrooms: 1 full bathroom
- Heating & cooling: Forced air heating; No central air
- Interior features: Unfinished basement; Level topography
Neighborhood map
What this means for you Summary
Snapshot
- This is a 3-bed/1.0-bath single-family listed at $280k.
Deal economics
- At list price, monthly cash flow is $-256 ($-3k/yr) — negative.
- To cash-flow at today's rent, offer at most $235k (16.2% below list).
- To meet the 1% rule (rent ≥ 1% of price), the offer needs to be $186k (33.6% below list).
- Recommended offer: $186k (33.6% below list) — sets the bar for 1% rule.
- Cap rate 5.2% vs local median 3.8% in Coon Rapids — top-decile yield for the area; either an underpriced asset or a hidden risk that comps aren't pricing in. Stress-test before assuming the spread holds.
Location & tenants
- Location reads 86/100 on livability (#12 in MN, #390 nationally) — a professional / high-income tenant draw. Strengths: commute A+, employment A+, housing A+; Watch: amenities D.
- Anoka-Hennepin Public School District (suburban): math 49% / reading 55% proficiency, ranked #71 of 301 in MN (top 24%) — acceptable for families but not a draw, mixed tenant base, ~2y average lease.
- Market conditions: Rents rising fast (+5.4%/yr); 119 active listings in the ZIP; 8 comparable units currently listed for rent nearby; rentals at typical pace (median 18d on market — plan ~3-4 weeks tenant-placement turnaround); solid renter incomes; 1,083 units permitted in Anoka County in 2024 (134 in 5+ unit buildings).
Forward outlook
- Local home prices are declining (-3.0%/yr); year-one equity from $2k of loan paydown is wiped out by about $8k of value loss. Plan a longer hold.
- Anoka County population projected at +11% by 2050 — modest demand growth; plan on rents tracking national, not racing it.
Negotiation context
- It's been on market 41 days — a 3% lower offer ($272k) is reasonable based on typical stale-listing flexibility.
- 4 sale attempts since 31y ago; this cycle's ask has dropped $20k (7%) from the opening price — seller is motivated, your offer sets the floor, not the list.
Risks & watch-outs
- Watch-outs: built in 1940 — expect roof / HVAC / electrical / plumbing capex.
Questions for the listing agent
- What do current leases actually rent for vs. the listed asking? Can we see a recent rent roll and the last 12 months of T-12 income?
- It's been on market 41 days. Have you received any prior offers? Is the seller open to a 34% concession, seller financing, or rate buy-down credit?
- Built in 1940 — when were the roof, HVAC, electrical panel, plumbing, and water heater last replaced?
- Is there a deadline driving the sale (1031 exchange, divorce, estate, relocation)? That informs how much negotiation room exists.
- Schools are B-rated — typically a magnet for longer-tenancy family renters. What's the average tenant stay here, and is there a school-zone premium baked into asking?
- The area grade is low — what's the realistic commute time and amenity access for the typical tenant pool here? Any planned neighborhood developments (good or bad) we should know about?
- What's the average days-on-market for RENTAL listings here right now (not sales)? A rising rental-DOM trend means longer vacancies and softer asking-rent achievability than the comps imply.
- What's the recent tenant-quality profile in this submarket — average credit score on applications, eviction rate, late-payment / NSF rate, and stable-employment percentage? A property-management company in the area should have these aggregated.
- How much new for-sale + rental construction is in the pipeline within 1–3 miles? Heavy new supply typically softens prices + rents 12–24 months out; constrained supply supports both.
Investment metrics
- 1% rule
- 0.66% ✗
- Cap rate
- 5.20%
- Cash-on-cash
- -3.92%
- DSCR
- 0.83
- GRM
- 12.5
CMA / ARV
- ARV (median comp)
- $358,725
- List price
- $280,000
- Delta
- -21.95%
- Verdict
- UNDERPRICED
- Comps
- 7 within 2.0 mi
Projected returns pro-forma
-3.0% appreciation · 5.43% rent growth · sell at horizon
- IRR
- -20.6%
- Equity multiple
- 0.27×
- Total profit
- $-57,117
- Equity at exit
- $41,749
- IRR
- -9.7%
- Equity multiple
- 0.35×
- Total profit
- $-51,045
- Equity at exit
- $24,209
Cash invested: $78,400 (down + closing). Projections, not guarantees.
Landlord ↔ Tenant lean methodology
- Overall (STATE)
- 46 Balanced
- State Minnesota
- 46 Balanced · D+2
- County
- — inherits STATE
- City
- — inherits STATE
ZIP-level market 55433
- Rents YoY
- 5.4%
- Active inventory
- 119
- Price-to-rent
- 12.5×
Monthly cashflow live
- Estimated rent
- $1,860 high interval (Pro) →
- Mortgage (P&I)
- −$1,468
- Tax from tax record
- −$141 /mo · $1,688/yr
- Insurance
- −$117
- HOA
- −$0
- Vacancy / Maint / Mgmt
- −$391
- Net cashflow
- $-256
Break-even live
UW: 25.0% down · 7.5% · 30yr · 1.5% tax · 5.0% vac · 8.0% maint · 8.0% mgmt
Financing live
Cash to close
- Down payment
- $70,000
- Closing costs
- $8,400
- Reserves months
- —
- Total cash needed
- —
Loan-product check · same deal, 3 products live
Conventional
25% down · 7.5% · 30yr
- Down + closing
- —
- Monthly P&I
- —
- Monthly cashflow
- —
- DSCR
- —
- Eligible?
- —
Personal DTI + credit; lowest rate.
DSCR
20% down · 8.5% · 30yr
- Down + closing
- —
- Monthly P&I
- —
- Monthly cashflow
- —
- DSCR
- —
- Eligible?
- —
No personal income docs; deal must DSCR.
Hard money
10% down · 12.0% · 12mo
- Down + closing
- —
- Monthly P&I
- —
- Monthly cashflow
- —
- DSCR
- —
- Eligible?
- —
Short-term bridge; refi at stabilization.
Rent comps 8 comps
| Address | Beds | Baths | Sqft | Rent | $/sqft | DOM | Units | Dist |
|---|---|---|---|---|---|---|---|---|
| 11639 Raven St NW Coon Rapids, MN | 2.0–3.0 | 1.0–2.0 | 900 | $1,850 | $2.06 | 1d | 5 | 0.26mi |
| 11360 Robinson Dr Coon Rapids, MN | 1.0–3.0 | 1.0–2.0 | 1029 | $1,874 | $1.82 | 24d | 1 | 0.50mi |
| 1770 121st Ave NW Minneapolis, MN | 1.0–3.0 | 1.0–2.0 | 1075 | $2,120 | $1.97 | 1d | 11 | 0.67mi |
| 10701 Hanson Blvd NW Coon Rapids, MN | 1.0–2.0 | 1.0–2.0 | 824 | $1,330 | $1.61 | 4d | 1 | 1.06mi |
| 12114 Drake St NW Minneapolis, MN | 3.0 | 2.0 | 1460 | $1,895 | $1.30 | 43d | 1 | 1.06mi |
| 12186 Drake St NW Minneapolis, MN | 2.0 | 1.0 | 1100 | $1,695 | $1.54 | 43d | 1 | 1.12mi |
| 10400 Jay St NW Minneapolis, MN | 1.0–3.0 | 1.0–2.0 | 962 | $1,775 | $1.85 | 3d | 1 | 1.35mi |
| 1921 103rd Ave NW Apt 4 Minneapolis, MN | 2.0 | 1.0 | 750 | $1,425 | $1.90 | 17d | 1 | 1.48mi |
Listing history 22 events
-
2026-06-18days on market $280,000 Active 41 DOM
-
2026-06-17days on market $280,000 Active 40 DOM
-
2026-06-16days on market $280,000 Active 39 DOM
-
2026-06-15days on market $280,000 Active 38 DOM
-
2026-06-13days on market $280,000 Active 36 DOM
-
2026-06-13days on market $280,000 Active 35 DOM
-
2026-06-09days on market $280,000 Active 32 DOM
-
2026-06-08days on market $280,000 Active 31 DOM
-
2026-06-07days on market $280,000 Active 30 DOM
-
2026-06-04days on market $280,000 Active 27 DOM
-
2026-06-03days on market $280,000 Active 26 DOM
-
2026-06-02days on market $280,000 Active 25 DOM
-
2026-06-01days on market $280,000 Active 24 DOM
-
2026-05-31days on market $280,000 Active 23 DOM
-
2026-05-08$300,000 Active 758-char remark
-
2026-04-02historical
-
2024-05-18$340,000 Active
-
2024-05-03historical
-
2002-10-12historical
-
2000-10-12$220,000
-
2000-10-12historical
-
1995-01-11$220,000
ⓘ Source: listings_history table (triggers on properties + properties_extension) + one-shot
backfill from property_details.listing_events for pre-trigger history.
Tax reassessment forecast MN · Partial reset (capped growth)
- Current annual tax
- $1,688 · $141/mo
- Projected year-2 tax
- $2,412 · $201/mo
- Expected delta
- +$724/yr (+$60/mo · 42.9%)
ⓘ Screening estimate from a state-policy table — verify with the county assessor before closing.
Climate risk First Street
- Flood 1/10 Low FEMA zone X (unshaded) · 0% chance over 30 yrs
- Wildfire 2/10 Low
- Heat 2/10 Low 7 d/yr ≥99°F today · 14 d/yr by 30 yrs out
- Wind 2/10 Low
- Air quality 2/10 Low 2 unhealthy d/yr today · 2 by 30 yrs out
Nearby sold comps map
Loading sold comps map…
Walkable amenities ~0.75 mi
Loading nearby amenities…
Taxation est. · year 1
- Rental income
- $22,325
- − Mortgage interest
- −$15,684
- − Property taxes
- −$1,688
- − Insurance
- −$1,400
- − Repairs & maintenance
- −$1,786
- − Management
- −$1,786
- − Depreciation
- −$8,145
- Taxable loss
- −$8,165
- Est. tax savings @ 24.0%
- +$1,960
- After-tax cash flow
- $-1,112/yr
For passive investors: Depreciation is non-cash, so a rental often shows a tax loss while cash-flowing — sheltering income. Rental losses are passive: they offset passive income freely, and up to $25,000/yr can offset ordinary (W-2) income if you actively participate and your MAGI is under $100k (phasing out to $0 by $150k); unused losses carry forward. On sale, claimed depreciation is recaptured at up to 25%, and gains may owe capital-gains tax (a 1031 exchange can defer both). Figures are a year-1 estimate at your 24.0% rate — not tax advice; consult a CPA.
Schools (NCES district)
- District
- Anoka-Hennepin Public School District
- NCES district ID
- 2703180
- Math proficiency
- 49% ▼ -14.00%
- Reading proficiency
- 55% ▼ -10.00%
- Median HH income
- $73,837
- Composite
- 46.7/100
- National rank
- #2400
- State rank
- #71 of 301 in MN
Livability — Coon Rapids
- Score
- 86/100
- State rank
- #12
- US rank
- #390
Category grades
Schools grade is shown separately in the Schools card above.
Census & demographics
- Census place
- Coon Rapids, MN
- County
- Anoka County · 277,116 people
- City population
- 63,468
- Metro
- Minneapolis-St. Paul-Bloomington, MN-WI
- Population (ZIP)
- 34,463
- Household income
- $78,054
- Rent vs Own
- Severe rent burden
- 1129.0
Population outlook (Anoka County) Hauer SSP2
- Today (2025)
- 375,223 people
- By 2030
- 387,850 · +3.4%
- By 2040
- 407,239 · +8.5%
- By 2050
- 417,541 · +11.3%
- By 2075
- 448,447 · +19.5%
- By 2100
- 464,954 · +23.9%
Race, ethnicity, and origin ACS 2023
- Neighborhood character
- Predominantly White (70%)
- Race & ethnicity
- White 70% Black 9% Asian 9% Two or more races 9% Hispanic / Latino 5%
- Common ancestry
- Portuguese 12% Romanian 5% Italian 3%
- Foreign-born
- 9% · Canada, Vietnam
- Languages at home
- 90% English-only · Other Asian/Pacific 3% Spanish 2% Other Indo-European 1%
Political lean MEDSL · Anoka
- 2024 margin
- Toss-up / Even · D 46.6% · R 51.0% · Other 2.4%
- 2008→2024 swing
- -2.0pp toward R · 2008: -2.4pp · 2024: -4.4pp
- All cycles
- 2024: R+4.4 2020: R+1.9 2016: R+9.7 2012: R+2.6 2008: R+2.4
Not yet ingested
- Civics
- —
Market trends
- HPI YoY
- ▼ -243.93%
- Current HPI
- 260.1237
- Rent YoY
- ▲ 5.43%
- Metro
- Minneapolis-St. Paul-Bloomington, MN-WI
- State GDP YoY
- ▲ 2.41%
- F500 in state
- 34
Industry mix (Fortune 500 HQ in MN)
| Industry | F500 HQs | Revenue |
|---|---|---|
| Healthcare | 2 | $407B |
|
||
| Retail | 2 | $150B |
|
||
| Consumer Goods | 2 | $32B |
|
||
| Industrial Machinery | 2 | $6B |
|
||
| Agriculture | 1 | $40B |
|
||
| Healthcare / Medical Devices | 1 | $32B |
|
||
Price history
+27.3% since first listed10 events — show timeline
- 2026-05-29 Price Changed $280,000 NORTHSTARMLS as Distributed by MLS Grid
- 2026-05-22 Price Changed $295,000 NORTHSTARMLS as Distributed by MLS Grid
- 2026-05-08 Listed $300,000 NORTHSTARMLS as Distributed by MLS Grid
- 2026-04-02 Listing Removed — NORTHSTARMLS as Distributed by MLS Grid
- 2024-05-18 Listed $340,000 NORTHSTARMLS as Distributed by MLS Grid
- 2024-05-03 Coming Soon — NORTHSTARMLS as Distributed by MLS Grid
- 2002-10-12 Listing Removed — NORTHSTARMLS as Distributed by MLS Grid
- 2000-10-12 Listing Removed — NORTHSTARMLS as Distributed by MLS Grid
- 2000-10-12 Listed $220,000 NORTHSTARMLS as Distributed by MLS Grid
- 1995-01-11 Listed $220,000 NORTHSTARMLS as Distributed by MLS Grid
Property tax history
+0.7%/yrLatest (2026): $1,688 · +7.2% YoY. Source: county tax records.
Cash-flow waterfall
monthlySold comps — $/sqft
last 12 mo · ≤1 miLoading sold comps…