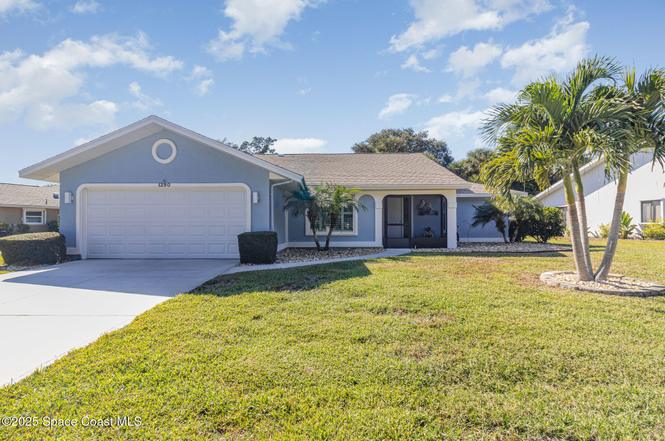
1290 Mayflower Ave · Viera East, FL
Flood risk 4/10 · Minor
- FEMA flood zone
- X (unshaded)
- Chance of flooding over 30 yrs
- 0.2%
- Est. flood insurance / yr
- $507 – $1,088
Fire risk 2/10 · Minimal
- Est. fire insurance / yr
- $947 – $1,759
Heat risk 10/10 · Severe
- Hot days now (above 104°F)
- 7 days/yr
- Hot days in 30 yrs
- 23 days/yr
Wind risk 10/10 · Severe
- Chance of severe wind over 30 yrs
- 99.0%
Air-quality risk 1/10 · Minimal
- Unhealthy air days now
- 0 days/yr
- Unhealthy air days in 30 yrs
- 0 days/yr
Risk factors via First Street. Map © Google.
Why this score? — see what drove the D grade
The composite is a weighted blend of 9 inputs, each scored 0–100. Each bar is that input's sub-score; the figure is the points it added to the 100-point composite (weight × sub-score).
- Cash flow +10.1/30.0
- ARV discount +7.5/15.0
- Appreciation +5.2/10.0
- Schools +4.7/10.0
- Livability +4.0/5.0
- Rent growth +3.0/5.0
- DSCR +2.9/10.0
- Condition / age +2.5/5.0
- 1% rule +1.8/10.0
$335,000
🖨 Deal sheet (PDF) 📄 Offer letter ✓ Due diligence
Listing remarks MLS
-
Key facts
- Water views
- Fitness center
- Screened porches
Tags
Property features AI
Finance
- Other: Unfurnished; Senior community
- HOA & community: Part of an association (Indian River Colony Club); Monthly association fees; Association amenities include clubhouse, fitness center, gated access, golf course, maintenance of grounds and structures, security, tennis and shuffleboard courts, RV/boat storage, park, cable TV, and other community facilities; Association fee includes cable TV, internet, grounds and structure maintenance, pest control, and other services
Exterior
- Parking: Attached 2-car garage
- Security: Gated community with guard
- Utilities: Public sewer; Water connected; Electricity connected; Cable connected
- Home design: Single-family residence; One story (entry level: 1); Faces east
- Construction: Frame and stucco construction; Shingle roof; Built on standard foundation
- Exterior features: Covered, screened rear porch; Storm shutters; Located on a golf course; Private asphalt road frontage
Interior
- Kitchen: Electric range; Microwave; Dishwasher; Refrigerator; Garbage disposal
- Bedrooms: 2 bedrooms
- Flooring: Tile
- Bathrooms: 2 full bathrooms
- Heating & cooling: Central heating (electric); Central air conditioning (electric)
- Interior features: Vaulted ceilings; Ceiling fan(s); Breakfast nook; Split bedroom floor plan; Primary bathroom with shower (no tub)
- Laundry & utility: In-unit washer and dryer
Neighborhood map
What this means for you Summary
Snapshot
- This is a 2-bed/2.0-bath single-family listed at $335k.
Deal economics
- At list price, monthly cash flow is $-195 ($-2k/yr) — negative.
- To cash-flow at today's rent, offer at most $301k (10.3% below list).
- To meet the 1% rule (rent ≥ 1% of price), the offer needs to be $228k (31.9% below list).
- Recommended offer: $228k (31.9% below list) — sets the bar for 1% rule.
Location & tenants
- Location reads 79/100 on livability (#141 in FL, #1,964 nationally) — a middle-class / working-renter tenant base. Strengths: crime A+, employment A+, housing A+; Watch: commute D+, amenities F.
- Brevard (suburban): math 53% / reading 57% proficiency, ranked #19 of 73 in FL (top 26%) — acceptable for families but not a draw, mixed tenant base, ~2y average lease.
- Zoned schools: Quest Elementary School (math 83% / reading 80%, grade A+, #90 of 2,144 statewide, top 4%, 691 students, 20% FRL); John F. Kennedy Middle School (math 67% / reading 59%, grade B+, #111 of 571 statewide, top 20%, 673 students, 41% FRL); Viera High School (math 58% / reading 71%, grade B-, #78 of 667 statewide, top 13%, 2,289 students, 15% FRL) — zoned schools average 25% FRL vs 43% district-wide (18 pts lower); this property's tenant base skews higher-income than the district average.
- Zoned-school proficiency averages 70% at this address vs 55% district-wide (+15 pts) — the actual schools serving this property are materially stronger than the Brevard average implies; a family-tenant draw the district grade alone would hide.
- Market conditions: Rents rising (+2.0%/yr); 593 active listings in the ZIP; 18 comparable units currently listed for rent nearby; rentals at typical pace (median 26d on market — plan ~3-4 weeks tenant-placement turnaround); high-income renter base; 4,602 units permitted in Brevard County in 2024 (702 in 5+ unit buildings).
Forward outlook
- In year one you build about $4k of equity ($2k loan paydown + $1k appreciation (0.4% local appreciation)).
- Brevard County population projected at +15% by 2050 — modest demand growth; plan on rents tracking national, not racing it.
- By year 8, paydown + projected appreciation supports a ~$33k cash-out refi (75% LTV) — recoverable capital for the next deal without selling this one.
Negotiation context
- It's been on market 215 days — a 12% lower offer ($295k) is reasonable based on typical stale-listing flexibility.
- 3 sale attempts since 14y ago; this cycle's ask has dropped $20k (6%) from the opening price — seller is motivated, your offer sets the floor, not the list.
- Current owner paid $79k; list at $335k implies a 324% gain — meaningful room to come down on a strong offer.
Risks & watch-outs
- Climate carrying-cost: severe wind risk, 99% chance of damaging wind over 30y; extreme-heat days projected 7→23/yr by 2055 (HVAC capex compounding) — expect insurance premiums to compound above CPI over the hold.
Questions for the listing agent
- What do current leases actually rent for vs. the listed asking? Can we see a recent rent roll and the last 12 months of T-12 income?
- It's been on market 215 days. Have you received any prior offers? Is the seller open to a 32% concession, seller financing, or rate buy-down credit?
- Why hasn't it sold? Are there any deal-killer items the seller is aware of (foundation, flood, title, zoning, code violations)?
- Is there a deadline driving the sale (1031 exchange, divorce, estate, relocation)? That informs how much negotiation room exists.
- Schools are F-rated, which usually means shorter tenancies and higher turnover. Who's the typical renter profile here, and what's been the actual vacancy rate?
- The area grade is low — what's the realistic commute time and amenity access for the typical tenant pool here? Any planned neighborhood developments (good or bad) we should know about?
- What's the average days-on-market for RENTAL listings here right now (not sales)? A rising rental-DOM trend means longer vacancies and softer asking-rent achievability than the comps imply.
- What's the recent tenant-quality profile in this submarket — average credit score on applications, eviction rate, late-payment / NSF rate, and stable-employment percentage? A property-management company in the area should have these aggregated.
- How much new for-sale + rental construction is in the pipeline within 1–3 miles? Heavy new supply typically softens prices + rents 12–24 months out; constrained supply supports both.
Investment metrics
- 1% rule
- 0.68% ✗
- Cap rate
- 5.59%
- Cash-on-cash
- -2.50%
- DSCR
- 0.89
- GRM
- 12.2
CMA / ARV
No comps found within radius.
Projected returns pro-forma
0.4% appreciation · 1.96% rent growth · sell at horizon
- IRR
- -4.1%
- Equity multiple
- 0.80×
- Total profit
- $-18,361
- Equity at exit
- $104,082
- IRR
- 0.9%
- Equity multiple
- 1.10×
- Total profit
- $9,154
- Equity at exit
- $130,683
Cash invested: $93,800 (down + closing). Projections, not guarantees.
Landlord ↔ Tenant lean methodology
- Overall (STATE)
- 87 Strongly Landlord-Friendly
- State Florida
- 87 Strongly Landlord-Friendly · R+3
- County
- — inherits STATE
- City
- — inherits STATE
ZIP-level market 32940
- Home prices YoY
- 0.1%
- Rents YoY
- 2.0%
- Active inventory
- 593
- Price-to-rent
- 12.2×
Monthly cashflow live
- Estimated rent
- $2,282 high interval (Pro) →
- Mortgage (P&I)
- −$1,757
- Tax from tax record
- −$101 /mo · $1,217/yr
- Insurance
- −$140
- HOA
- −$0
- Vacancy / Maint / Mgmt
- −$479
- Net cashflow
- $-195
Break-even live
Sensitivity live
| Price | -10% $-6 | -5% $-100 | +0% $-195 | +5% $-290 | +10% $-385 |
|---|---|---|---|---|---|
| Rent | -10% $-376 | -5% $-285 | +0% $-195 | +5% $-105 | +10% $-15 |
| Rate | -1.0pp $-27 | -0.5pp $-110 | base $-195 | +0.5pp $-282 | +1.0pp $-370 |
UW: 25.0% down · 7.5% · 30yr · 1.5% tax · 5.0% vac · 8.0% maint · 8.0% mgmt
Financing live
Cash to close
- Down payment
- $83,750
- Closing costs
- $10,050
- Reserves months
- —
- Total cash needed
- —
Loan-product check · same deal, 3 products live
Conventional
25% down · 7.5% · 30yr
- Down + closing
- —
- Monthly P&I
- —
- Monthly cashflow
- —
- DSCR
- —
- Eligible?
- —
Personal DTI + credit; lowest rate.
DSCR
20% down · 8.5% · 30yr
- Down + closing
- —
- Monthly P&I
- —
- Monthly cashflow
- —
- DSCR
- —
- Eligible?
- —
No personal income docs; deal must DSCR.
Hard money
10% down · 12.0% · 12mo
- Down + closing
- —
- Monthly P&I
- —
- Monthly cashflow
- —
- DSCR
- —
- Eligible?
- —
Short-term bridge; refi at stabilization.
Rent comps 18 comps
| Address | Beds | Baths | Sqft | Rent | $/sqft | DOM | Units | Dist |
|---|---|---|---|---|---|---|---|---|
| 1914 Jacques Dr Melbourne, FL | 3.0 | 2.0 | 1575 | $3,400 | $2.16 | 25d | 1 | 0.96mi |
| 5693 Star Rush Dr #207 Melbourne, FL | 2.0 | 2.0 | 1139 | $1,695 | $1.49 | 25d | 1 | 0.97mi |
| 1385 Fuji Dr Melbourne, FL | 3.0 | 2.0 | 1770 | $3,000 | $1.69 | 25d | 1 | 0.98mi |
| 915 Starling Way Rockledge, FL | 3.0 | 2.0 | 2202 | $3,495 | $1.59 | 21d | 1 | 0.99mi |
| 1747 Sophias Dr #202 Melbourne, FL | 3.0 | 2.0 | 1278 | $2,200 | $1.72 | 16d | 1 | 1.02mi |
| 1747 Sophias Dr Melbourne, FL | 2.0–3.0 | 2.0 | 1149 | $1,850 | $1.61 | 25d | 2 | 1.02mi |
| 1622 Laramie Cir Melbourne, FL | 3.0 | 2.0 | 1390 | $2,600 | $1.87 | 16d | 1 | 1.10mi |
| 2185 Judge Fran Jamieson Way Melbourne, FL | 1.0–3.0 | 1.0–2.0 | 1192 | $2,008 | $1.68 | 15d | 17 | 1.24mi |
| 2061 Tiburon Ln Melbourne, FL | 3.0 | 2.0 | 1506 | $2,350 | $1.56 | 25d | 1 | 1.27mi |
| 6411 Borasco Dr Melbourne, FL | 2.0–3.0 | 2.0 | 1258 | $1,700 | $1.35 | 25d | 1 | 1.33mi |
| 1703 Mission Bay Cir Rockledge, FL | 1.0–3.0 | 1.0–2.0 | 927 | $1,258 | $1.36 | 15d | 12 | 1.36mi |
| 6431 Borasco Dr Melbourne, FL | 1.0–2.0 | 1.0–2.0 | 869 | $1,950 | $2.24 | 21d | 2 | 1.36mi |
| 531 Steeplechase Ln Melbourne, FL | 2.0 | 1.5 | 1110 | $1,875 | $1.69 | 25d | 1 | 1.37mi |
| 1306 Hampton Park Ln Melbourne, FL | 2.0 | 3.0 | 1110 | $1,700 | $1.53 | 16d | 1 | 1.37mi |
| 1390 Hampton Park Ln Melbourne, FL | 2.0 | 2.5 | 1110 | $1,900 | $1.71 | 25d | 1 | 1.39mi |
| 1311 Hampton Park Ln Melbourne, FL | 2.0 | 3.0 | 1110 | $1,850 | $1.67 | 25d | 1 | 1.39mi |
| 2301 Willet Pl Melbourne, FL | 1.0–3.0 | 1.0–2.0 | 1109 | $2,602 | $2.35 | 15d | 27 | 1.46mi |
| 300 Tuscany Way Melbourne, FL | 1.0–3.0 | 1.0–2.0 | 1097 | $1,984 | $1.81 | 25d | 12 | 1.47mi |
Listing history 26 events
-
2026-06-22days on market $335,000 Active 215 DOM
-
2026-06-18days on market $335,000 Active 212 DOM
-
2026-06-17days on market $335,000 Active 211 DOM
-
2026-06-16days on market $335,000 Active 210 DOM
-
2026-06-15days on market $335,000 Active 209 DOM
-
2026-06-14days on market $335,000 Active 207 DOM
-
2026-06-10days on market $335,000 Active 204 DOM
-
2026-06-08days on market $335,000 Active 202 DOM
-
2026-06-07days on market $335,000 Active 201 DOM
-
2026-06-05days on market $335,000 Active 198 DOM
-
2026-06-03days on market $335,000 Active 197 DOM
-
2026-06-02days on market $335,000 Active 196 DOM
-
2026-06-01days on market $335,000 Active 195 DOM
-
2026-05-31days on market $335,000 Active 194 DOM
-
2026-05-31days on market $335,000 Active 193 DOM
-
2026-05-13price $335,000
-
2025-11-17$355,000 Active
-
2016-08-16historical 1-char remark
Show marketing remark (1 chars)
-
-
2013-01-03soldstatus $79,000
-
2012-12-11soldstatus $79,000 467-char remark
Show marketing remark (467 chars)
Split floor plan and interior laundry in this Bangor model. Portable island in kitchen that has 2 suntunnels and oak cabinets. Covered porch with wooded view of lake and golf course. Walk-in shower in Master bedroom. Pet-friendly community, shuffleboard, tennis courts, fitness center, heated swimming pool, full dining facilities with executive chef. Gated community that has you feeling you are always on vacation with incredible home maintenance program. Must see!
-
2012-06-27$97,900 467-char remark
Show marketing remark (467 chars)
Split floor plan and interior laundry in this Bangor model. Portable island in kitchen that has 2 suntunnels and oak cabinets. Covered porch with wooded view of lake and golf course. Walk-in shower in Master bedroom. Pet-friendly community, shuffleboard, tennis courts, fitness center, heated swimming pool, full dining facilities with executive chef. Gated community that has you feeling you are always on vacation with incredible home maintenance program. Must see!
-
2012-02-15$97,900 1-char remark
Show marketing remark (1 chars)
-
-
2001-05-21soldstatus $113,000
-
1993-02-08soldstatus $108,900
-
1991-03-01soldstatus $96,800
-
1989-02-01soldstatus $87,800
ⓘ Source: listings_history table (triggers on properties + properties_extension) + one-shot
backfill from property_details.listing_events for pre-trigger history.
Tax reassessment forecast FL · Resets to sale price
- Current annual tax
- $1,217 · $101/mo
- Projected year-2 tax
- $2,780 · $232/mo
- Expected delta
- +$1,563/yr (+$130/mo · 128.4%)
ⓘ Screening estimate from a state-policy table — verify with the county assessor before closing.
Climate risk First Street
- Flood 4/10 Moderate FEMA zone X (unshaded) · 20% chance over 30 yrs
- Wildfire 2/10 Low
- Heat 10/10 Extreme 7 d/yr ≥104°F today · 23 d/yr by 30 yrs out
- Wind 10/10 Extreme 99% chance of damaging wind over 30 yrs
- Air quality 1/10 Low 0 unhealthy d/yr today · 0 by 30 yrs out
Nearby sold comps map
Loading sold comps map…
Walkable amenities ~0.75 mi
Loading nearby amenities…
Taxation est. · year 1
- Rental income
- $27,380
- − Mortgage interest
- −$18,765
- − Property taxes
- −$1,217
- − Insurance
- −$1,675
- − Repairs & maintenance
- −$2,190
- − Management
- −$2,190
- − Depreciation
- −$9,745
- Taxable loss
- −$8,404
- Est. tax savings @ 24.0%
- +$2,017
- After-tax cash flow
- $-326/yr
For passive investors: Depreciation is non-cash, so a rental often shows a tax loss while cash-flowing — sheltering income. Rental losses are passive: they offset passive income freely, and up to $25,000/yr can offset ordinary (W-2) income if you actively participate and your MAGI is under $100k (phasing out to $0 by $150k); unused losses carry forward. On sale, claimed depreciation is recaptured at up to 25%, and gains may owe capital-gains tax (a 1031 exchange can defer both). Figures are a year-1 estimate at your 24.0% rate — not tax advice; consult a CPA.
Schools (NCES district)
- District
- Brevard
- NCES district ID
- 1200150
- Math proficiency
- 53% ▼ -9.00%
- Reading proficiency
- 57% ▼ -4.00%
- Median HH income
- $49,426
- Composite
- 46.86/100
- National rank
- #2370
- State rank
- #19 of 73 in FL
Livability — Viera East
- Score
- 79/100
- State rank
- #141
- US rank
- #1964
Category grades
Schools grade is shown separately in the Schools card above.
Census & demographics
- Census place
- Viera East, FL
- County
- Brevard County · 602,871 people
- Metro
- Palm Bay-Melbourne-Titusville, FL
- Population (ZIP)
- 51,727
- Household income
- $110,495
- Rent vs Own
- Severe rent burden
- 873.0
Population outlook (Brevard County) Hauer SSP2
- Today (2025)
- 623,254 people
- By 2030
- 648,420 · +4.0%
- By 2040
- 690,009 · +10.7%
- By 2050
- 715,669 · +14.8%
- By 2075
- 775,744 · +24.5%
- By 2100
- 776,687 · +24.6%
Race, ethnicity, and origin ACS 2023
- Neighborhood character
- Predominantly White (77%)
- Race & ethnicity
- White 77% Hispanic / Latino 10% Two or more races 9% Asian 5% Black 3%
- Hispanic origin (detail)
- Mexican 1% Puerto Rican 3% Cuban 1%
- Common ancestry
- Romanian 4% Lithuanian 3% Slovak 2%
- Foreign-born
- 11% · Canada, Jamaica, China
- Languages at home
- 88% English-only · Spanish 6% Other Indo-European 2% German/W. Germanic 1%
Political lean MEDSL · Brevard
- 2024 margin
- Strong R (+20.8) · D 39.1% · R 59.9% · Other 1.0%
- 2008→2024 swing
- -10.4pp toward R · 2008: -10.4pp · 2024: -20.8pp
- All cycles
- 2024: R+20.8 2020: R+16.4 2016: R+19.8 2012: R+12.7 2008: R+10.4
Not yet ingested
- Civics
- —
Market trends
- HPI YoY
- ▲ 0.40%
- Current HPI
- 298.1023
- Rent YoY
- ▲ 1.96%
- Metro
- Palm Bay-Melbourne-Titusville, FL
- State GDP YoY
- ▲ 3.28%
- F500 in state
- 36
Industry mix (Fortune 500 HQ in FL)
| Industry | F500 HQs | Revenue |
|---|---|---|
| Industrial Technology | 2 | $29B |
|
||
| Insurance | 2 | $17B |
|
||
| Retail | 1 | $60B |
|
||
| Technology Distribution | 1 | $58B |
|
||
| Homebuilding | 1 | $35B |
|
||
| Technology Manufacturing | 1 | $35B |
|
||
Price history
+281.5% since first listed11 events — show timeline
- 2026-05-13 Price Changed $335,000 SCMLS
- 2025-11-17 Listed $355,000 SCMLS
- 2016-08-16 Listing Removed — SCMLS
- 2013-01-03 Sold (Public Records) $79,000 Public Records
- 2012-12-11 Sold (MLS) $79,000 SCMLS
- 2012-06-27 Listed $97,900 SCMLS
- 2012-02-15 Listed $97,900 SCMLS
- 2001-05-21 Sold (Public Records) $113,000 Public Records
- 1993-02-08 Sold (Public Records) $108,900 Public Records
- 1991-03-01 Sold (Public Records) $96,800 Public Records
- 1989-02-01 Sold (Public Records) $87,800 Public Records
Property tax history
+3.0%/yrLatest (2025): $1,217 · +12.8% YoY. Source: county tax records.
Cash-flow waterfall
monthlySold comps — $/sqft
last 12 mo · ≤1 miLoading sold comps…