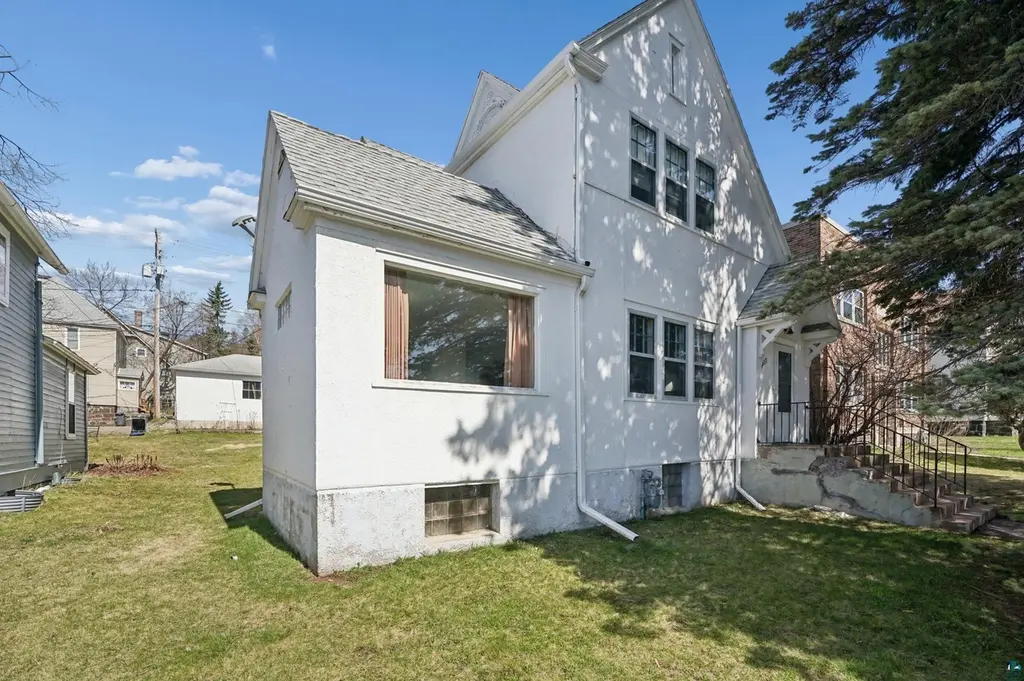
 Duplex
1407 E 3rd St · Duluth, MN
Flood risk 4/10 · Minor
- FEMA flood zone
- X
- Chance of flooding over 30 yrs
- 0.22%
- Est. flood insurance / yr
- $473 – $860
Fire risk 1/10 · Minimal
- Est. fire insurance / yr
- $888 – $1,650
Heat risk 1/10 · Minimal
- Hot days now (above 90°F)
- 7 days/yr
- Hot days in 30 yrs
- 12 days/yr
Wind risk 1/10 · Minimal
- Chance of severe wind over 30 yrs
- —
Air-quality risk 2/10 · Minimal
- Unhealthy air days now
- 0 days/yr
- Unhealthy air days in 30 yrs
- 1 days/yr
Risk factors via First Street. Map © Google.
Why this score? — see what drove the C- grade
The composite is a weighted blend of 9 inputs, each scored 0–100. Each bar is that input's sub-score; the figure is the points it added to the 100-point composite (weight × sub-score).
- Cash flow +24.3/30.0
- DSCR +7.8/10.0
- 1% rule +6.4/10.0
- Schools +4.2/10.0
- Livability +4.1/5.0
- Rent growth +2.5/5.0
- Condition / age +2.5/5.0
- ARV discount +0.0/15.0
- Appreciation +0.0/10.0
$289,900
🖨 Deal sheet 📄 Offer letter ✓ Due diligence
Multi-family units
County records classify this as Multi-Family (2-4 Unit). Listing-text estimate: 2 units. confirmed
Listing remarks MLS
Well maintained Duplex with new roof and updated mechanicals including waste & water lines, boiler, and water-heater. Great view of Lake Superior from the sun room. Near public transportation. Long term renters in both upper and lower units, leases expire May 1, 2022.
Key facts
- Newer roof
- Updated furnace
- Off-street parking
Tags
Property features AI
Finance
- Financial info: Unit rents: $950 for the 1-bedroom unit; $1,400 for the 3-bedroom unit
Exterior
- Parking: Detached garage; 3 garage spaces; Concrete parking and off-street parking
- Utilities: Public water; Public sewer
- Home design: Duplex (residential income); 2 stories
- Construction: Stucco construction; Stone foundation
- Exterior features: Rubber, asphalt, and shingle roof; 50 x 140 lot; 0.16-acre lot
Interior
- Bedrooms: One-unit: 1 bedroom; Second unit: 3 bedrooms
- Bathrooms: One-unit: 1 bathroom; Second unit: 1 bathroom
- Heating & cooling: Baseboard heating; Forced air heating; Natural gas and electric heating
- Interior features: Full basement; Basement laundry (in basement); Has view
- Laundry & utility: Laundry located in basement
Neighborhood map
What this means for you Summary
Snapshot
- This is a 2 × 2-bed/1.0-bath units multifamily listed at $290k.
Deal economics
- At list price, monthly cash flow is $583 ($7k/yr) — positive. Per door: $292/mo.
- The deal already cash-flows at list — no discount required.
- Meets the 1% rule at list price ($3k rent vs $290k).
- Cap rate 8.7% vs local median 4.9% in Duluth — top-decile yield for the area; either an underpriced asset or a hidden risk that comps aren't pricing in. Stress-test before assuming the spread holds.
Location & tenants
- Location reads 82/100 on livability (#36 in MN, #1,060 nationally) — a professional / high-income tenant draw. Strengths: commute A+, cost of living A+, housing A+; Watch: amenities F.
- Duluth Public School District (urban): math 44% / reading 55% proficiency, ranked #132 of 301 in MN (top 44%) — families likely to look elsewhere, expect single-tenant / working-renter base with shorter leases.
- Market conditions: 99 active listings in the ZIP; 5 comparable units currently listed for rent nearby; rentals leasing fast (median 13d on market — plan ~1-2 weeks tenant-placement turnaround); 639 units permitted in St. Louis County in 2024 (338 in 5+ unit buildings).
Forward outlook
- Local home prices are declining (-3.0%/yr); year-one equity from $2k of loan paydown is wiped out by about $9k of value loss. Plan a longer hold.
Negotiation context
- Only 4 days on market — expect competitive offers; lowballing is unlikely to land.
- 2 sale attempts since 5y ago with the ask held roughly flat each time — persistent listings suggest the price (not the market) is what's stuck; bring a comps-based counter.
Risks & watch-outs
- Watch-outs: built in 1886 — expect roof / HVAC / electrical / plumbing capex.
Questions for the listing agent
- Can we see the unit-by-unit rent roll, current vacancy, and any below-market leases? What's the average tenancy length?
- What capital expenditures (roof, boiler, parking lot, exteriors) have been made in the last 5 years, and what's planned in the next 2?
- Built in 1886 — when were the roof, HVAC, electrical panel, plumbing, and water heater last replaced?
- Is there a deadline driving the sale (1031 exchange, divorce, estate, relocation)? That informs how much negotiation room exists.
- Schools are B-rated — typically a magnet for longer-tenancy family renters. What's the average tenant stay here, and is there a school-zone premium baked into asking?
- What's the average days-on-market for RENTAL listings here right now (not sales)? A rising rental-DOM trend means longer vacancies and softer asking-rent achievability than the comps imply.
- What's the recent tenant-quality profile in this submarket — average credit score on applications, eviction rate, late-payment / NSF rate, and stable-employment percentage? A property-management company in the area should have these aggregated.
- How much new apartment / multifamily construction is in the pipeline within 1–3 miles? Heavy new supply (>2% of stock underway) typically softens rents 12–24 months out; light construction supports rent growth.
Investment metrics
- 1% rule
- 1.14% ✓
- Cap rate
- 8.71%
- Cash-on-cash
- 8.62%
- DSCR
- 1.38
- GRM
- 7.3
CMA / ARV
- ARV (median comp)
- $239,707
- List price
- $289,900
- Delta
- 20.94%
- Verdict
- OVERPRICED
- Comps
- 20 within 1.0 mi
Show comp detail 4 sales within ~0.75 mi
| Address | Dist | Beds/Ba | Sqft | Sold | Price | $/sf | Match |
|---|---|---|---|---|---|---|---|
| 1612 E 6th St | 0.26mi | 4/4.0 | 2,412 (+2%) | 1mo | $240,000 | $100 | 75 |
| 1319 E 3rd St | 0.06mi | 4/4.0 | 2,551 (+8%) | 18mo | $388,000 | $152 | 61 |
| 421 N 18th Ave Ave E | 0.33mi | 3/3.0 (-1) | 2,276 (-4%) | 13mo | $320,000 | $141 | 58 |
| 705 E 6th St | 0.65mi | 4/3.0 | 2,464 (+4%) | 9mo | $195,250 | $79 | 51 |
Match score weights: distance 35% · size 25% · config 20% · recency 20%. Top-matched comps best support the ARV.
Projected returns pro-forma
-3.0% appreciation · 3.0% rent growth · sell at horizon
- IRR
- -3.2%
- Equity multiple
- 0.88×
- Total profit
- $-9,777
- Equity at exit
- $43,225
- IRR
- 6.5%
- Equity multiple
- 1.49×
- Total profit
- $39,574
- Equity at exit
- $25,065
Cash invested: $81,172 (down + closing). Projections, not guarantees.
Landlord ↔ Tenant lean methodology
- Overall (STATE)
- 46 Balanced
- State Minnesota
- 46 Balanced · D+2
- County
- — inherits STATE
- City
- — inherits STATE
ZIP-level market 55804
- Active inventory
- 99
- Price-to-rent
- 14.6×
Monthly cashflow live
- Estimated rent
- $3,310 high interval (Pro) →
- Mortgage (P&I)
- −$1,520
- Tax from tax record
- −$391 /mo · $4,690/yr
- Insurance
- −$121
- HOA
- −$0
- Vacancy / Maint / Mgmt
- −$695
- Net cashflow
- $583
Break-even live
2-unit breakdown (identical units grouped — click to expand)
| Units | Beds | Baths | Est. rent |
|---|---|---|---|
| 2× units | 2 | 1 | $3,310 |
| #1 | 2 | 1 | $1,655 |
| #2 | 2 | 1 | $1,655 |
| Total (2 units) | $3,310 | ||
UW: 25.0% down · 7.5% · 30yr · 1.5% tax · 5.0% vac · 8.0% maint · 8.0% mgmt
Financing live
Cash to close
- Down payment
- $72,475
- Closing costs
- $8,697
- Reserves months
- —
- Total cash needed
- —
Loan-product check · same deal, 3 products live
Conventional
25% down · 7.5% · 30yr
- Down + closing
- —
- Monthly P&I
- —
- Monthly cashflow
- —
- DSCR
- —
- Eligible?
- —
Personal DTI + credit; lowest rate.
DSCR
20% down · 8.5% · 30yr
- Down + closing
- —
- Monthly P&I
- —
- Monthly cashflow
- —
- DSCR
- —
- Eligible?
- —
No personal income docs; deal must DSCR.
Hard money
10% down · 12.0% · 12mo
- Down + closing
- —
- Monthly P&I
- —
- Monthly cashflow
- —
- DSCR
- —
- Eligible?
- —
Short-term bridge; refi at stabilization.
Rent comps 5 comps
| Address | Beds | Baths | Sqft | Rent | $/sqft | DOM | Units | Dist |
|---|---|---|---|---|---|---|---|---|
| 1821 E 1st St Duluth, MN | 5.0 | 2.0 | 1662 | $2,300 | $1.38 | 13d | 1 | 0.40mi |
| 414 N 19th Ave E Duluth, MN | 4.0 | 1.0 | 1900 | $2,295 | $1.21 | 13d | 1 | 0.42mi |
| 202 S 18th Ave E Duluth, MN | 5.0 | 2.5 | 2372 | $2,495 | $1.05 | 13d | 1 | 0.48mi |
| 2125 E Superior St Unit 3 Duluth, MN | 4.0 | 1.0 | 1622 | $1,850 | $1.14 | 13d | 1 | 0.69mi |
| 609 E 6th St Duluth, MN | 5.0 | 2.0 | 1850 | $1,795 | $0.97 | 21d | 1 | 0.74mi |
Listing history 5 events
-
2026-05-09status Pending 931-char remark
-
2026-05-04$289,900 Active 931-char remark
-
2021-10-12soldstatus $225,000
-
2021-09-30soldstatus $225,000 274-char remark
Show marketing remark (274 chars)
Well maintained Duplex with new roof and updated mechanicals including waste & water lines, boiler, and water-heater. Great view of Lake Superior from the sun room. Near public transportation. Long term renters in both upper and lower units, leases expire May 1, 2022.
-
2021-05-05$239,900 274-char remark
Show marketing remark (274 chars)
Well maintained Duplex with new roof and updated mechanicals including waste & water lines, boiler, and water-heater. Great view of Lake Superior from the sun room. Near public transportation. Long term renters in both upper and lower units, leases expire May 1, 2022.
ⓘ Source: listings_history table (triggers on properties + properties_extension) + one-shot
backfill from property_details.listing_events for pre-trigger history.
Tax reassessment forecast MN · Partial reset (capped growth)
- Current annual tax
- $4,690 · $391/mo
- Projected year-2 tax
- $4,690 · $391/mo
- Expected delta
- $0/yr ($0/mo · 0.0%)
ⓘ Screening estimate from a state-policy table — verify with the county assessor before closing.
Climate risk First Street
- Flood 4/10 Moderate FEMA zone X · 22% chance over 30 yrs
- Wildfire 1/10 Low
- Heat 1/10 Low 7 d/yr ≥90°F today · 12 d/yr by 30 yrs out
- Wind 1/10 Low
- Air quality 2/10 Low 0 unhealthy d/yr today · 1 by 30 yrs out
Nearby sold comps map
Loading sold comps map…
Walkable amenities ~0.75 mi
Loading nearby amenities…
Taxation est. · year 1
- Rental income
- $39,720
- − Mortgage interest
- −$16,239
- − Property taxes
- −$4,690
- − Insurance
- −$1,450
- − Repairs & maintenance
- −$3,178
- − Management
- −$3,178
- − Depreciation
- −$8,433
- Taxable income
- $2,553
- Est. tax owed @ 24.0%
- −$613
- After-tax cash flow
- $6,383/yr
For passive investors: Depreciation is non-cash, so a rental often shows a tax loss while cash-flowing — sheltering income. Rental losses are passive: they offset passive income freely, and up to $25,000/yr can offset ordinary (W-2) income if you actively participate and your MAGI is under $100k (phasing out to $0 by $150k); unused losses carry forward. On sale, claimed depreciation is recaptured at up to 25%, and gains may owe capital-gains tax (a 1031 exchange can defer both). Figures are a year-1 estimate at your 24.0% rate — not tax advice; consult a CPA.
Schools (NCES district)
- District
- Duluth Public School District
- NCES district ID
- 2711040
- Math proficiency
- 44% ▼ -10.00%
- Reading proficiency
- 55% ▼ -6.00%
- Median HH income
- $45,692
- Composite
- 41.92/100
- National rank
- #3360
- State rank
- #132 of 301 in MN
Livability — Duluth
- Score
- 82/100
- State rank
- #36
- US rank
- #1060
Category grades
Schools grade is shown separately in the Schools card above.
Census & demographics
- Census place
- Duluth, MN
- City population
- 71,097
- Population (ZIP)
- 16,018
Population outlook (St. Louis County) Hauer SSP2
- Today (2025)
- 202,411 people
- By 2030
- 203,234 · +0.4%
- By 2040
- 202,520 · +0.1%
- By 2050
- 200,853 · -0.8%
- By 2075
- 200,943 · -0.7%
- By 2100
- 192,058 · -5.1%
Race, ethnicity, and origin ACS 2023
- Neighborhood character
- Predominantly White (92%)
- Race & ethnicity
- White 92% Two or more races 5% Hispanic / Latino 1% Asian 1%
- Common ancestry
- Portuguese 14% Scottish 4% Romanian 4%
- Foreign-born
- 3% · Canada
- Languages at home
- 96% English-only · Spanish 1%
Political lean MEDSL · St. Louis
- 2024 margin
- D (+13.7) · D 55.9% · R 42.2% · Other 1.8%
- 2008→2024 swing
- -18.8pp toward R · 2008: 32.5pp · 2024: 13.7pp
- All cycles
- 2024: D+13.7 2020: D+15.6 2016: D+11.8 2012: D+29.6 2008: D+32.5
Not yet ingested
- Civics
- —
Market trends
- HPI YoY
- ▼ -253.94%
- Current HPI
- 199.4064
- Rent YoY
- —
- Metro
- —
- State GDP YoY
- ▲ 2.41%
- F500 in state
- 34
Industry mix (Fortune 500 HQ in MN)
| Industry | F500 HQs | Revenue |
|---|---|---|
| Healthcare | 2 | $407B |
|
||
| Retail | 2 | $150B |
|
||
| Consumer Goods | 2 | $32B |
|
||
| Industrial Machinery | 2 | $6B |
|
||
| Agriculture | 1 | $40B |
|
||
| Healthcare / Medical Devices | 1 | $32B |
|
||
Price history
+20.9% since first listed6 events — show timeline
- 2026-06-12 Sold (MLS) $290,000 LSAR
- 2026-05-09 Pending — LSAR
- 2026-05-04 Listed $289,900 LSAR
- 2021-10-12 Sold (Public Records) $225,000 Public Records
- 2021-09-30 Sold (MLS) $225,000 LSAR
- 2021-05-05 Listed $239,900 LSAR
Property tax history
+7.8%/yrLatest (2026): $4,690 · +8.8% YoY. Source: county tax records.
Cash-flow waterfall
monthlySold comps — $/sqft
last 12 mo · ≤1 miLoading sold comps…