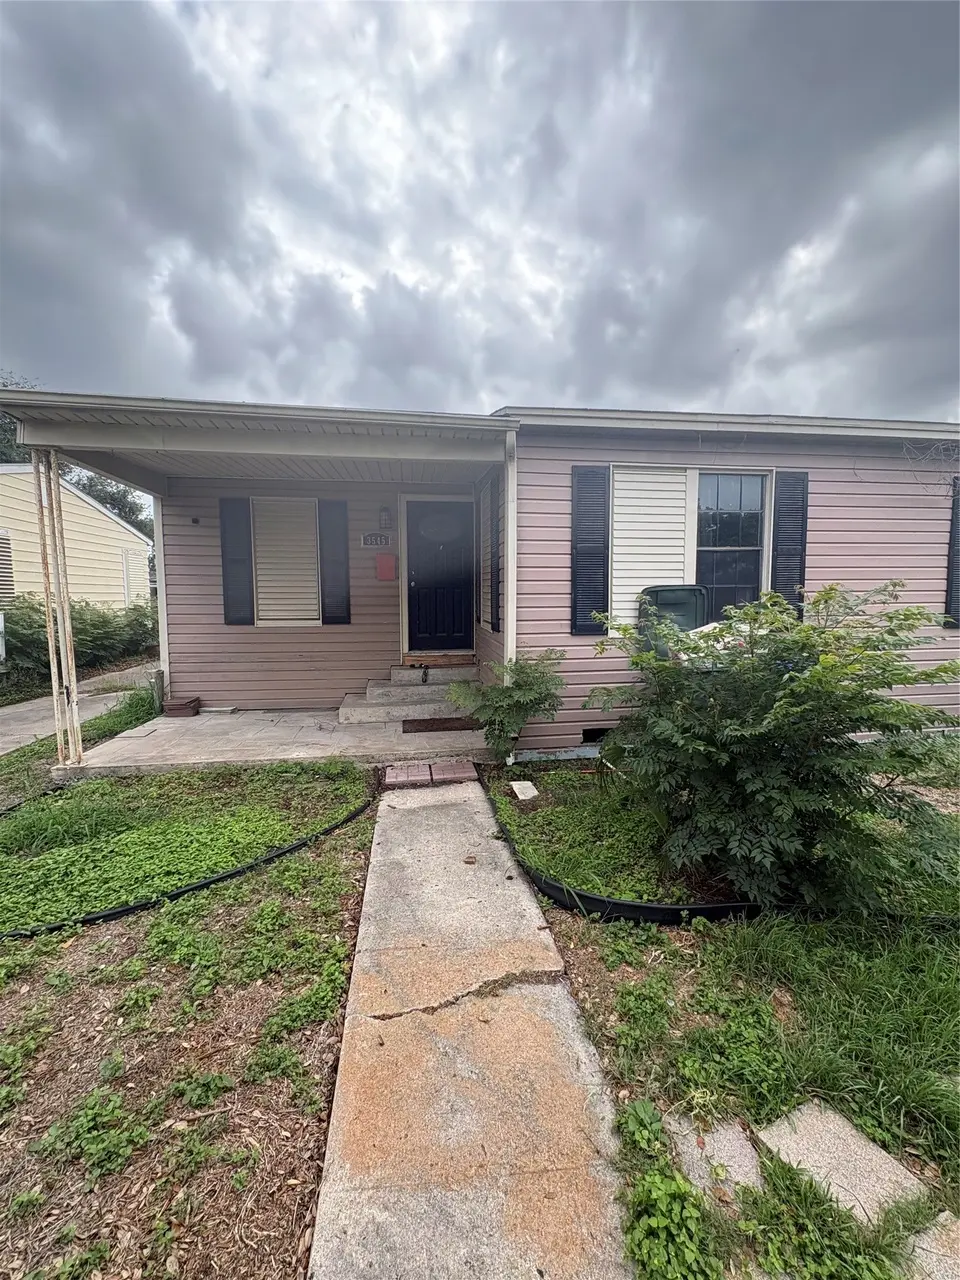
3545 Monterrey St · Corpus Christi, TX
Flood risk 1/10 · Minimal
- FEMA flood zone
- X (unshaded)
- Chance of flooding over 30 yrs
- 0.0%
- Est. flood insurance / yr
- $507 – $1,088
Fire risk 1/10 · Minimal
- Est. fire insurance / yr
- $1,222 – $2,270
Heat risk 10/10 · Severe
- Hot days now (above 107°F)
- 7 days/yr
- Hot days in 30 yrs
- 25 days/yr
Wind risk 9/10 · Severe
- Chance of severe wind over 30 yrs
- 99.0%
Air-quality risk 1/10 · Minimal
- Unhealthy air days now
- 0 days/yr
- Unhealthy air days in 30 yrs
- 0 days/yr
Risk factors via First Street. Map © Google.
Why this score? — see what drove the B grade
The composite is a weighted blend of 9 inputs, each scored 0–100. Each bar is that input's sub-score; the figure is the points it added to the 100-point composite (weight × sub-score).
- Cash flow +25.1/30.0
- ARV discount +15.0/15.0
- 1% rule +8.9/10.0
- DSCR +8.2/10.0
- Rent growth +4.5/5.0
- Livability +3.9/5.0
- Schools +2.8/10.0
- Condition / age +2.5/5.0
- Appreciation +0.0/10.0
$159,900
🖨 Deal sheet 📄 Offer letter ✓ Due diligence
Listing remarks MLS
Charming home in desirable neighborhood. This adorable home features two very large living areas! Second living area has a fireplace and could easily be a very nice second master bedroom!! Very nice hardwood and tile floors throughout the open floor plan. Spacious kitchen includes up to date granite counter tops, stainless appliances, and gas stove! Country style covered back patio. Oversized detached garage. Backyard has beautiful trees and wooden deck. New roof in 2013!!
Key facts
- 7,405 sq ft lot
- 2 garage spots
- Built 1947
Property features AI
Exterior
- Parking: 2-car garage; Attached carport; Detached parking; 2-car carport space
- Utilities: Public water; Public sewer
- Home design: Residential property; Single-story living (rooms listed on first floor)
- Construction: Built in 1947; Brick and wood siding construction; Composition roof; Pillar/post/pier foundation
- Exterior features: Subdivision lot; Lot approximately 0.17 acres
Interior
- Bedrooms: Primary bedroom on the first floor; Additional bedrooms on the first floor
- Bathrooms: 2 full bathrooms (including a primary bathroom on the first floor)
- Heating & cooling: Central heating (electric); Central air conditioning (electric)
- Interior features: One fireplace; Total of 5 rooms
Neighborhood map
What this means for you Summary
Snapshot
- This is a 3-bed/2.0-bath single-family listed at $160k.
Deal economics
- At list price, monthly cash flow is $351 ($4k/yr) — positive.
- The deal already cash-flows at list — no discount required.
- Meets the 1% rule at list price ($2k rent vs $160k).
- Recommended offer: $155k (3.0% below list) — sets the bar for market timing.
- Cap rate 8.9% vs local median 3.6% in Corpus Christi — top-decile yield for the area; either an underpriced asset or a hidden risk that comps aren't pricing in. Stress-test before assuming the spread holds.
Location & tenants
- Location reads 78/100 on livability (#66 in TX, #2,404 nationally) — a middle-class / working-renter tenant base. Strengths: commute A+, cost of living A+, housing A+; Watch: crime F.
- Corpus Christi ISD (urban): math 31% / reading 35% proficiency, ranked #562 of 826 in TX (top 68%) — families likely to look elsewhere, expect single-tenant / working-renter base with shorter leases; 63% free/reduced lunch — lower-income household profile, screen leases tightly.
- Zoned schools: Calk-Wilson El (math 27% / reading 33%, grade F, #2,500 of 4,322 statewide, top 58%, 693 students, 84% FRL); Hamlin Middle (math 17% / reading 33%, grade F, #1,258 of 1,662 statewide, top 77%, 481 students, 85% FRL) — zoned schools average 84% FRL vs 63% district-wide (22 pts higher); higher-poverty schools than district average — tighter screening recommended.
- Market conditions: Rents rising fast (+7.9%/yr); 142 active listings in the ZIP; 11 comparable units currently listed for rent nearby; rentals lingering (median 44d on market — plan ~5-8 weeks vacancy on turnover, expect pricing pressure); 64% of comp listings sitting > 30 days — soft ceiling on asking rent; 1,397 units permitted in Nueces County in 2024 (47 in 5+ unit buildings).
- At $2,223/mo this rent would consume 46% of the median local household income ($58k/yr) (locally 1284% of renters already pay >50% of income on rent) — very limited rent-growth headroom before tenants either downsize or default.
Forward outlook
- Local home prices are declining (-3.0%/yr); year-one equity from $1k of loan paydown is wiped out by about $5k of value loss. Plan a longer hold.
- Nueces County population projected at +36% by 2050 — long-run rental-demand tailwind backs the buy-and-hold thesis.
- At projected returns (-3.0% appreciation + 7.9% rent growth), your $45k cash investment doubles in ~7 years — after that, you're playing with house money.
Negotiation context
- It's been on market 54 days — a 3% lower offer ($155k) is reasonable based on typical stale-listing flexibility.
- 6 sale attempts since 22y ago; this cycle's ask has dropped $20k (11%) from the opening price — seller is motivated, your offer sets the floor, not the list.
Risks & watch-outs
- Watch-outs: property tax is 3.7% of price; built in 1947 — expect roof / HVAC / electrical / plumbing capex.
- Climate carrying-cost: severe wind risk, 99% chance of damaging wind over 30y; extreme-heat days projected 7→25/yr by 2055 (HVAC capex compounding) — expect insurance premiums to compound above CPI over the hold.
Questions for the listing agent
- It's been on market 54 days. Have you received any prior offers? Is the seller open to a 3% concession, seller financing, or rate buy-down credit?
- Built in 1947 — when were the roof, HVAC, electrical panel, plumbing, and water heater last replaced?
- Property tax is high relative to price — has the assessment been appealed recently, and will the sale trigger a re-assessment?
- Is there a deadline driving the sale (1031 exchange, divorce, estate, relocation)? That informs how much negotiation room exists.
- Crime grade is F in this area — have there been break-ins, vandalism, or insurance claims at this property in the last 3 years? What carrier currently insures it and at what premium?
- What's the average days-on-market for RENTAL listings here right now (not sales)? A rising rental-DOM trend means longer vacancies and softer asking-rent achievability than the comps imply.
- What's the recent tenant-quality profile in this submarket — average credit score on applications, eviction rate, late-payment / NSF rate, and stable-employment percentage? A property-management company in the area should have these aggregated.
- How much new for-sale + rental construction is in the pipeline within 1–3 miles? Heavy new supply typically softens prices + rents 12–24 months out; constrained supply supports both.
Investment metrics
- 1% rule
- 1.39% ✓
- Cap rate
- 8.93%
- Cash-on-cash
- 9.42%
- DSCR
- 1.42
- GRM
- 6.0
CMA / ARV
- ARV (median comp)
- $211,037
- List price
- $159,900
- Delta
- -24.23%
- Verdict
- UNDERPRICED
- Comps
- 20 within 1.0 mi
Show comp detail 12 sales within ~0.75 mi
| Address | Dist | Beds/Ba | Sqft | Sold | Price | $/sf | Match |
|---|---|---|---|---|---|---|---|
| 3710 Pope Dr | 0.61mi | 3/2.0 | 1,808 (-3%) | 1mo | $264,900 | $147 | 66 |
| 3307 San Antonio St | 0.52mi | 3/2.5 | 1,816 (-2%) | 7mo | $299,000 | $165 | 64 |
| 415 Center Dr | 0.52mi | 3/2.0 | 1,979 (+6%) | 4mo | $395,000 | $200 | 62 |
| 625 Delaine Dr | 0.63mi | 3/2.0 | 1,960 (+5%) | 1mo | $309,500 | $158 | 61 |
| 332 Doddridge St | 0.36mi | 3/2.0 | 1,653 (-11%) | 7mo | $299,900 | $181 | 59 |
| 613 Brawner Pkwy | 0.45mi | 3/2.0 | 1,645 (-12%) | 3mo | $169,900 | $103 | 57 |
| 617 Grant Pl | 0.68mi | 4/2.0 (+1) | 1,970 (+6%) | 1mo | $355,000 | $180 | 53 |
| 606 Grant Pl | 0.63mi | 3/2.0 | 1,732 (-7%) | 10mo | $315,000 | $182 | 50 |
| 1038 Herndon St | 0.72mi | 3/2.0 | 1,769 (-5%) | 9mo | $279,500 | $158 | 50 |
| 324 Foster Dr | 0.73mi | 4/3.0 (+1) | 1,905 (+2%) | 8mo | $439,999 | $231 | 47 |
| 3225 Lawnview St | 0.56mi | 3/2.0 | 1,583 (-15%) | 4mo | $299,500 | $189 | 46 |
| 1010 Weber Pkwy | 0.67mi | 4/2.5 (+1) | 2,046 (+10%) | 3mo | $319,999 | $156 | 43 |
Match score weights: distance 35% · size 25% · config 20% · recency 20%. Top-matched comps best support the ARV.
Projected returns pro-forma
-3.0% appreciation · 7.91% rent growth · sell at horizon
- IRR
- 4.4%
- Equity multiple
- 1.18×
- Total profit
- $8,212
- Equity at exit
- $23,842
- IRR
- 18.7%
- Equity multiple
- 2.99×
- Total profit
- $89,208
- Equity at exit
- $13,825
Cash invested: $44,772 (down + closing). Projections, not guarantees.
Landlord ↔ Tenant lean methodology
- Overall (STATE)
- 87 Strongly Landlord-Friendly
- State Texas
- 87 Strongly Landlord-Friendly · R+5
- County
- — inherits STATE
- City
- — inherits STATE
ZIP-level market 78411
- Rents YoY
- 7.9%
- Active inventory
- 142
- Price-to-rent
- 6.0×
Monthly cashflow live
- Estimated rent
- $2,223 high interval (Pro) →
- Mortgage (P&I)
- −$839
- Tax from tax record
- −$499 /mo · $5,993/yr
- Insurance
- −$67
- HOA
- −$0
- Vacancy / Maint / Mgmt
- −$467
- Net cashflow
- $351
Break-even live
UW: 25.0% down · 7.5% · 30yr · 1.5% tax · 5.0% vac · 8.0% maint · 8.0% mgmt
Financing live
Cash to close
- Down payment
- $39,975
- Closing costs
- $4,797
- Reserves months
- —
- Total cash needed
- —
Loan-product check · same deal, 3 products live
Conventional
25% down · 7.5% · 30yr
- Down + closing
- —
- Monthly P&I
- —
- Monthly cashflow
- —
- DSCR
- —
- Eligible?
- —
Personal DTI + credit; lowest rate.
DSCR
20% down · 8.5% · 30yr
- Down + closing
- —
- Monthly P&I
- —
- Monthly cashflow
- —
- DSCR
- —
- Eligible?
- —
No personal income docs; deal must DSCR.
Hard money
10% down · 12.0% · 12mo
- Down + closing
- —
- Monthly P&I
- —
- Monthly cashflow
- —
- DSCR
- —
- Eligible?
- —
Short-term bridge; refi at stabilization.
Rent comps 11 comps
| Address | Beds | Baths | Sqft | Rent | $/sqft | DOM | Units | Dist |
|---|---|---|---|---|---|---|---|---|
| 3450 S Alameda St Corpus Christi, TX | 3.0 | 1.5 | 2342 | $1,350 | $0.58 | 44d | 1 | 0.28mi |
| 502 Brawner Pkwy Corpus Christi, TX | 3.0 | 2.0 | 2293 | $2,200 | $0.96 | 44d | 1 | 0.34mi |
| 625 Catalina Pl Corpus Christi, TX | 3.0 | 2.0 | 1750 | $2,100 | $1.20 | 14d | 1 | 0.78mi |
| 301 Bermuda Pl Corpus Christi, TX | 2.0 | 2.0 | 2111 | $2,850 | $1.35 | 44d | 1 | 0.90mi |
| 3314 Casa de Palmas Dr Corpus Christi, TX | 3.0 | 2.0 | 1869 | $2,300 | $1.23 | 14d | 1 | 0.99mi |
| 929 Dolphin Pl Corpus Christi, TX | 3.0 | 2.0 | 1508 | $2,095 | $1.39 | 21d | 1 | 1.15mi |
| 2901 S Staples St Unit B Corpus Christi, TX | 2.0 | 1.0 | 2236 | $900 | $0.40 | 44d | 1 | 1.34mi |
| 4302 Ocean Dr Corpus Christi, TX | 3.0 | 2.0 | 1420 | $2,100 | $1.48 | 44d | 1 | 1.34mi |
| 4302 Ocean Dr Corpus Christi, TX | 3.0 | 2.0 | 1420 | $2,050 | $1.44 | 44d | 2 | 1.35mi |
| 4110 Grossman Dr Unit B Corpus Christi, TX | 3.0 | 2.0 | 1228 | $1,500 | $1.22 | 44d | 1 | 1.42mi |
| 455 Louisiana Ave Corpus Christi, TX | 2.0 | 1.0 | 1528 | $3,000 | $1.96 | 21d | 1 | 1.44mi |
Listing history 32 events
-
2026-06-18days on market $159,900 Active 54 DOM
-
2026-06-17days on market $159,900 Active 53 DOM
-
2026-06-16days on market $159,900 Active 52 DOM
-
2026-06-15days on market $159,900 Active 51 DOM
-
2026-06-14days on market $159,900 Active 49 DOM
-
2026-06-10days on market $159,900 Active 46 DOM
-
2026-06-09days on market $159,900 Active 45 DOM
-
2026-06-08days on market $159,900 Active 44 DOM
-
2026-06-07days on market $159,900 Active 43 DOM
-
2026-06-05days on market $159,900 Active 40 DOM
-
2026-06-03days on market $159,900 Active 39 DOM
-
2026-06-02days on market $159,900 Active 38 DOM
-
2026-06-01days on market $159,900 Active 37 DOM
-
2026-05-31days on market $159,900 Active 36 DOM
-
2026-05-30days on market $159,900 Active 35 DOM
-
2026-05-14price $164,900 515-char remark
-
2026-05-07price $169,000 515-char remark
-
2026-04-25$180,000 Active 515-char remark
-
2015-08-12soldstatus
-
2015-08-06historical 478-char remark
Show marketing remark (478 chars)
Charming home in desirable neighborhood. This adorable home features two very large living areas! Second living area has a fireplace and could easily be a very nice second master bedroom!! Very nice hardwood and tile floors throughout the open floor plan. Spacious kitchen includes up to date granite counter tops, stainless appliances, and gas stove! Country style covered back patio. Oversized detached garage. Backyard has beautiful trees and wooden deck. New roof in 2013!!
-
2015-07-30soldstatus Closed 478-char remark
Show marketing remark (478 chars)
Charming home in desirable neighborhood. This adorable home features two very large living areas! Second living area has a fireplace and could easily be a very nice second master bedroom!! Very nice hardwood and tile floors throughout the open floor plan. Spacious kitchen includes up to date granite counter tops, stainless appliances, and gas stove! Country style covered back patio. Oversized detached garage. Backyard has beautiful trees and wooden deck. New roof in 2013!!
-
2015-04-24$154,000 478-char remark
Show marketing remark (478 chars)
Charming home in desirable neighborhood. This adorable home features two very large living areas! Second living area has a fireplace and could easily be a very nice second master bedroom!! Very nice hardwood and tile floors throughout the open floor plan. Spacious kitchen includes up to date granite counter tops, stainless appliances, and gas stove! Country style covered back patio. Oversized detached garage. Backyard has beautiful trees and wooden deck. New roof in 2013!!
-
2013-11-06soldstatus
-
2013-11-04soldstatus
Show marketing remark (361 chars)
An absolute doll house! Located in a desirable area, this home will charm you with its amazing curb appeal. Gorgeous hardwood floors throughout the open floor plan. The kitchen includes a stove, dishwasher and a microwave with up to date granite counter tops. A new roof has recently been installed! Come view this home today to witness all the latest features.
-
2013-10-21soldstatus
-
2013-09-26$136,900
Show marketing remark (361 chars)
An absolute doll house! Located in a desirable area, this home will charm you with its amazing curb appeal. Gorgeous hardwood floors throughout the open floor plan. The kitchen includes a stove, dishwasher and a microwave with up to date granite counter tops. A new roof has recently been installed! Come view this home today to witness all the latest features.
-
2013-07-09soldstatus
-
2005-03-15soldstatus
-
2005-03-11soldstatus
-
2005-01-19$119,700
-
2004-12-01$124,500
-
2004-08-07$127,000
ⓘ Source: listings_history table (triggers on properties + properties_extension) + one-shot
backfill from property_details.listing_events for pre-trigger history.
Tax reassessment forecast TX · Resets to sale price
- Current annual tax
- $5,993 · $499/mo
- Projected year-2 tax
- $5,993 · $499/mo
- Expected delta
- $0/yr ($0/mo · 0.0%)
ⓘ Screening estimate from a state-policy table — verify with the county assessor before closing.
Climate risk First Street
- Flood 1/10 Low FEMA zone X (unshaded) · 0% chance over 30 yrs
- Wildfire 1/10 Low
- Heat 10/10 Extreme 7 d/yr ≥107°F today · 25 d/yr by 30 yrs out
- Wind 9/10 Extreme 99% chance of damaging wind over 30 yrs
- Air quality 1/10 Low 0 unhealthy d/yr today · 0 by 30 yrs out
Nearby sold comps map
Loading sold comps map…
Walkable amenities ~0.75 mi
Loading nearby amenities…
Taxation est. · year 1
- Rental income
- $26,672
- − Mortgage interest
- −$8,957
- − Property taxes
- −$5,993
- − Insurance
- −$800
- − Repairs & maintenance
- −$2,134
- − Management
- −$2,134
- − Depreciation
- −$4,652
- Taxable income
- $2,004
- Est. tax owed @ 24.0%
- −$481
- After-tax cash flow
- $3,736/yr
For passive investors: Depreciation is non-cash, so a rental often shows a tax loss while cash-flowing — sheltering income. Rental losses are passive: they offset passive income freely, and up to $25,000/yr can offset ordinary (W-2) income if you actively participate and your MAGI is under $100k (phasing out to $0 by $150k); unused losses carry forward. On sale, claimed depreciation is recaptured at up to 25%, and gains may owe capital-gains tax (a 1031 exchange can defer both). Figures are a year-1 estimate at your 24.0% rate — not tax advice; consult a CPA.
Schools (NCES district)
- District
- Corpus Christi ISD
- NCES district ID
- 4815270
- Math proficiency
- 31% ▼ -18.00%
- Reading proficiency
- 35% ▼ -7.00%
- Median HH income
- $45,672
- Composite
- 28.27/100
- National rank
- #6793
- State rank
- #562 of 826 in TX
Livability — Corpus Christi
- Score
- 78/100
- State rank
- #66
- US rank
- #2404
Category grades
Schools grade is shown separately in the Schools card above.
Census & demographics
- Census place
- Corpus Christi, TX
- County
- Nueces County · 296,836 people
- City population
- 296,836
- Metro
- Corpus Christi, TX
- Population (ZIP)
- 23,682
- Household income
- $57,742
- Rent vs Own
- Severe rent burden
- 1284.0
Population outlook (Nueces County) Hauer SSP2
- Today (2025)
- 418,037 people
- By 2030
- 447,123 · +7.0%
- By 2040
- 505,911 · +21.0%
- By 2050
- 567,522 · +35.8%
- By 2075
- 729,686 · +74.6%
- By 2100
- 847,087 · +102.6%
Race, ethnicity, and origin ACS 2023
- Neighborhood character
- Majority Hispanic (58%)
- Race & ethnicity
- Hispanic / Latino 58% White 35% Two or more races 29% Black 3% Asian 2%
- Hispanic origin (detail)
- Mexican 51%
- Common ancestry
- Slovak 2% Italian 1% Serbian 1%
- Foreign-born
- 6% · Canada
- Languages at home
- 75% English-only · Spanish 23% Tagalog/Filipino 1% Other Indo-European 1%
Political lean MEDSL · Nueces
- 2024 margin
- R (+11.5) · D 43.8% · R 55.3%
- 2008→2024 swing
- -7.1pp toward R · 2008: -4.4pp · 2024: -11.5pp
- All cycles
- 2024: R+11.5 2020: R+2.9 2016: R+1.5 2012: R+3.2 2008: R+4.4
Not yet ingested
- Civics
- —
Market trends
- HPI YoY
- ▼ -265.71%
- Current HPI
- 191.7201
- Rent YoY
- ▲ 7.91%
- Metro
- Corpus Christi, TX
- State GDP YoY
- ▲ 3.95%
- F500 in state
- 110
Industry mix (Fortune 500 HQ in TX)
| Industry | F500 HQs | Revenue |
|---|---|---|
| Energy | 16 | $1,198B |
|
||
| Technology | 5 | $198B |
|
||
| Engineering / Construction | 4 | $72B |
|
||
| Energy Services | 3 | $60B |
|
||
| Utilities | 3 | $41B |
|
||
| Healthcare | 2 | $330B |
|
||
Price history
+25.9% since first listed18 events — show timeline
- 2026-05-28 Price Changed $159,900 HARMLS
- 2026-05-14 Price Changed $164,900 HARMLS
- 2026-05-07 Price Changed $169,000 HARMLS
- 2026-04-25 Listed $180,000 HARMLS
- 2015-08-12 Sold (Public Records) — Public Records
- 2015-08-06 Delisted — CBMLS
- 2015-07-30 Sold (MLS) — CBMLS
- 2015-04-24 Listed $154,000 CBMLS
- 2013-11-06 Sold (Public Records) — Public Records
- 2013-11-04 Sold (MLS) — CBMLS
- 2013-10-21 Sold (Public Records) — Public Records
- 2013-09-26 Listed $136,900 CBMLS
- 2013-07-09 Sold (Public Records) — Public Records
- 2005-03-15 Sold (Public Records) — Public Records
- 2005-03-11 Sold (MLS) — CBMLS
- 2005-01-19 Listed $119,700 CBMLS
- 2004-12-01 Listed $124,500 CBMLS
- 2004-08-07 Listed $127,000 CBMLS
Property tax history
+4.8%/yrLatest (2025): $5,993 · +11.2% YoY. Source: county tax records.
Cash-flow waterfall
monthlySold comps — $/sqft
last 12 mo · ≤1 miLoading sold comps…