2240 Kuhio Ave #2004 · Urban Honolulu, HI
Flood risk 8/10 · Major
- FEMA flood zone
- AO
- Chance of flooding over 30 yrs
- 0.99%
- Est. flood insurance / yr
- $848 – $2,087
Fire risk No data
- Est. fire insurance / yr
- —
Heat risk No data
- Hot days now (above threshold)
- —
- Hot days in 30 yrs
- —
Wind risk No data
- Chance of severe wind over 30 yrs
- —
Air-quality risk 1/10 · Minimal
- Unhealthy air days now
- —
- Unhealthy air days in 30 yrs
- —
Risk factors via First Street. Map © Google.
Why this score? — see what drove the C grade
The composite is a weighted blend of 9 inputs, each scored 0–100. Each bar is that input's sub-score; the figure is the points it added to the 100-point composite (weight × sub-score).
- Cash flow +15.2/30.0
- 1% rule +10.0/10.0
- ARV discount +7.5/15.0
- Appreciation +6.4/10.0
- DSCR +4.6/10.0
- Rent growth +4.0/5.0
- Schools +3.7/10.0
- Livability +2.5/5.0
- Condition / age +2.5/5.0
$140,000
🖨 Deal sheet 📄 Offer letter ✓ Due diligence
Listing remarks MLS
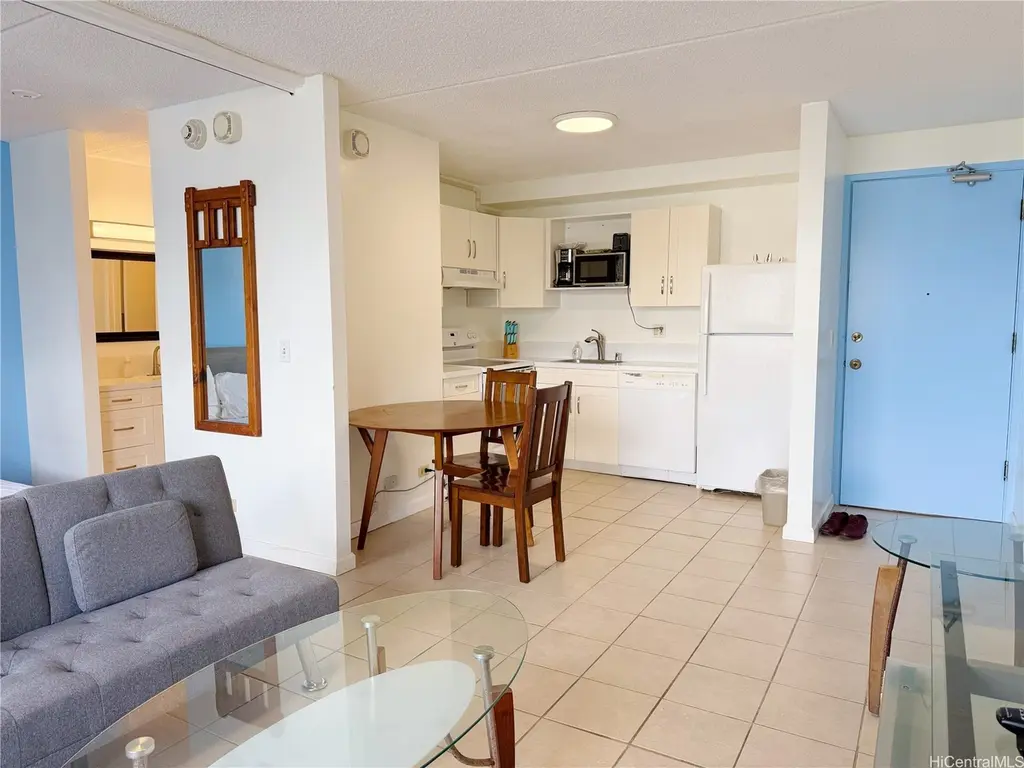
Modern island living awaits in this upgraded 1-bedroom, 1-bath leasehold residence at the Royal Kuhio. The unit features upgraded kitchen and bathroom with views of the mountain and ala wai canal. Nestled centrally in Waikiki, you’ll be in close proximity from shopping, dining, International marketplace, beaches, stores and daily conveniences. The Royal Kuhio offers an array of amenities to enjoy—relax by the newly renovated pool, host friends at the BBQ area, or recharge in the fitness center and sauna. With 30-day minimum rentals permitted, this property is a fantastic option for investors, second-home owners, or anyone looking to experience the best of Waikiki.
Key facts
- Upgraded bathroom
- Upgraded kitchen
- Newly renovated pool
Tags
Neighborhood map
What this means for you Summary
Snapshot
- This is a 1-bed/1.0-bath condo listed at $140k.
Deal economics
- At list price, monthly cash flow is $-75 ($-897/yr) — negative.
- To cash-flow at today's rent, offer at most $127k (9.4% below list).
- Meets the 1% rule at list price ($2k rent vs $140k).
- Recommended offer: $123k (12.0% below list) — sets the bar for market timing.
- Cap rate 6.7% vs local median 1.5% in Urban Honolulu — top-decile yield for the area; either an underpriced asset or a hidden risk that comps aren't pricing in. Stress-test before assuming the spread holds.
Location & tenants
- Location reads: area grade C — affects rentability + tenant quality, not the cash-flow math above.
- Hawaii Department Of Education (suburban): math 32% / reading 50% proficiency, ranked #1 of 1 in HI (top 100%) — families likely to look elsewhere, expect single-tenant / working-renter base with shorter leases.
- Market conditions: Rents rising fast (+6.0%/yr); 814 active listings in the ZIP; 15 comparable units currently listed for rent nearby; rentals at typical pace (median 24d on market — plan ~3-4 weeks tenant-placement turnaround); solid renter incomes; 1,638 units permitted in Honolulu County in 2024 (793 in 5+ unit buildings).
- This rent runs 36% of the median local income ($77k/yr) — at the standard rent-burdened threshold; future hikes will face affordability resistance.
Forward outlook
- In year one you build about $5k of equity ($968 loan paydown + $4k appreciation (2.7% local appreciation)).
- Honolulu County population projected at +17% by 2050 — long-run rental-demand tailwind backs the buy-and-hold thesis.
- At projected returns (2.7% appreciation + 6.0% rent growth), your $39k cash investment doubles in ~6 years — after that, you're playing with house money.
- By year 7, paydown + projected appreciation supports a ~$30k cash-out refi (75% LTV) — recoverable capital for the next deal without selling this one.
Negotiation context
- It's been on market 282 days — a 12% lower offer ($123k) is reasonable based on typical stale-listing flexibility.
- 2 sale attempts with the ask held roughly flat each time — persistent listings suggest the price (not the market) is what's stuck; bring a comps-based counter.
Risks & watch-outs
- Watch-outs: flood insurance adds $122/mo; HOA is 38% of rent.
- Climate carrying-cost: in FEMA flood zone AO (mandatory federal flood insurance) — expect insurance premiums to compound above CPI over the hold.
Questions for the listing agent
- What do current leases actually rent for vs. the listed asking? Can we see a recent rent roll and the last 12 months of T-12 income?
- It's been on market 282 days. Have you received any prior offers? Is the seller open to a 12% concession, seller financing, or rate buy-down credit?
- Built in 1976 — when were the roof, HVAC, electrical panel, plumbing, and water heater last replaced?
- What's the actual annual flood-insurance premium (NFIP or private), and is the property in a SFHA with mandatory coverage?
- What does the HOA fee cover, when was the last increase, and are there any pending special assessments or reserve-fund shortfalls?
- Any open or pending special assessments — roof, HVAC, plumbing, elevator, façade? What's the per-unit balance and payoff schedule, and is the seller paying it off at close or rolling it to the buyer?
- Why hasn't it sold? Are there any deal-killer items the seller is aware of (foundation, flood, title, zoning, code violations)?
- Is there a deadline driving the sale (1031 exchange, divorce, estate, relocation)? That informs how much negotiation room exists.
- What's the average days-on-market for RENTAL listings here right now (not sales)? A rising rental-DOM trend means longer vacancies and softer asking-rent achievability than the comps imply.
- What's the recent tenant-quality profile in this submarket — average credit score on applications, eviction rate, late-payment / NSF rate, and stable-employment percentage? A property-management company in the area should have these aggregated.
- How much new apartment / multifamily construction is in the pipeline within 1–3 miles? Heavy new supply (>2% of stock underway) typically softens rents 12–24 months out; light construction supports rent growth.
Investment metrics
- 1% rule
- 1.64% ✓
- Cap rate
- 6.70%
- Cash-on-cash
- 1.45%
- DSCR
- 1.06
- GRM
- 5.1
CMA / ARV
- ARV (median comp)
- $419,206
- List price
- $140,000
- Delta
- -66.60%
- Verdict
- UNDERPRICED
- Comps
- 20 within 1.0 mi
Projected returns pro-forma
2.74% appreciation · 6.0% rent growth · sell at horizon
- IRR
- 7.8%
- Equity multiple
- 1.46×
- Total profit
- $17,936
- Equity at exit
- $60,933
- IRR
- 13.5%
- Equity multiple
- 3.19×
- Total profit
- $85,696
- Equity at exit
- $92,366
Cash invested: $39,200 (down + closing). Projections, not guarantees.
Landlord ↔ Tenant lean methodology
- Overall (STATE)
- 37 Tenant-Leaning
- State Hawaii
- 37 Tenant-Leaning · D+13
- County
- — inherits STATE
- City
- — inherits STATE
ZIP-level market 96815
- Home prices YoY
- 0.9%
- Rents YoY
- 6.0%
- Active inventory
- 814
- Price-to-rent
- 5.1×
Monthly cashflow live
- Estimated rent
- $2,293 high interval (Pro) →
- Mortgage (P&I)
- −$734
- Tax from tax record
- −$98 /mo · $1,172/yr
- Insurance
- −$58
- Flood insurance flood zone
- −$122 /mo · $1,468/yr
- HOA
- −$874
- Vacancy / Maint / Mgmt
- −$482
- Net cashflow
- $-75
Break-even live
UW: 25.0% down · 7.5% · 30yr · 1.5% tax · 5.0% vac · 8.0% maint · 8.0% mgmt
Financing live
Cash to close
- Down payment
- $35,000
- Closing costs
- $4,200
- Reserves months
- —
- Total cash needed
- —
Loan-product check · same deal, 3 products live
Conventional
25% down · 7.5% · 30yr
- Down + closing
- —
- Monthly P&I
- —
- Monthly cashflow
- —
- DSCR
- —
- Eligible?
- —
Personal DTI + credit; lowest rate.
DSCR
20% down · 8.5% · 30yr
- Down + closing
- —
- Monthly P&I
- —
- Monthly cashflow
- —
- DSCR
- —
- Eligible?
- —
No personal income docs; deal must DSCR.
Hard money
10% down · 12.0% · 12mo
- Down + closing
- —
- Monthly P&I
- —
- Monthly cashflow
- —
- DSCR
- —
- Eligible?
- —
Short-term bridge; refi at stabilization.
Rent comps 15 comps
| Address | Beds | Baths | Sqft | Rent | $/sqft | DOM | Units | Dist |
|---|---|---|---|---|---|---|---|---|
| 232 Kaiulani Ave Honolulu, HI | 3.0 | 1.0 | 656 | $3,088 | $4.71 | 23d | 8 | 0.30mi |
| 242 Kaiulani Ave Honolulu, HI | — | 1.0 | 253 | $1,250 | $4.94 | 23d | 1 | 0.30mi |
| 242 Kaʻiulani Ave Unit 4 Honolulu, HI | — | 1.0 | 253 | $1,200 | $4.74 | 23d | 1 | 0.30mi |
| 440 Olohana St Unit 1327703P Honolulu, HI | 1.0 | 1.0 | 355 | $4,055 | $11.42 | 11d | 1 | 0.32mi |
| 440 Olohana St Unit 1327711P Honolulu, HI | 1.0 | 1.0 | 355 | $3,741 | $10.54 | 2d | 1 | 0.32mi |
| 2442 Tusitala St Apt 103 Honolulu, HI | — | 1.0 | 300 | $1,900 | $6.33 | 43d | 1 | 0.40mi |
| 249 Kapili St Unit 1 Honolulu, HI | — | 1.0 | 290 | $1,350 | $4.66 | 21d | 1 | 0.43mi |
| 249 Kapili St #101 Honolulu, HI | — | 1.0 | 225 | $1,500 | $6.67 | 23d | 1 | 0.43mi |
| 2509 Ala Wai Blvd Honolulu, HI | — | 1.0 | 215 | $1,725 | $8.02 | 23d | 2 | 0.51mi |
| 2509 Ala Wai Blvd #503 Honolulu, HI | — | 1.0 | 215 | $1,750 | $8.14 | 3d | 1 | 0.51mi |
| 234 Ohua Ave #217 Honolulu, HI | — | 1.0 | 257 | $1,550 | $6.03 | 23d | 1 | 0.53mi |
| 300 Wai Nani Way Unit 1808 Honolulu, HI | — | 1.0 | 321 | $1,700 | $5.30 | 43d | 1 | 0.62mi |
| 2572 Lemon Rd Honolulu, HI | 1.0 | 1.0 | 398 | $2,597 | $6.53 | 3d | 3 | 0.69mi |
| 902 University Ave Unit C Honolulu, HI | 2.0 | 1.0 | 415 | $2,318 | $5.58 | 23d | 1 | 0.75mi |
| 234 Hua AVE Unit 103 Honolulu, HI | — | 1.0 | 257 | $1,550 | $6.03 | 3d | 1 | 0.94mi |
HOA detail condo
- Monthly dues
- $874 · $10,488/yr
- Likely covers
- poolgym
- Assessments
- None detected in remarks — confirm with the listing agent.
Listing history 23 events
-
2026-06-18days on market $140,000 Active 282 DOM
-
2026-06-17days on market $140,000 Active 281 DOM
-
2026-06-15days on market $140,000 Active 279 DOM
-
2026-06-13days on market $140,000 Active 277 DOM
-
2026-06-13days on market $140,000 Active 276 DOM
-
2026-06-10days on market $140,000 Active 274 DOM
-
2026-06-09days on market $140,000 Active 273 DOM
-
2026-06-08days on market $140,000 Active 272 DOM
-
2026-06-07days on market $140,000 Active 271 DOM
-
2026-06-05days on market $140,000 Active 268 DOM
-
2026-06-03days on market $140,000 Active 267 DOM
-
2026-06-02days on market $140,000 Active 266 DOM
-
2026-06-01days on market $140,000 Active 265 DOM
-
2026-05-31days on market $140,000 Active 264 DOM
-
2026-02-13status Active 684-char remark
Show marketing remark (684 chars)
Modern island living awaits in this upgraded 1-bedroom, 1-bath leasehold residence at the Royal Kuhio. The unit features upgraded kitchen and bathroom with views of the mountain and ala wai canal. Nestled centrally in Waikiki, you’ll be in close proximity from shopping, dining, International marketplace, beaches, stores and daily conveniences. The Royal Kuhio offers an array of amenities to enjoy—relax by the newly renovated pool, host friends at the BBQ area, or recharge in the fitness center and sauna. With 30-day minimum rentals permitted, this property is a fantastic option for investors, second-home owners, or anyone looking to experience the best of Waikiki.
-
2026-01-26historical Active Under Contract 684-char remark
Show marketing remark (684 chars)
Modern island living awaits in this upgraded 1-bedroom, 1-bath leasehold residence at the Royal Kuhio. The unit features upgraded kitchen and bathroom with views of the mountain and ala wai canal. Nestled centrally in Waikiki, you’ll be in close proximity from shopping, dining, International marketplace, beaches, stores and daily conveniences. The Royal Kuhio offers an array of amenities to enjoy—relax by the newly renovated pool, host friends at the BBQ area, or recharge in the fitness center and sauna. With 30-day minimum rentals permitted, this property is a fantastic option for investors, second-home owners, or anyone looking to experience the best of Waikiki.
-
2025-09-09$140,000 Active 684-char remark
Show marketing remark (684 chars)
Modern island living awaits in this upgraded 1-bedroom, 1-bath leasehold residence at the Royal Kuhio. The unit features upgraded kitchen and bathroom with views of the mountain and ala wai canal. Nestled centrally in Waikiki, you’ll be in close proximity from shopping, dining, International marketplace, beaches, stores and daily conveniences. The Royal Kuhio offers an array of amenities to enjoy—relax by the newly renovated pool, host friends at the BBQ area, or recharge in the fitness center and sauna. With 30-day minimum rentals permitted, this property is a fantastic option for investors, second-home owners, or anyone looking to experience the best of Waikiki.
-
2004-12-22soldstatus $210,000
-
2002-08-30soldstatus $122,500
-
2000-09-29soldstatus $97,000
-
1991-02-01soldstatus $110,000
-
1987-10-01soldstatus $103,700
-
1987-04-01soldstatus $93,000
ⓘ Source: listings_history table (triggers on properties + properties_extension) + one-shot
backfill from property_details.listing_events for pre-trigger history.
Tax reassessment forecast HI · Partial reset (capped growth)
- Current annual tax
- $1,172 · $98/mo
- Projected year-2 tax
- $1,172 · $98/mo
- Expected delta
- $0/yr ($0/mo · 0.0%)
ⓘ Screening estimate from a state-policy table — verify with the county assessor before closing.
Climate risk First Street
- Flood 8/10 Severe FEMA zone AO · 99% chance over 30 yrs
- Air quality 1/10 Low
Nearby sold comps map
Loading sold comps map…
Walkable amenities ~0.75 mi
Loading nearby amenities…
Taxation est. · year 1
- Rental income
- $27,519
- − Mortgage interest
- −$7,842
- − Property taxes
- −$1,172
- − Insurance
- −$2,168
- − Repairs & maintenance
- −$2,202
- − Management
- −$2,202
- − HOA
- −$10,488
- − Depreciation
- −$4,073
- Taxable loss
- −$2,626
- Est. tax savings @ 24.0%
- +$630
- After-tax cash flow
- $-267/yr
For passive investors: Depreciation is non-cash, so a rental often shows a tax loss while cash-flowing — sheltering income. Rental losses are passive: they offset passive income freely, and up to $25,000/yr can offset ordinary (W-2) income if you actively participate and your MAGI is under $100k (phasing out to $0 by $150k); unused losses carry forward. On sale, claimed depreciation is recaptured at up to 25%, and gains may owe capital-gains tax (a 1031 exchange can defer both). Figures are a year-1 estimate at your 24.0% rate — not tax advice; consult a CPA.
Schools (NCES district)
- District
- Hawaii Department Of Education
- NCES district ID
- 1500030
- Math proficiency
- 32% ▼ -10.00%
- Reading proficiency
- 50% ▼ -3.00%
- Median HH income
- $69,005
- Composite
- 37.07/100
- National rank
- #4504
- State rank
- #1 of 1 in HI
Livability — Urban Honolulu
No livability data for this city. (Only ~50 U.S. cities are tracked.)
Census & demographics
- Census place
- Urban Honolulu, HI
- County
- Honolulu County · 963,448 people
- City population
- 309,956
- Metro
- Urban Honolulu, HI
- Population (ZIP)
- 27,530
- Household income
- $77,096
- Rent vs Own
- Severe rent burden
- 2422.0
Population outlook (Honolulu County) Hauer SSP2
- Today (2025)
- 1,072,641 people
- By 2030
- 1,110,460 · +3.5%
- By 2040
- 1,181,593 · +10.2%
- By 2050
- 1,257,584 · +17.2%
- By 2075
- 1,501,120 · +39.9%
- By 2100
- 1,764,430 · +64.5%
Race, ethnicity, and origin ACS 2023
- Neighborhood character
- Highly diverse neighborhood (Simpson 0.71)
- Race & ethnicity
- Asian 41% White 35% Two or more races 16% Hispanic / Latino 6% Pacific Islander 4% Black 2%
- Hispanic origin (detail)
- Mexican 3% Puerto Rican 1%
- Common ancestry
- Romanian 2% Lithuanian 2% Slovak 2%
- Foreign-born
- 30% · China, South Korea, Canada
- Languages at home
- 66% English-only · Other Asian/Pacific 15% Chinese 5% Korean 3%
Political lean MEDSL · Honolulu
- 2024 margin
- Strong D (+21.6) · D 59.9% · R 38.3% · Other 1.8%
- 2008→2024 swing
- -19.4pp toward R · 2008: 41.1pp · 2024: 21.6pp
- All cycles
- 2024: D+21.6 2020: D+26.9 2016: D+29.9 2012: D+39.1 2008: D+41.1
Not yet ingested
- Civics
- —
Market trends
- HPI YoY
- ▲ 2.74%
- Current HPI
- 291.9404
- Rent YoY
- ▲ 6.00%
- Metro
- Urban Honolulu, HI
- State GDP YoY
- —
- F500 in state
- 0
Price history
+50.5% since first listed9 events — show timeline
- 2026-02-13 Relisted — HiCentral MLS
- 2026-01-26 Contingent — HiCentral MLS
- 2025-09-09 Listed $140,000 HiCentral MLS
- 2004-12-22 Sold (Public Records) $210,000 Public Records
- 2002-08-30 Sold (Public Records) $122,500 Public Records
- 2000-09-29 Sold (Public Records) $97,000 Public Records
- 1991-02-01 Sold (Public Records) $110,000 Public Records
- 1987-10-01 Sold (Public Records) $103,700 Public Records
- 1987-04-01 Sold (Public Records) $93,000 Public Records
Property tax history
+2.2%/yrLatest (2022): $1,172 · -5.8% YoY. Source: county tax records.
Cash-flow waterfall
monthlySold comps — $/sqft
last 12 mo · ≤1 miLoading sold comps…