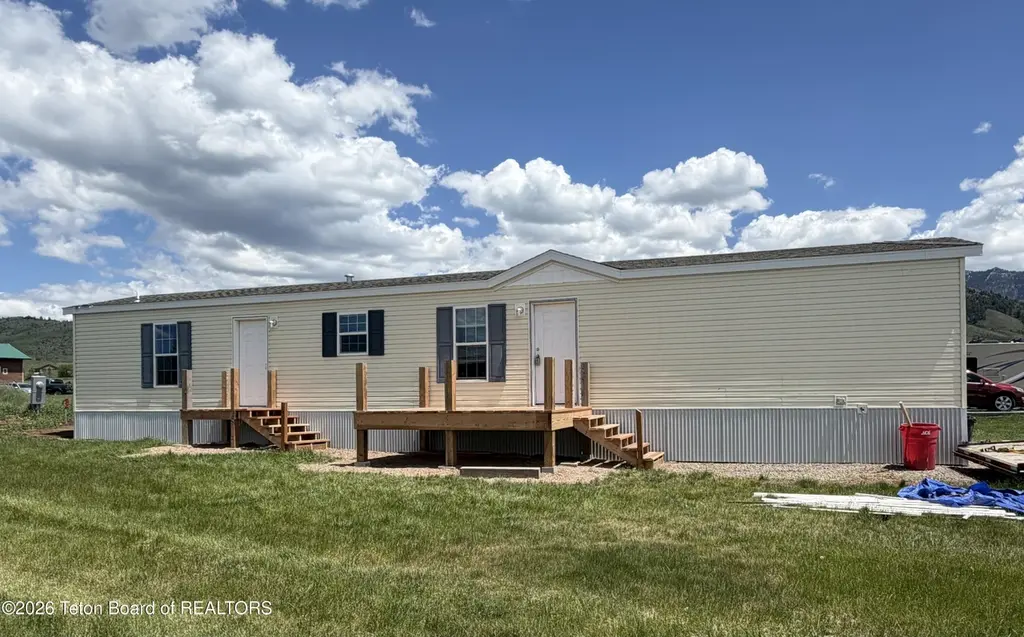
77 Chaparro Ln Lot 12 · Grover, WY
Flood risk No data
- FEMA flood zone
- —
- Chance of flooding over 30 yrs
- —
- Est. flood insurance / yr
- —
Fire risk No data
- Est. fire insurance / yr
- —
Heat risk No data
- Hot days now (above threshold)
- —
- Hot days in 30 yrs
- —
Wind risk No data
- Chance of severe wind over 30 yrs
- —
Air-quality risk No data
- Unhealthy air days now
- —
- Unhealthy air days in 30 yrs
- —
Risk factors via First Street. Map © Google.
Why this score? — see what drove the B- grade
The composite is a weighted blend of 9 inputs, each scored 0–100. Each bar is that input's sub-score; the figure is the points it added to the 100-point composite (weight × sub-score).
- Cash flow +25.2/30.0
- DSCR +8.3/10.0
- ARV discount +7.5/15.0
- 1% rule +6.6/10.0
- Schools +5.4/10.0
- Appreciation +5.0/10.0
- Condition / age +4.0/5.0
- Livability +3.0/5.0
- Rent growth +2.5/5.0
$95,000
🖨 Deal sheet 📄 Offer letter ✓ Due diligence
Key facts
- Built 2016
- Listed 10 days
Property features AI
Finance
- Financial info: Annual tax amount listed
- HOA & community: Association fee paid annually
Exterior
- Utilities: Private water; Private sewer
- Home design: Single-family residence; Residential property; Located in a mobile home park
- Construction: Vinyl siding and other exterior materials
- Exterior features: Front porch; Shingle roof
Interior
- Bathrooms: 2 full bathrooms
- Heating & cooling: Forced air heating; No central air conditioning
- Interior features: Unfurnished; No basement
Neighborhood map
What this means for you Summary
Snapshot
- This is a 3-bed/2.0-bath single-family listed at $95k. Condition is rated good.
Deal economics
- At list price, monthly cash flow is $212 ($3k/yr) — positive.
- The deal already cash-flows at list — no discount required.
- Meets the 1% rule at list price ($1k rent vs $95k).
Location & tenants
- Location reads 59/100 on livability (#124 in WY) — a working-class tenant base; expect higher turnover. Strengths: cost of living A+, crime A, employment A; Watch: amenities F, commute F, housing F.
- Lincoln County School District #2 (rural): math 57% / reading 67% proficiency, ranked #7 of 41 in WY (top 17%) — acceptable for families but not a draw, mixed tenant base, ~2y average lease.
- Market conditions: 8 active listings in the ZIP; 220 units permitted in Lincoln County in 2024 (0 in 5+ unit buildings).
Forward outlook
- In year one you build about $4k of equity ($657 loan paydown + $3k appreciation (3.0% local appreciation)).
- Lincoln County population projected at +4% by 2050 — modest demand growth; plan on rents tracking national, not racing it.
- At projected returns (3.0% appreciation + 3.0% rent growth), your $27k cash investment doubles in ~4 years — after that, you're playing with house money.
- By year 10, paydown + projected appreciation supports a ~$34k cash-out refi (75% LTV) — recoverable capital for the next deal without selling this one.
Negotiation context
- Only 11 days on market — expect competitive offers; lowballing is unlikely to land.
Questions for the listing agent
- Is there a deadline driving the sale (1031 exchange, divorce, estate, relocation)? That informs how much negotiation room exists.
- What's the average days-on-market for RENTAL listings here right now (not sales)? A rising rental-DOM trend means longer vacancies and softer asking-rent achievability than the comps imply.
- What's the recent tenant-quality profile in this submarket — average credit score on applications, eviction rate, late-payment / NSF rate, and stable-employment percentage? A property-management company in the area should have these aggregated.
- How much new for-sale + rental construction is in the pipeline within 1–3 miles? Heavy new supply typically softens prices + rents 12–24 months out; constrained supply supports both.
Investment metrics
- 1% rule
- 1.16% ✓
- Cap rate
- 8.97%
- Cash-on-cash
- 9.58%
- DSCR
- 1.43
- GRM
- 7.2
CMA / ARV
No comps found within radius.
Projected returns pro-forma
3.0% appreciation · 3.0% rent growth · sell at horizon
- IRR
- 16.5%
- Equity multiple
- 1.94×
- Total profit
- $24,980
- Equity at exit
- $42,716
- IRR
- 18.0%
- Equity multiple
- 3.63×
- Total profit
- $70,018
- Equity at exit
- $65,831
Cash invested: $26,600 (down + closing). Projections, not guarantees.
Landlord ↔ Tenant lean methodology
- Overall (STATE)
- 90 Strongly Landlord-Friendly
- State Wyoming
- 90 Strongly Landlord-Friendly · R+25
- County
- — inherits STATE
- City
- — inherits STATE
ZIP-level market 83122
- Active inventory
- 8
- Price-to-rent
- 7.2×
Monthly cashflow live
- Estimated rent
- $1,100 medium interval (Pro) →
- Mortgage (P&I)
- −$498
- Tax est. 1.5%
- −$119 /mo · $1,425/yr
- Insurance
- −$40
- HOA
- −$0
- Vacancy / Maint / Mgmt
- −$231
- Net cashflow
- $212
Break-even live
UW: 25.0% down · 7.5% · 30yr · 1.5% tax · 5.0% vac · 8.0% maint · 8.0% mgmt
Financing live
Cash to close
- Down payment
- $23,750
- Closing costs
- $2,850
- Reserves months
- —
- Total cash needed
- —
Loan-product check · same deal, 3 products live
Conventional
25% down · 7.5% · 30yr
- Down + closing
- —
- Monthly P&I
- —
- Monthly cashflow
- —
- DSCR
- —
- Eligible?
- —
Personal DTI + credit; lowest rate.
DSCR
20% down · 8.5% · 30yr
- Down + closing
- —
- Monthly P&I
- —
- Monthly cashflow
- —
- DSCR
- —
- Eligible?
- —
No personal income docs; deal must DSCR.
Hard money
10% down · 12.0% · 12mo
- Down + closing
- —
- Monthly P&I
- —
- Monthly cashflow
- —
- DSCR
- —
- Eligible?
- —
Short-term bridge; refi at stabilization.
Listing history 8 events
-
2026-06-19days on market $95,000 Active 11 DOM
-
2026-06-18days on market $95,000 Active 10 DOM
-
2026-06-17days on market $95,000 Active 9 DOM
-
2026-06-16days on market $95,000 Active 8 DOM
-
2026-06-15days on market $95,000 Active 7 DOM
-
2026-06-14days on market $95,000 Active 5 DOM
-
2026-06-12days on market $95,000 Active 4 DOM
-
2026-06-09$95,000 Active 1 DOM
ⓘ Source: listings_history table (triggers on properties + properties_extension) + one-shot
backfill from property_details.listing_events for pre-trigger history.
Nearby sold comps map
Loading sold comps map…
Walkable amenities ~0.75 mi
Loading nearby amenities…
Taxation est. · year 1
- Rental income
- $13,197
- − Mortgage interest
- −$5,321
- − Property taxes
- −$1,425
- − Insurance
- −$475
- − Repairs & maintenance
- −$1,056
- − Management
- −$1,056
- − Depreciation
- −$2,764
- Taxable income
- $1,100
- Est. tax owed @ 24.0%
- −$264
- After-tax cash flow
- $2,283/yr
For passive investors: Depreciation is non-cash, so a rental often shows a tax loss while cash-flowing — sheltering income. Rental losses are passive: they offset passive income freely, and up to $25,000/yr can offset ordinary (W-2) income if you actively participate and your MAGI is under $100k (phasing out to $0 by $150k); unused losses carry forward. On sale, claimed depreciation is recaptured at up to 25%, and gains may owe capital-gains tax (a 1031 exchange can defer both). Figures are a year-1 estimate at your 24.0% rate — not tax advice; consult a CPA.
Condition & rehab AI · 12 photos
This home is in excellent condition with new finishes and improvements, making it move-in ready and highly attractive for both resale and rental markets.
Value-add opportunities
- Both Painting exterior and interior — Enhances curb appeal and interior aesthetics.
- Both Landscaping and curb appeal improvements — Enhances curb appeal and property value.
- Both New flooring in bathrooms — Improves functionality and aesthetics in bathrooms.
Renovation cost estimate screening
Value-add ROI direction
- Both Painting exterior and interior — Enhances curb appeal and interior aesthetics. ↑
- Both Landscaping and curb appeal improvements — Enhances curb appeal and property value. ↑
- Both New flooring in bathrooms — Improves functionality and aesthetics in bathrooms. ↑
ⓘ Cost ranges are severity-bucket heuristics (US national rule-of-thumb). Get contractor quotes + a written scope before underwriting a rehab budget.
Schools (NCES district)
- District
- Lincoln County School District #2
- NCES district ID
- 5604060
- Math proficiency
- 57% ▬ 0.00%
- Reading proficiency
- 67% ▬ 0.00%
- Median HH income
- $61,907
- Composite
- 53.84/100
- National rank
- #1413
- State rank
- #7 of 41 in WY
Livability — Grover
- Score
- 59/100
- State rank
- #124
- US rank
- #19957
Category grades
Schools grade is shown separately in the Schools card above.
Census & demographics
- Census place
- Grover, WY
- Population (ZIP)
- 962
Population outlook (Lincoln County) Hauer SSP2
- Today (2025)
- 19,890 people
- By 2030
- 20,275 · +1.9%
- By 2040
- 20,691 · +4.0%
- By 2050
- 20,640 · +3.8%
- By 2075
- 20,008 · +0.6%
- By 2100
- 18,122 · -8.9%
Race, ethnicity, and origin ACS 2023
- Neighborhood character
- Predominantly White (100%)
- Race & ethnicity
- White 100%
- Common ancestry
- Slovak 4%
Political lean MEDSL · Lincoln
- 2024 margin
- Solid R (+68.3) · D 15.1% · R 83.5% · Other 1.4%
- 2008→2024 swing
- -13.9pp toward R · 2008: -54.4pp · 2024: -68.3pp
- All cycles
- 2024: R+68.3 2020: R+68.2 2016: R+67.6 2012: R+68.3 2008: R+54.4
Not yet ingested
- Civics
- —
Market trends
- HPI YoY
- —
- Current HPI
- —
- Rent YoY
- —
- Metro
- —
- State GDP YoY
- —
- F500 in state
- 0
Price history
1 event — show timeline
- 2026-06-08 Listed $95,000 TBOR
Cash-flow waterfall
monthlySold comps — $/sqft
last 12 mo · ≤1 miLoading sold comps…