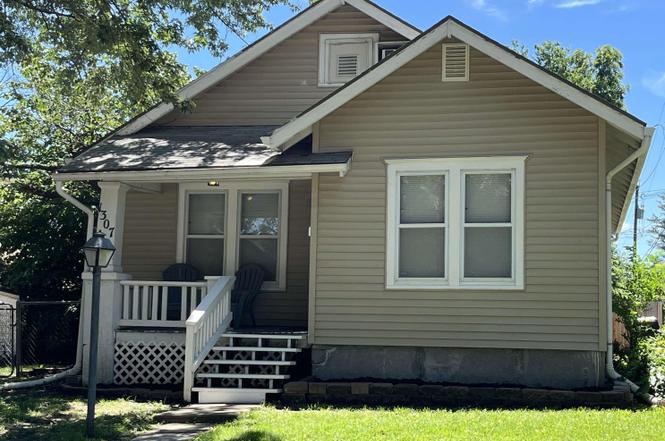
1307 SW Hampton St · Topeka, KS
Flood risk 1/10 · Minimal
- FEMA flood zone
- X (unshaded)
- Chance of flooding over 30 yrs
- 0.0%
- Est. flood insurance / yr
- $473 – $860
Fire risk 1/10 · Minimal
- Est. fire insurance / yr
- $1,154 – $2,142
Heat risk 5/10 · Moderate
- Hot days now (above 107°F)
- 7 days/yr
- Hot days in 30 yrs
- 17 days/yr
Wind risk 2/10 · Minimal
- Chance of severe wind over 30 yrs
- —
Air-quality risk 3/10 · Minor
- Unhealthy air days now
- 3 days/yr
- Unhealthy air days in 30 yrs
- 4 days/yr
Risk factors via First Street. Map © Google.
Why this score? — see what drove the C grade
The composite is a weighted blend of 9 inputs, each scored 0–100. Each bar is that input's sub-score; the figure is the points it added to the 100-point composite (weight × sub-score).
- Cash flow +20.3/30.0
- ARV discount +15.0/15.0
- DSCR +6.4/10.0
- 1% rule +4.9/10.0
- Rent growth +3.6/5.0
- Livability +3.5/5.0
- Condition / age +2.5/5.0
- Schools +1.7/10.0
- Appreciation +0.0/10.0
$99,500
🖨 Deal sheet 📄 Offer letter ✓ Due diligence
Listing remarks
Charming 3 bed, 1 bath home with hardwood floors, full unfinished basement, fenced yard, newer furnace, and a 1 car garage. Some flooring and paint updates have been completed in the last few years. It needs a little TLC. This home is one block from Washburn University, restaurants, and shopping. The home is being sold "As is. "
Key facts
- Newer furnace
- Fenced yard
- Hardwood floors
Tags
Property features AI
Exterior
- Parking: Detached 1-car garage
- Utilities: Public water; Public sewer
- Home design: Single-family residence; One-and-a-half story; Vinyl siding
- Construction: Composition roof
- Exterior features: Chain link fencing; Lot approximately 43 x 75
Interior
- Kitchen: Electric range; Refrigerator
- Flooring: Hardwood floors; Carpeted areas
- Bathrooms: 1 full bathroom
- Heating & cooling: Central air conditioning
- Interior features: Gas water heater; Unfinished basement
- Laundry & utility: Laundry in basement
Neighborhood map
What this means for you Summary
Snapshot
- This is a 2-bed/1.0-bath single-family listed at $100k.
Deal economics
- At list price, monthly cash flow is $127 ($2k/yr) — positive.
- The deal already cash-flows at list — no discount required.
- To meet the 1% rule (rent ≥ 1% of price), the offer needs to be $98k (1.3% below list).
- Recommended offer: $98k (1.3% below list) — sets the bar for 1% rule.
- Cap rate 7.8% vs local median 4.3% in Topeka — top-decile yield for the area; either an underpriced asset or a hidden risk that comps aren't pricing in. Stress-test before assuming the spread holds.
Location & tenants
- Location reads 69/100 on livability (#195 in KS) — a middle-class / working-renter tenant base. Strengths: cost of living A+, housing A+, health & safety A+; Watch: employment C-, crime F, commute F.
- Topeka Public Schools (urban): math 17% / reading 23% proficiency, ranked #158 of 169 in KS (top 94%) — low school quality limits family demand, transient renter base, plan for 1-2y turnover; 69% free/reduced lunch — lower-income household profile, screen leases tightly.
- Zoned schools: Robinson Middle School (math 10% / reading 19%, grade F, #180 of 219 statewide, top 83%, 360 students, 84% FRL); Topeka High (math 11% / reading 20%, grade F, #248 of 327 statewide, top 76%, 1,514 students, 72% FRL).
- Market conditions: Rents rising fast (+4.4%/yr); 130 active listings in the ZIP; 18 comparable units currently listed for rent nearby; rentals at typical pace (median 21d on market — plan ~3-4 weeks tenant-placement turnaround); 219 units permitted in Shawnee County in 2024 (25 in 5+ unit buildings).
Forward outlook
- Local home prices are declining (-3.0%/yr); year-one equity from $688 of loan paydown is wiped out by about $3k of value loss. Plan a longer hold.
- Shawnee County population projected to shrink 7% by 2050 — rents likely to lag national; underwrite the cash flow, not the appreciation.
Negotiation context
- Only 3 days on market — expect competitive offers; lowballing is unlikely to land.
- Current owner paid $48k; list at $100k implies a 107% gain — meaningful room to come down on a strong offer.
Risks & watch-outs
- Watch-outs: built in 1935 — expect roof / HVAC / electrical / plumbing capex.
- Climate carrying-cost: extreme-heat days projected 7→17/yr by 2055 (HVAC capex compounding) — expect insurance premiums to compound above CPI over the hold.
Questions for the listing agent
- Built in 1935 — when were the roof, HVAC, electrical panel, plumbing, and water heater last replaced?
- Is there a deadline driving the sale (1031 exchange, divorce, estate, relocation)? That informs how much negotiation room exists.
- Schools are D-rated, which usually means shorter tenancies and higher turnover. Who's the typical renter profile here, and what's been the actual vacancy rate?
- Crime grade is F in this area — have there been break-ins, vandalism, or insurance claims at this property in the last 3 years? What carrier currently insures it and at what premium?
- What's the average days-on-market for RENTAL listings here right now (not sales)? A rising rental-DOM trend means longer vacancies and softer asking-rent achievability than the comps imply.
- What's the recent tenant-quality profile in this submarket — average credit score on applications, eviction rate, late-payment / NSF rate, and stable-employment percentage? A property-management company in the area should have these aggregated.
- How much new for-sale + rental construction is in the pipeline within 1–3 miles? Heavy new supply typically softens prices + rents 12–24 months out; constrained supply supports both.
Investment metrics
- 1% rule
- 0.99% ✗
- Cap rate
- 7.83%
- Cash-on-cash
- 5.48%
- DSCR
- 1.24
- GRM
- 8.4
CMA / ARV
- ARV (on-the-fly)
- $136,004
- Comps found
- 3
Show comp detail 3 sales within ~0.75 mi
| Address | Dist | Beds/Ba | Sqft | Sold | Price | $/sf | Match |
|---|---|---|---|---|---|---|---|
| 2054 SW Lane St | 0.03mi | 2/1.0 | 1,040 (-8%) | 20mo | $90,000 | $87 | 69 |
| 1665 SW 21st St | 0.30mi | 2/1.0 | 1,176 (+5%) | 18mo | $142,500 | $121 | 64 |
| 2017 SW Wayne Ave | 0.70mi | 3/1.0 (+1) | 1,016 (-10%) | 15mo | $155,000 | $153 | 34 |
Match score weights: distance 35% · size 25% · config 20% · recency 20%. Top-matched comps best support the ARV.
Projected returns pro-forma
-3.0% appreciation · 4.39% rent growth · sell at horizon
- IRR
- -6.3%
- Equity multiple
- 0.76×
- Total profit
- $-6,638
- Equity at exit
- $14,836
- IRR
- 4.8%
- Equity multiple
- 1.38×
- Total profit
- $10,495
- Equity at exit
- $8,603
Cash invested: $27,860 (down + closing). Projections, not guarantees.
Landlord ↔ Tenant lean methodology
- Overall (STATE)
- 83 Strongly Landlord-Friendly
- State Kansas
- 83 Strongly Landlord-Friendly · R+10
- County
- — inherits STATE
- City
- — inherits STATE
ZIP-level market 66604
- Rents YoY
- 4.4%
- Active inventory
- 130
- Price-to-rent
- 8.4×
Monthly cashflow live
- Estimated rent
- $982 high interval (Pro) →
- Mortgage (P&I)
- −$522
- Tax from tax record
- −$85 /mo · $1,026/yr
- Insurance
- −$41
- HOA
- −$0
- Vacancy / Maint / Mgmt
- −$206
- Net cashflow
- $127
Break-even live
UW: 25.0% down · 7.5% · 30yr · 1.5% tax · 5.0% vac · 8.0% maint · 8.0% mgmt
Financing live
Cash to close
- Down payment
- $24,875
- Closing costs
- $2,985
- Reserves months
- —
- Total cash needed
- —
Loan-product check · same deal, 3 products live
Conventional
25% down · 7.5% · 30yr
- Down + closing
- —
- Monthly P&I
- —
- Monthly cashflow
- —
- DSCR
- —
- Eligible?
- —
Personal DTI + credit; lowest rate.
DSCR
20% down · 8.5% · 30yr
- Down + closing
- —
- Monthly P&I
- —
- Monthly cashflow
- —
- DSCR
- —
- Eligible?
- —
No personal income docs; deal must DSCR.
Hard money
10% down · 12.0% · 12mo
- Down + closing
- —
- Monthly P&I
- —
- Monthly cashflow
- —
- DSCR
- —
- Eligible?
- —
Short-term bridge; refi at stabilization.
Rent comps 18 comps
| Address | Beds | Baths | Sqft | Rent | $/sqft | DOM | Units | Dist |
|---|---|---|---|---|---|---|---|---|
| 1900 SW Washburn Ave Topeka, KS | 2.0 | 1.0 | 883 | $890 | $1.01 | 21d | 1 | 0.18mi |
| 1116 SW 18th St Topeka, KS | 3.0 | 1.0 | 1105 | $1,175 | $1.06 | 21d | 1 | 0.35mi |
| 2130 SW Fillmore St Topeka, KS | 2.0 | 1.0 | 800 | $800 | $1.00 | 21d | 1 | 0.40mi |
| 1436 SW Byron St Topeka, KS | 2.0 | 1.0 | 900 | $720 | $0.80 | 21d | 1 | 0.50mi |
| 1316 SW 27th St Topeka, KS | 2.0 | 2.0 | 1456 | $1,150 | $0.79 | 21d | 1 | 0.55mi |
| 1414 SW 27th St Topeka, KS | 2.0 | 1.0 | 908 | $825 | $0.91 | 21d | 1 | 0.58mi |
| 1510 SW Lane St Topeka, KS | 1.0 | 1.0 | 750 | $675 | $0.90 | 21d | 1 | 0.59mi |
| 1515 SW 15th St Topeka, KS | 1.0 | 1.0 | 775 | $700 | $0.90 | 21d | 1 | 0.61mi |
| 2045 SW Macvicar Ave Topeka, KS | 2.0 | 2.0 | 860 | $875 | $1.02 | 21d | 1 | 0.63mi |
| 2409 SW 21st St Topeka, KS | 3.0 | 1.0 | 890 | $850 | $0.96 | 21d | 1 | 0.65mi |
| 1624 SW Polk St Topeka, KS | 3.0 | 2.0 | 1288 | $1,350 | $1.05 | 21d | 1 | 0.66mi |
| 1268 SW Western Ave Unit 1A Topeka, KS | 2.0 | 1.0 | 1404 | $1,000 | $0.71 | 21d | 1 | 0.93mi |
| 512 SW 14th St Topeka, KS | 2.0 | 1.0 | 815 | $895 | $1.10 | 21d | 1 | 0.95mi |
| 1438 SW Van Buren St Apt 4 Topeka, KS | 2.0 | 1.0 | 700 | $825 | $1.18 | 21d | 1 | 1.04mi |
| 1623 SW Campbell Ave Topeka, KS | 2.0 | 1.0 | 828 | $1,100 | $1.33 | 21d | 1 | 1.16mi |
| 501 SE 25th St Topeka, KS | 3.0 | 1.5 | 1200 | $1,295 | $1.08 | 21d | 1 | 1.42mi |
| 1027 SW Woodward Ave Topeka, KS | 3.0 | 1.0 | 864 | $1,195 | $1.38 | 21d | 1 | 1.42mi |
| 1724 SE Pennsylvania Ave Unit B Topeka, KS | 2.0 | 1.0 | 960 | $850 | $0.89 | 21d | 1 | 1.50mi |
Listing history 4 events
-
2026-06-19days on market $99,500 Active 3 DOM
-
2026-06-18days on market $99,500 Active 2 DOM
-
2026-06-17remarks 330-char remark
-
2026-06-17$99,500 Active 1 DOM
ⓘ Source: listings_history table (triggers on properties + properties_extension) + one-shot
backfill from property_details.listing_events for pre-trigger history.
Tax reassessment forecast KS · Resets to sale price
- Current annual tax
- $1,026 · $85/mo
- Projected year-2 tax
- $1,403 · $117/mo
- Expected delta
- +$377/yr (+$31/mo · 36.8%)
ⓘ Screening estimate from a state-policy table — verify with the county assessor before closing.
Climate risk First Street
- Flood 1/10 Low FEMA zone X (unshaded) · 0% chance over 30 yrs
- Wildfire 1/10 Low
- Heat 5/10 Major 7 d/yr ≥107°F today · 17 d/yr by 30 yrs out
- Wind 2/10 Low
- Air quality 3/10 Moderate 3 unhealthy d/yr today · 4 by 30 yrs out
Nearby sold comps map
Loading sold comps map…
Walkable amenities ~0.75 mi
Loading nearby amenities…
Taxation est. · year 1
- Rental income
- $11,786
- − Mortgage interest
- −$5,574
- − Property taxes
- −$1,026
- − Insurance
- −$498
- − Repairs & maintenance
- −$943
- − Management
- −$943
- − Depreciation
- −$2,895
- Taxable loss
- −$91
- Est. tax savings @ 24.0%
- +$22
- After-tax cash flow
- $1,548/yr
For passive investors: Depreciation is non-cash, so a rental often shows a tax loss while cash-flowing — sheltering income. Rental losses are passive: they offset passive income freely, and up to $25,000/yr can offset ordinary (W-2) income if you actively participate and your MAGI is under $100k (phasing out to $0 by $150k); unused losses carry forward. On sale, claimed depreciation is recaptured at up to 25%, and gains may owe capital-gains tax (a 1031 exchange can defer both). Figures are a year-1 estimate at your 24.0% rate — not tax advice; consult a CPA.
Schools (NCES district)
- District
- Topeka Public Schools
- NCES district ID
- 2012260
- Math proficiency
- 17% ▼ -8.00%
- Reading proficiency
- 23% ▼ -2.00%
- Median HH income
- $37,405
- Composite
- 16.69/100
- National rank
- #9167
- State rank
- #158 of 169 in KS
Livability — Topeka
- Score
- 69/100
- State rank
- #195
- US rank
- #8848
Category grades
Schools grade is shown separately in the Schools card above.
Census & demographics
- Census place
- Topeka, KS
- County
- Shawnee County · 118,130 people
- City population
- 118,130
- Metro
- Topeka, KS
- Population (ZIP)
- 23,006
- Household income
- $60,874
- Rent vs Own
- Severe rent burden
- 1192.0
Population outlook (Shawnee County) Hauer SSP2
- Today (2025)
- 179,277 people
- By 2030
- 177,762 · -0.8%
- By 2040
- 172,341 · -3.9%
- By 2050
- 166,330 · -7.2%
- By 2075
- 152,417 · -15.0%
- By 2100
- 134,782 · -24.8%
Race, ethnicity, and origin ACS 2023
- Neighborhood character
- Predominantly White (70%)
- Race & ethnicity
- White 70% Hispanic / Latino 15% Two or more races 11% Black 6% Asian 1%
- Hispanic origin (detail)
- Mexican 12%
- Common ancestry
- Slovak 2% Lithuanian 2% Romanian 1%
- Foreign-born
- 4% · Canada, China
- Languages at home
- 94% English-only · Spanish 4% Other Asian/Pacific 1% Other Indo-European 1%
Political lean MEDSL · Shawnee
- 2024 margin
- Toss-up / Even · D 49.3% · R 48.8% · Other 2.0%
- 2008→2024 swing
- +0.8pp no change · 2008: -0.3pp · 2024: 0.5pp
- All cycles
- 2024: D+0.5 2020: D+3.0 2016: R+2.8 2012: R+1.7 2008: R+0.3
Not yet ingested
- Civics
- —
Market trends
- HPI YoY
- ▼ -151.78%
- Current HPI
- 227.637
- Rent YoY
- ▲ 4.39%
- Metro
- Topeka, KS
- State GDP YoY
- —
- F500 in state
- 0
Price history
+107.3% since first listed5 events — show timeline
- 2026-06-16 Listed $99,500 Sunflower MLS as distributed by MLS GRID
- 2019-08-20 Sold (Public Records) — Public Records
- 2018-05-14 Sold (Public Records) — Public Records
- 2001-03-01 Sold (Public Records) — Public Records
- 2001-03-01 Sold (Public Records) $48,000 Public Records
Property tax history
+3.7%/yrLatest (2025): $1,026 · +6.8% YoY. Source: county tax records.
Cash-flow waterfall
monthlySold comps — $/sqft
last 12 mo · ≤1 miLoading sold comps…