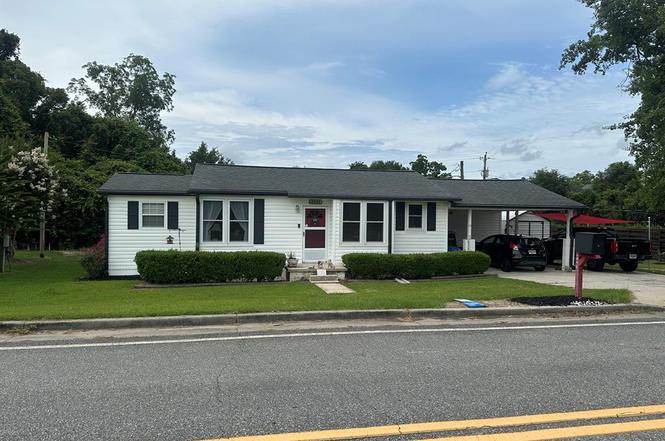
4046 Old Pine Rd · Bemiss, GA
Flood risk 7/10 · Major
- FEMA flood zone
- X (unshaded)
- Chance of flooding over 30 yrs
- 0.97%
- Est. flood insurance / yr
- $507 – $1,088
Fire risk 7/10 · Major
- Est. fire insurance / yr
- $963 – $1,789
Heat risk 7/10 · Major
- Hot days now (above 108°F)
- 7 days/yr
- Hot days in 30 yrs
- 19 days/yr
Wind risk 8/10 · Major
- Chance of severe wind over 30 yrs
- 99.0%
Air-quality risk 6/10 · Moderate
- Unhealthy air days now
- 12 days/yr
- Unhealthy air days in 30 yrs
- 14 days/yr
Risk factors via First Street. Map © Google.
Why this score? — see what drove the D grade
The composite is a weighted blend of 9 inputs, each scored 0–100. Each bar is that input's sub-score; the figure is the points it added to the 100-point composite (weight × sub-score).
- Cash flow +16.5/30.0
- DSCR +5.1/10.0
- ARV discount +5.1/15.0
- Schools +4.7/10.0
- Rent growth +3.8/5.0
- 1% rule +3.2/10.0
- Livability +2.5/5.0
- Condition / age +2.5/5.0
- Appreciation +0.0/10.0
$164,900
🖨 Deal sheet (PDF) 📄 Offer letter ✓ Due diligence
Listing remarks
If you are looking for something small, simple, and economic but still cozy and nice then this little gem in northern Lowndes county just a stones throw away from Moody Air Force Base is waiting for you! Just under 1000 SQFT with 2bed1bath this little home is perfect for the newly retired or the newly wed. Property is on county water but also comes with a well and for those who are looking for a place to be their home base there is a RV pad and 100 amp hook-up. Roof is less than 5 years old and HVAC is almost new. Come see it today!!!
Key facts
- Moody air force base
- County water
- 200 amp hook-up
Tags
Property features AI
Exterior
- Home design: Single-family residence; One story
- Construction: Vinyl siding
- Exterior features: Fenced yard; Shingle roof
Interior
- Flooring: Carpet; Tile
- Bathrooms: 1 full bathroom
- Interior features: Dishwasher; Dryer; Refrigerator; Washer
- Laundry & utility: Dedicated laundry room
Neighborhood map
What this means for you Summary
Snapshot
- This is a 2-bed/1.0-bath single-family listed at $165k.
Deal economics
- At list price, monthly cash flow is $29 ($347/yr) — positive.
- The deal already cash-flows at list — no discount required.
- To meet the 1% rule (rent ≥ 1% of price), the offer needs to be $135k (17.8% below list).
- Recommended offer: $135k (17.8% below list) — sets the bar for 1% rule.
- Cap rate 7.0% vs local median 4.7% in Bemiss — top-decile yield for the area; either an underpriced asset or a hidden risk that comps aren't pricing in. Stress-test before assuming the spread holds.
Location & tenants
- Location reads: area grade D — affects rentability + tenant quality, not the cash-flow math above.
- Lowndes County (rural): math 59% / reading 52% proficiency, ranked #8 of 174 in GA (top 5%) — acceptable for families but not a draw, mixed tenant base, ~2y average lease.
- Zoned schools: Dewar Elementary (math 61% / reading 47%, grade C, #204 of 1,228 statewide, top 17%, 859 students, 50% FRL); Pine Grove Middle School (math 56% / reading 57%, grade B, #48 of 470 statewide, top 10%, 742 students, 50% FRL); Lowndes High School (math 69% / reading 51%, grade C+, #14 of 424 statewide, top 3%, 3,201 students, 39% FRL) — zoned schools at 46% FRL track the district average.
- Market conditions: Rents rising fast (+5.1%/yr); 233 active listings in the ZIP; 2 comparable units currently listed for rent nearby; solid renter incomes; 896 units permitted in Lowndes County in 2024 (0 in 5+ unit buildings).
Forward outlook
- Local home prices are declining (-3.0%/yr); year-one equity from $1k of loan paydown is wiped out by about $5k of value loss. Plan a longer hold.
- Lowndes County population projected at +10% by 2050 — modest demand growth; plan on rents tracking national, not racing it.
Negotiation context
- Only 11 days on market — expect competitive offers; lowballing is unlikely to land.
- Current owner paid $65k; list at $165k implies a 154% gain — meaningful room to come down on a strong offer.
Risks & watch-outs
- Watch-outs: flood insurance adds $66/mo.
- Climate carrying-cost: major flood risk; severe wind risk, 99% chance of damaging wind over 30y; major wildfire risk; extreme-heat days projected 7→19/yr by 2055 (HVAC capex compounding) — expect insurance premiums to compound above CPI over the hold.
Questions for the listing agent
- What's the actual annual flood-insurance premium (NFIP or private), and is the property in a SFHA with mandatory coverage?
- Is there a deadline driving the sale (1031 exchange, divorce, estate, relocation)? That informs how much negotiation room exists.
- The area grade is low — what's the realistic commute time and amenity access for the typical tenant pool here? Any planned neighborhood developments (good or bad) we should know about?
- What's the average days-on-market for RENTAL listings here right now (not sales)? A rising rental-DOM trend means longer vacancies and softer asking-rent achievability than the comps imply.
- What's the recent tenant-quality profile in this submarket — average credit score on applications, eviction rate, late-payment / NSF rate, and stable-employment percentage? A property-management company in the area should have these aggregated.
- How much new for-sale + rental construction is in the pipeline within 1–3 miles? Heavy new supply typically softens prices + rents 12–24 months out; constrained supply supports both.
Investment metrics
- 1% rule
- 0.82% ✗
- Cap rate
- 6.99%
- Cash-on-cash
- 2.48%
- DSCR
- 1.11
- GRM
- 10.1
CMA / ARV
- ARV (on-the-fly)
- $156,450
- Comps found
- 2
Show comp detail 2 sales within ~0.75 mi
| Address | Dist | Beds/Ba | Sqft | Sold | Price | $/sf | Match |
|---|---|---|---|---|---|---|---|
| 4022 Sandy Run Dr | 0.69mi | 2/1.0 | 978 (+9%) | 3mo | $164,900 | $169 | 50 |
| 4020 Fiddlers Bend Dr | 0.68mi | 2/1.0 | 936 (+5%) | 15mo | $163,500 | $175 | 48 |
Match score weights: distance 35% · size 25% · config 20% · recency 20%. Top-matched comps best support the ARV.
Projected returns pro-forma
-3.0% appreciation · 5.07% rent growth · sell at horizon
- IRR
- -13.0%
- Equity multiple
- 0.52×
- Total profit
- $-22,041
- Equity at exit
- $24,587
- IRR
- -1.4%
- Equity multiple
- 0.90×
- Total profit
- $-4,658
- Equity at exit
- $14,258
Cash invested: $46,172 (down + closing). Projections, not guarantees.
Landlord ↔ Tenant lean methodology
- Overall (STATE)
- 90 Strongly Landlord-Friendly
- State Georgia
- 90 Strongly Landlord-Friendly · R+3
- County
- — inherits STATE
- City
- — inherits STATE
ZIP-level market 31605
- Home prices YoY
- -11.5%
- Rents YoY
- 5.1%
- Active inventory
- 233
- Price-to-rent
- 10.1×
Monthly cashflow live
- Estimated rent
- $1,355 medium interval (Pro) →
- Mortgage (P&I)
- −$865
- Tax from tax record
- −$41 /mo · $497/yr
- Insurance
- −$69
- Flood insurance flood zone
- −$66 /mo · $798/yr
- HOA
- −$0
- Vacancy / Maint / Mgmt
- −$284
- Net cashflow
- $29
Break-even live
Sensitivity live
| Price | -10% $122 | -5% $76 | +0% $29 | +5% $-18 | +10% $-64 |
|---|---|---|---|---|---|
| Rent | -10% $-78 | -5% $-25 | +0% $29 | +5% $82 | +10% $136 |
| Rate | -1.0pp $112 | -0.5pp $71 | base $29 | +0.5pp $-14 | +1.0pp $-57 |
UW: 25.0% down · 7.5% · 30yr · 1.5% tax · 5.0% vac · 8.0% maint · 8.0% mgmt
Financing live
Cash to close
- Down payment
- $41,225
- Closing costs
- $4,947
- Reserves months
- —
- Total cash needed
- —
Loan-product check · same deal, 3 products live
Conventional
25% down · 7.5% · 30yr
- Down + closing
- —
- Monthly P&I
- —
- Monthly cashflow
- —
- DSCR
- —
- Eligible?
- —
Personal DTI + credit; lowest rate.
DSCR
20% down · 8.5% · 30yr
- Down + closing
- —
- Monthly P&I
- —
- Monthly cashflow
- —
- DSCR
- —
- Eligible?
- —
No personal income docs; deal must DSCR.
Hard money
10% down · 12.0% · 12mo
- Down + closing
- —
- Monthly P&I
- —
- Monthly cashflow
- —
- DSCR
- —
- Eligible?
- —
Short-term bridge; refi at stabilization.
Rent comps 2 comps
| Address | Beds | Baths | Sqft | Rent | $/sqft | DOM | Units | Dist |
|---|---|---|---|---|---|---|---|---|
| 3553 Studstill Rd Valdosta, GA | 2.0 | 2.0 | 1040 | $1,000 | $0.96 | 23d | 1 | 0.94mi |
| 3491 Studstill Rd Unit A Valdosta, GA | 2.0 | 2.0 | 1007 | $1,200 | $1.19 | 45d | 1 | 1.12mi |
Listing history 10 events
-
2026-06-21days on market $164,900 Active 11 DOM
-
2026-06-19days on market $164,900 Active 9 DOM
-
2026-06-18days on market $164,900 Active 8 DOM
-
2026-06-17days on market $164,900 Active 7 DOM
-
2026-06-17remarks 541-char remark
-
2026-06-16days on market $164,900 Active 6 DOM
-
2026-06-15days on market $164,900 Active 5 DOM
-
2026-06-14days on market $164,900 Active 3 DOM
-
2026-06-13remarks 487-char remark
-
2026-06-13$164,900 Active 2 DOM
ⓘ Source: listings_history table (triggers on properties + properties_extension) + one-shot
backfill from property_details.listing_events for pre-trigger history.
Tax reassessment forecast GA · Resets to sale price
- Current annual tax
- $497 · $41/mo
- Projected year-2 tax
- $1,517 · $126/mo
- Expected delta
- +$1,020/yr (+$85/mo · 205.3%)
ⓘ Screening estimate from a state-policy table — verify with the county assessor before closing.
Climate risk First Street
- Flood 7/10 Severe FEMA zone X (unshaded) · 97% chance over 30 yrs
- Wildfire 7/10 Severe
- Heat 7/10 Severe 7 d/yr ≥108°F today · 19 d/yr by 30 yrs out
- Wind 8/10 Severe 99% chance of damaging wind over 30 yrs
- Air quality 6/10 Major 12 unhealthy d/yr today · 14 by 30 yrs out
Nearby sold comps map
Loading sold comps map…
Walkable amenities ~0.75 mi
Loading nearby amenities…
Taxation est. · year 1
- Rental income
- $16,256
- − Mortgage interest
- −$9,237
- − Property taxes
- −$497
- − Insurance
- −$1,622
- − Repairs & maintenance
- −$1,301
- − Management
- −$1,301
- − Depreciation
- −$4,797
- Taxable loss
- −$2,498
- Est. tax savings @ 24.0%
- +$599
- After-tax cash flow
- $946/yr
For passive investors: Depreciation is non-cash, so a rental often shows a tax loss while cash-flowing — sheltering income. Rental losses are passive: they offset passive income freely, and up to $25,000/yr can offset ordinary (W-2) income if you actively participate and your MAGI is under $100k (phasing out to $0 by $150k); unused losses carry forward. On sale, claimed depreciation is recaptured at up to 25%, and gains may owe capital-gains tax (a 1031 exchange can defer both). Figures are a year-1 estimate at your 24.0% rate — not tax advice; consult a CPA.
Schools (NCES district)
- District
- Lowndes County
- NCES district ID
- 1303390
- Math proficiency
- 59% ▼ -1.00%
- Reading proficiency
- 52% ▼ -2.00%
- Median HH income
- $48,221
- Composite
- 47.21/100
- National rank
- #2317
- State rank
- #8 of 174 in GA
Livability — Bemiss
No livability data for this city. (Only ~50 U.S. cities are tracked.)
Census & demographics
- Census place
- Bemiss, GA
- County
- Lowndes County · 107,801 people
- City population
- 24,280
- Metro
- Valdosta, GA
- Population (ZIP)
- 24,829
- Household income
- $79,156
- Rent vs Own
- Severe rent burden
- 642.0
Population outlook (Lowndes County) Hauer SSP2
- Today (2025)
- 120,348 people
- By 2030
- 123,469 · +2.6%
- By 2040
- 128,482 · +6.8%
- By 2050
- 131,907 · +9.6%
- By 2075
- 139,080 · +15.6%
- By 2100
- 133,649 · +11.1%
Race, ethnicity, and origin ACS 2023
- Neighborhood character
- Diverse neighborhood (Simpson 0.58)
- Race & ethnicity
- White 58% Black 27% Two or more races 7% Hispanic / Latino 7% Asian 2%
- Hispanic origin (detail)
- Mexican 3% Puerto Rican 3%
- Common ancestry
- Italian 2% Slovak 2% Lithuanian 2%
- Foreign-born
- 4% · Canada, South Korea, Vietnam
- Languages at home
- 93% English-only · Spanish 3% German/W. Germanic 1%
Political lean MEDSL · Lowndes
- 2024 margin
- R (+18.0) · D 40.8% · R 58.8%
- 2008→2024 swing
- -8.6pp toward R · 2008: -9.4pp · 2024: -18.0pp
- All cycles
- 2024: R+18.0 2020: R+12.0 2016: R+18.2 2012: R+10.5 2008: R+9.4
Not yet ingested
- Civics
- —
Market trends
- HPI YoY
- ▼ -24.74%
- Current HPI
- 189.8471
- Rent YoY
- ▲ 5.07%
- Metro
- Valdosta, GA
- State GDP YoY
- ▲ 2.66%
- F500 in state
- 28
Industry mix (Fortune 500 HQ in GA)
| Industry | F500 HQs | Revenue |
|---|---|---|
| Paper / Packaging | 2 | $29B |
|
||
| Retail | 1 | $160B |
|
||
| Transportation / Logistics | 1 | $91B |
|
||
| Airlines | 1 | $62B |
|
||
| Consumer Goods | 1 | $47B |
|
||
| Utilities | 1 | $25B |
|
||
Price history
+371.1% since first listed3 events — show timeline
- 2026-06-10 Listed $164,900 SGMLS
- 2019-02-14 Sold (Public Records) $65,000 Public Records
- 2015-06-24 Sold (Public Records) $35,000 Public Records
Property tax history
+7.4%/yrLatest (2024): $497 · +302.9% YoY. Source: county tax records.
Cash-flow waterfall
monthlySold comps — $/sqft
last 12 mo · ≤1 miLoading sold comps…