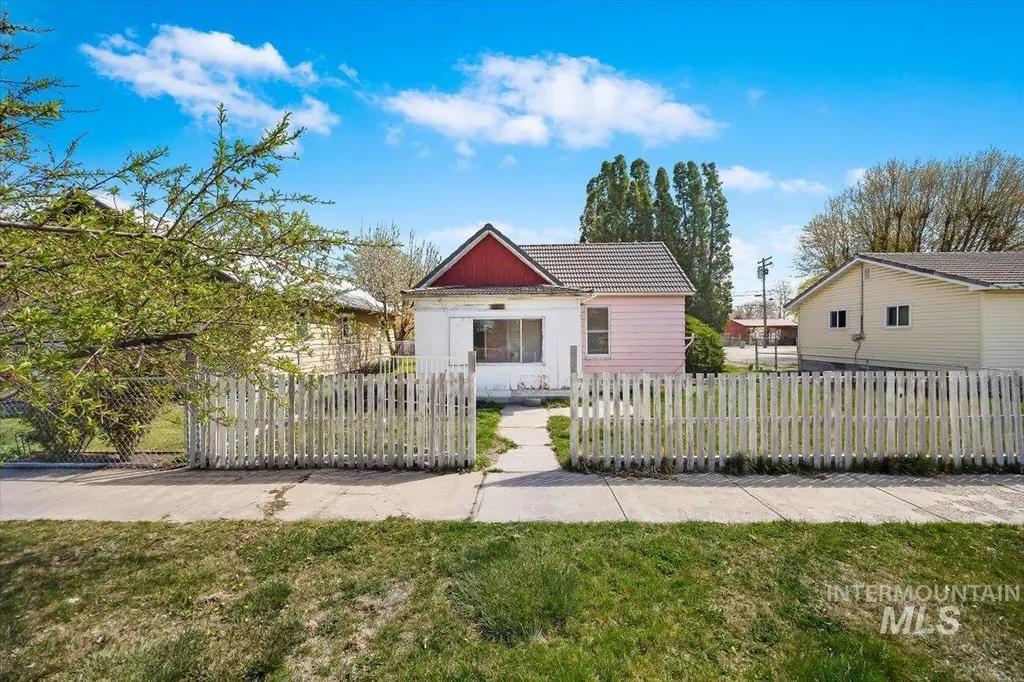
1411 Almo Ave · Burley, ID
Flood risk 1/10 · Minimal
- FEMA flood zone
- X
- Chance of flooding over 30 yrs
- 0.0%
- Est. flood insurance / yr
- $507 – $1,088
Fire risk 1/10 · Minimal
- Est. fire insurance / yr
- $584 – $1,086
Heat risk 3/10 · Minor
- Hot days now (above 93°F)
- 7 days/yr
- Hot days in 30 yrs
- 20 days/yr
Wind risk 1/10 · Minimal
- Chance of severe wind over 30 yrs
- —
Air-quality risk 7/10 · Major
- Unhealthy air days now
- 12 days/yr
- Unhealthy air days in 30 yrs
- 13 days/yr
Risk factors via First Street. Map © Google.
Why this score? — see what drove the C grade
The composite is a weighted blend of 9 inputs, each scored 0–100. Each bar is that input's sub-score; the figure is the points it added to the 100-point composite (weight × sub-score).
- Cash flow +23.1/30.0
- ARV discount +7.5/15.0
- DSCR +7.4/10.0
- 1% rule +5.2/10.0
- Livability +3.7/5.0
- Schools +3.6/10.0
- Rent growth +2.5/5.0
- Condition / age +2.5/5.0
- Appreciation +0.0/10.0
$125,000
🖨 Deal sheet 📄 Offer letter ✓ Due diligence
Listing remarks
Investor special in the heart of Burley, Idaho! This 2-bedroom, 1-bath home is full of potential and ready for your vision. Whether you’re a seasoned flipper or looking to add a strong rental to your portfolio, this property checks the boxes. Located just minutes from schools, shopping, and everyday conveniences, it offers the kind of location tenants and future buyers love. With solid bones and endless possibilities to update and add value, this is your chance to turn opportunity into profit. Don’t miss out on this affordable entry into a growing market—properties like this don’t last long!
Key facts
- 6,098 sq ft lot
- Built 1918
- Listed 16 days
Neighborhood map
What this means for you Summary
Snapshot
- This is a 2-bed/1.0-bath other listed at $125k.
Deal economics
- At list price, monthly cash flow is $224 ($3k/yr) — positive.
- The deal already cash-flows at list — no discount required.
- Meets the 1% rule at list price ($1k rent vs $125k).
- Recommended offer: $123k (1.5% below list) — sets the bar for market timing.
- Cap rate 8.4% vs local median 2.3% in Burley — top-decile yield for the area; either an underpriced asset or a hidden risk that comps aren't pricing in. Stress-test before assuming the spread holds.
Location & tenants
- Location reads 74/100 on livability (#32 in ID, #4,536 nationally) — a middle-class / working-renter tenant base. Strengths: cost of living A+, housing A+, health & safety A+; Watch: employment D+, amenities F, commute F.
- Cassia County Joint District (town): math 37% / reading 47% proficiency, ranked #59 of 92 in ID (top 64%) — families likely to look elsewhere, expect single-tenant / working-renter base with shorter leases.
- Zoned schools: Burley Senior High School (math 26% / reading 47%, grade F, #105 of 169 statewide, top 63%, 1,055 students, 39% FRL) — zoned schools at 39% FRL track the district average.
- Market conditions: 117 active listings in the ZIP; 140 units permitted in Cassia County in 2024 (0 in 5+ unit buildings).
Forward outlook
- Local home prices are declining (-3.0%/yr); year-one equity from $864 of loan paydown is wiped out by about $4k of value loss. Plan a longer hold.
- Cassia County population projected at +6% by 2050 — modest demand growth; plan on rents tracking national, not racing it.
Negotiation context
- It's been on market 16 days — a 2% lower offer ($123k) is reasonable based on typical stale-listing flexibility.
Risks & watch-outs
- Watch-outs: built in 1918 — expect roof / HVAC / electrical / plumbing capex.
Questions for the listing agent
- Built in 1918 — when were the roof, HVAC, electrical panel, plumbing, and water heater last replaced?
- Is there a deadline driving the sale (1031 exchange, divorce, estate, relocation)? That informs how much negotiation room exists.
- Schools are D-rated, which usually means shorter tenancies and higher turnover. Who's the typical renter profile here, and what's been the actual vacancy rate?
- What's the average days-on-market for RENTAL listings here right now (not sales)? A rising rental-DOM trend means longer vacancies and softer asking-rent achievability than the comps imply.
- What's the recent tenant-quality profile in this submarket — average credit score on applications, eviction rate, late-payment / NSF rate, and stable-employment percentage? A property-management company in the area should have these aggregated.
- How much new for-sale + rental construction is in the pipeline within 1–3 miles? Heavy new supply typically softens prices + rents 12–24 months out; constrained supply supports both.
Investment metrics
- 1% rule
- 1.02% ✓
- Cap rate
- 8.44%
- Cash-on-cash
- 7.69%
- DSCR
- 1.34
- GRM
- 8.2
CMA / ARV
No comps found within radius.
Projected returns pro-forma
-3.0% appreciation · 3.0% rent growth · sell at horizon
- IRR
- -4.6%
- Equity multiple
- 0.83×
- Total profit
- $-6,010
- Equity at exit
- $18,638
- IRR
- 5.1%
- Equity multiple
- 1.37×
- Total profit
- $13,021
- Equity at exit
- $10,808
Cash invested: $35,000 (down + closing). Projections, not guarantees.
Landlord ↔ Tenant lean methodology
- Overall (STATE)
- 91 Strongly Landlord-Friendly
- State Idaho
- 91 Strongly Landlord-Friendly · R+18
- County
- — inherits STATE
- City
- — inherits STATE
ZIP-level market 83318
- Home prices YoY
- -25.2%
- Active inventory
- 117
- Price-to-rent
- 8.2×
Monthly cashflow live
- Estimated rent
- $1,272 medium interval (Pro) →
- Mortgage (P&I)
- −$656
- Tax from tax record
- −$73 /mo · $875/yr
- Insurance
- −$52
- HOA
- −$0
- Vacancy / Maint / Mgmt
- −$267
- Net cashflow
- $224
Break-even live
UW: 25.0% down · 7.5% · 30yr · 1.5% tax · 5.0% vac · 8.0% maint · 8.0% mgmt
Financing live
Cash to close
- Down payment
- $31,250
- Closing costs
- $3,750
- Reserves months
- —
- Total cash needed
- —
Loan-product check · same deal, 3 products live
Conventional
25% down · 7.5% · 30yr
- Down + closing
- —
- Monthly P&I
- —
- Monthly cashflow
- —
- DSCR
- —
- Eligible?
- —
Personal DTI + credit; lowest rate.
DSCR
20% down · 8.5% · 30yr
- Down + closing
- —
- Monthly P&I
- —
- Monthly cashflow
- —
- DSCR
- —
- Eligible?
- —
No personal income docs; deal must DSCR.
Hard money
10% down · 12.0% · 12mo
- Down + closing
- —
- Monthly P&I
- —
- Monthly cashflow
- —
- DSCR
- —
- Eligible?
- —
Short-term bridge; refi at stabilization.
Listing history 2 events
-
2026-04-22status Pending
-
2026-04-06$125,000 Active
ⓘ Source: listings_history table (triggers on properties + properties_extension) + one-shot
backfill from property_details.listing_events for pre-trigger history.
Tax reassessment forecast ID · Resets to sale price
- Current annual tax
- $875 · $73/mo
- Projected year-2 tax
- $875 · $73/mo
- Expected delta
- $0/yr ($0/mo · 0.0%)
ⓘ Screening estimate from a state-policy table — verify with the county assessor before closing.
Climate risk First Street
- Flood 1/10 Low FEMA zone X · 0% chance over 30 yrs
- Wildfire 1/10 Low
- Heat 3/10 Moderate 7 d/yr ≥93°F today · 20 d/yr by 30 yrs out
- Wind 1/10 Low
- Air quality 7/10 Severe 12 unhealthy d/yr today · 13 by 30 yrs out
Nearby sold comps map
Loading sold comps map…
Walkable amenities ~0.75 mi
Loading nearby amenities…
Taxation est. · year 1
- Rental income
- $15,261
- − Mortgage interest
- −$7,002
- − Property taxes
- −$875
- − Insurance
- −$625
- − Repairs & maintenance
- −$1,221
- − Management
- −$1,221
- − Depreciation
- −$3,636
- Taxable income
- $681
- Est. tax owed @ 24.0%
- −$163
- After-tax cash flow
- $2,527/yr
For passive investors: Depreciation is non-cash, so a rental often shows a tax loss while cash-flowing — sheltering income. Rental losses are passive: they offset passive income freely, and up to $25,000/yr can offset ordinary (W-2) income if you actively participate and your MAGI is under $100k (phasing out to $0 by $150k); unused losses carry forward. On sale, claimed depreciation is recaptured at up to 25%, and gains may owe capital-gains tax (a 1031 exchange can defer both). Figures are a year-1 estimate at your 24.0% rate — not tax advice; consult a CPA.
Schools (NCES district)
- District
- Cassia County Joint District
- NCES district ID
- 1600660
- Math proficiency
- 37% ▬ 0.00%
- Reading proficiency
- 47% ▲ 4.00%
- Median HH income
- $43,734
- Composite
- 35.52/100
- National rank
- #4910
- State rank
- #59 of 92 in ID
Livability — Burley
- Score
- 74/100
- State rank
- #32
- US rank
- #4536
Category grades
Schools grade is shown separately in the Schools card above.
Census & demographics
- Census place
- Burley, ID
- County
- Cassia County · 19,459 people
- City population
- 19,459
- Metro
- Burley, ID
- Population (ZIP)
- 19,459
- Household income
- $71,282
- Rent vs Own
- Severe rent burden
- 367.0
Population outlook (Cassia County) Hauer SSP2
- Today (2025)
- 24,254 people
- By 2030
- 24,545 · +1.2%
- By 2040
- 25,268 · +4.2%
- By 2050
- 25,828 · +6.5%
- By 2075
- 26,971 · +11.2%
- By 2100
- 26,501 · +9.3%
Race, ethnicity, and origin ACS 2023
- Neighborhood character
- Majority White (60%)
- Race & ethnicity
- White 60% Hispanic / Latino 34% Two or more races 15% Native American 1%
- Hispanic origin (detail)
- Mexican 30%
- Common ancestry
- Slovak 2% Italian 2% German 1%
- Foreign-born
- 13% · Canada
- Languages at home
- 76% English-only · Spanish 22%
Political lean MEDSL · Cassia
- 2024 margin
- Solid R (+69.1) · D 14.2% · R 83.3% · Other 2.5%
- 2008→2024 swing
- -5.6pp toward R · 2008: -63.5pp · 2024: -69.1pp
- All cycles
- 2024: R+69.1 2020: R+66.9 2016: R+60.1 2012: R+72.2 2008: R+63.5
Not yet ingested
- Civics
- —
Market trends
- HPI YoY
- ▼ -90.89%
- Current HPI
- 269.8289
- Rent YoY
- —
- Metro
- Burley, ID
- State GDP YoY
- ▲ 4.51%
- F500 in state
- 6
Industry mix (Fortune 500 HQ in ID)
| Industry | F500 HQs | Revenue |
|---|---|---|
| Retail | 1 | $79B |
|
||
| Technology | 1 | $25B |
|
||
| Food / Agriculture | 1 | $6B |
|
||
Price history
2 events — show timeline
- 2026-04-22 Pending — IMLS
- 2026-04-06 Listed $125,000 IMLS
Property tax history
+1.3%/yrLatest (2025): $875 · +20.0% YoY. Source: county tax records.
Cash-flow waterfall
monthlySold comps — $/sqft
last 12 mo · ≤1 miLoading sold comps…