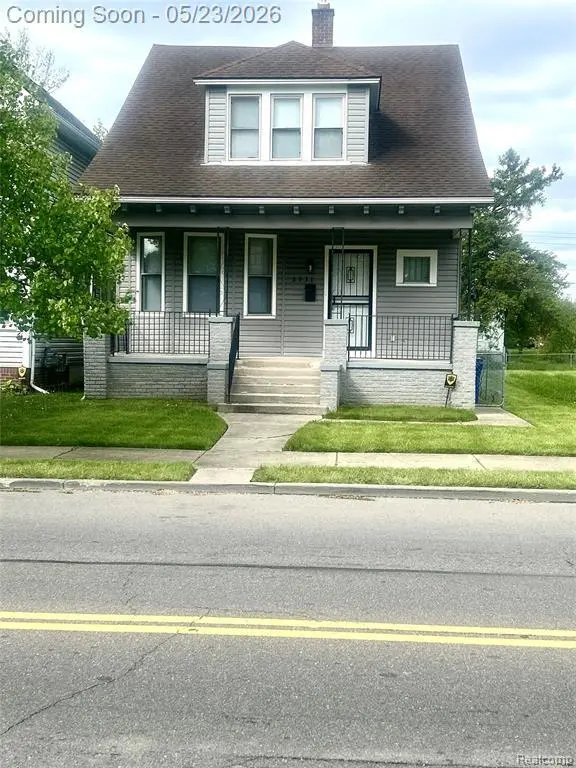
5931 N McClellan St · Detroit, MI
Flood risk 1/10 · Minimal
- FEMA flood zone
- X (unshaded)
- Chance of flooding over 30 yrs
- 0.0%
- Est. flood insurance / yr
- $473 – $860
Fire risk 1/10 · Minimal
- Est. fire insurance / yr
- $784 – $1,456
Heat risk 3/10 · Minor
- Hot days now (above 96°F)
- 7 days/yr
- Hot days in 30 yrs
- 15 days/yr
Wind risk 2/10 · Minimal
- Chance of severe wind over 30 yrs
- —
Air-quality risk 3/10 · Minor
- Unhealthy air days now
- 2 days/yr
- Unhealthy air days in 30 yrs
- 5 days/yr
Risk factors via First Street. Map © Google.
Why this score? — see what drove the B- grade
The composite is a weighted blend of 9 inputs, each scored 0–100. Each bar is that input's sub-score; the figure is the points it added to the 100-point composite (weight × sub-score).
- Cash flow +30.0/30.0
- 1% rule +10.0/10.0
- DSCR +10.0/10.0
- Appreciation +5.0/10.0
- Condition / age +3.8/5.0
- Livability +3.7/5.0
- Rent growth +2.5/5.0
- Schools +1.3/10.0
- ARV discount +0.0/15.0
$84,900
🖨 Deal sheet 📄 Offer letter ✓ Due diligence
Listing remarks
This Detroit colonial delivers a fresh start from top to bottom. Updated exterior finishes and a clean, inviting front porch set the tone, while the fenced backyard adds privacy. Walk inside this open main level with updated floors in the living and dining room. Updated windows create a warm, comfortable feel throughout. The kitchen has been fully updated with newer cabinetry. Upstairs, you'll find four bedrooms, one of which is a walk-through. Each room is carpeted with a clean, move-in-ready feel. The home includes one full bath and one half bath, both updated with modern fixtures and finishes. The basement offers additional usable space, ready for finishing or storage. Mechanical systems
Key facts
- 3,484 sq ft lot
- Built 1915
- Listed 25 days
Property features AI
Exterior
- Parking: No parking details provided
- Utilities: Public water; Natural gas; Electric service (implied); Public sewer (implied)
- Home design: Residential 2-story home built in 1915; Basement foundation; Frontage of approximately 30 feet
- Construction: Vinyl siding exterior; Basement foundation; Built in 1915
- Exterior features: Vinyl siding; Fenced yard; Front porch; Paved street access
Interior
- Kitchen: Kitchen on the entry level (approximately 12 x 14) with other-type flooring
- Bedrooms: Four bedrooms located on the second floor; carpeted; Bedroom sizes include 12 x 10, 10 x 11, ~13 (width), and 12 x 10
- Flooring: Carpet in bedrooms and family room; Ceramic tile in bathrooms; Other-type flooring in living room, dining room and kitchen
- Bathrooms: Two total bathrooms (one full, one lavatory); Main bathroom on the second floor with ceramic flooring (approx. 8 x 5); Entry-level lavatory with ceramic flooring (approx. 8 x 6)
- Heating & cooling: Forced air heating; Central air conditioning; Gas water heater; Natural gas heat fuel
- Interior features: Total of 11 rooms; Unfinished basement
- Laundry & utility: Basement provides utility space
Neighborhood map
What this means for you Summary
Snapshot
- This is a 4-bed/1.5-bath single-family listed at $85k. Condition is rated good.
Deal economics
- At list price, monthly cash flow is $533 ($6k/yr) — positive.
- The deal already cash-flows at list — no discount required.
- Meets the 1% rule at list price ($1k rent vs $85k).
- Recommended offer: $84k (1.5% below list) — sets the bar for market timing.
- Cap rate 13.8% vs local median 10.2% in Detroit — top-decile yield for the area; either an underpriced asset or a hidden risk that comps aren't pricing in. Stress-test before assuming the spread holds.
Location & tenants
- Location reads 73/100 on livability (#218 in MI) — a middle-class / working-renter tenant base. Strengths: amenities A+, commute A+, cost of living A+; Watch: schools F, crime F, employment F.
- Detroit Public Schools Community District (urban): math 10% / reading 24% proficiency, ranked #499 of 540 in MI (top 92%) — low school quality limits family demand, transient renter base, plan for 1-2y turnover; 90% free/reduced lunch — lower-income household profile, screen leases tightly.
- Market conditions: 1 active listings in the ZIP; 13 comparable units currently listed for rent nearby; rentals at typical pace (median 24d on market — plan ~3-4 weeks tenant-placement turnaround); 2,639 units permitted in Wayne County in 2024 (1,216 in 5+ unit buildings).
Forward outlook
- In year one you build about $3k of equity ($587 loan paydown + $3k appreciation (3.0% local appreciation)).
- Wayne County population projected at -17% by 2050 — secular population decline; favor cash flow + early exit over multi-decade hold.
- At projected returns (3.0% appreciation + 3.0% rent growth), your $24k cash investment doubles in ~3 years — after that, you're playing with house money.
- By year 10, paydown + projected appreciation supports a ~$30k cash-out refi (75% LTV) — recoverable capital for the next deal without selling this one.
Negotiation context
- It's been on market 25 days — a 2% lower offer ($84k) is reasonable based on typical stale-listing flexibility.
- 2 sale attempts with the ask held roughly flat each time — persistent listings suggest the price (not the market) is what's stuck; bring a comps-based counter.
Risks & watch-outs
- Watch-outs: built in 1915 — expect roof / HVAC / electrical / plumbing capex.
Questions for the listing agent
- Built in 1915 — when were the roof, HVAC, electrical panel, plumbing, and water heater last replaced?
- Is there a deadline driving the sale (1031 exchange, divorce, estate, relocation)? That informs how much negotiation room exists.
- Schools are F-rated, which usually means shorter tenancies and higher turnover. Who's the typical renter profile here, and what's been the actual vacancy rate?
- Crime grade is F in this area — have there been break-ins, vandalism, or insurance claims at this property in the last 3 years? What carrier currently insures it and at what premium?
- What's the average days-on-market for RENTAL listings here right now (not sales)? A rising rental-DOM trend means longer vacancies and softer asking-rent achievability than the comps imply.
- What's the recent tenant-quality profile in this submarket — average credit score on applications, eviction rate, late-payment / NSF rate, and stable-employment percentage? A property-management company in the area should have these aggregated.
- How much new for-sale + rental construction is in the pipeline within 1–3 miles? Heavy new supply typically softens prices + rents 12–24 months out; constrained supply supports both.
Investment metrics
- 1% rule
- 1.67% ✓
- Cap rate
- 13.83%
- Cash-on-cash
- 26.93%
- DSCR
- 2.20
- GRM
- 5.0
CMA / ARV
- ARV (on-the-fly)
- $67,012
- Comps found
- 12
Show comp detail 12 sales within ~0.75 mi
| Address | Dist | Beds/Ba | Sqft | Sold | Price | $/sf | Match |
|---|---|---|---|---|---|---|---|
| 5326 Belvidere St | 0.38mi | 4/1.5 | 1,469 (-4%) | 5mo | $82,500 | $56 | 72 |
| 5302 Crane St | 0.47mi | 5/2.0 (+1) | 1,423 (-7%) | 2mo | $107,000 | $75 | 58 |
| 5360 Burns St | 0.50mi | 4/1.0 | 1,664 (+9%) | 4mo | $60,000 | $36 | 56 |
| 5239 Crane St | 0.50mi | 3/1.0 (-1) | 1,404 (-8%) | 4mo | $24,500 | $17 | 53 |
| 5171 Burns St | 0.58mi | 3/1.0 (-1) | 1,425 (-6%) | 3mo | $20,000 | $14 | 53 |
| 5855 Hurlbut St | 0.29mi | 3/1.0 (-1) | 1,296 (-15%) | 5mo | $119,900 | $93 | 50 |
| 5950 Seminole St | 0.52mi | 4/1.0 | 1,424 (-6%) | 17mo | $101,000 | $71 | 49 |
| 5406 Iroquois St | 0.56mi | 4/1.0 | 1,371 (-10%) | 11mo | $80,000 | $58 | 46 |
| 8901 Isham Ave | 0.52mi | 3/1.0 (-1) | 1,380 (-9%) | 16mo | $35,000 | $25 | 39 |
| 5137 Saint Clair St | 0.65mi | 3/1.0 (-1) | 1,728 (+14%) | 3mo | $30,000 | $17 | 38 |
| 5113 Bewick St | 0.59mi | 3/2.0 (-1) | 1,368 (-10%) | 12mo | $60,000 | $44 | 38 |
| 9142 Isham Ave | 0.68mi | 3/1.0 (-1) | 1,420 (-7%) | 16mo | $38,000 | $27 | 37 |
Match score weights: distance 35% · size 25% · config 20% · recency 20%. Top-matched comps best support the ARV.
Projected returns pro-forma
3.0% appreciation · 3.0% rent growth · sell at horizon
- IRR
- 32.9%
- Equity multiple
- 2.86×
- Total profit
- $44,223
- Equity at exit
- $38,175
- IRR
- 33.2%
- Equity multiple
- 5.62×
- Total profit
- $109,860
- Equity at exit
- $58,832
Cash invested: $23,772 (down + closing). Projections, not guarantees.
Landlord ↔ Tenant lean methodology
- Overall (STATE)
- 62 Landlord-Friendly
- State Michigan
- 62 Landlord-Friendly · EVEN
- County
- — inherits STATE
- City
- — inherits STATE
ZIP-level market 48213 3057
- Active inventory
- 1
- Price-to-rent
- 5.0×
Monthly cashflow live
- Estimated rent
- $1,418 high interval (Pro) →
- Mortgage (P&I)
- −$445
- Tax est. 1.5%
- −$106 /mo · $1,274/yr
- Insurance
- −$35
- HOA
- −$0
- Vacancy / Maint / Mgmt
- −$298
- Net cashflow
- $533
Break-even live
UW: 25.0% down · 7.5% · 30yr · 1.5% tax · 5.0% vac · 8.0% maint · 8.0% mgmt
Financing live
Cash to close
- Down payment
- $21,225
- Closing costs
- $2,547
- Reserves months
- —
- Total cash needed
- —
Loan-product check · same deal, 3 products live
Conventional
25% down · 7.5% · 30yr
- Down + closing
- —
- Monthly P&I
- —
- Monthly cashflow
- —
- DSCR
- —
- Eligible?
- —
Personal DTI + credit; lowest rate.
DSCR
20% down · 8.5% · 30yr
- Down + closing
- —
- Monthly P&I
- —
- Monthly cashflow
- —
- DSCR
- —
- Eligible?
- —
No personal income docs; deal must DSCR.
Hard money
10% down · 12.0% · 12mo
- Down + closing
- —
- Monthly P&I
- —
- Monthly cashflow
- —
- DSCR
- —
- Eligible?
- —
Short-term bridge; refi at stabilization.
Rent comps 13 comps
| Address | Beds | Baths | Sqft | Rent | $/sqft | DOM | Units | Dist |
|---|---|---|---|---|---|---|---|---|
| 5342 Cooper St Detroit, MI | 3.0 | 1.0 | 1125 | $1,200 | $1.07 | 24d | 1 | 0.41mi |
| 9354 Bessemore St Detroit, MI | 3.0 | 1.0 | 1125 | $1,294 | $1.15 | 17d | 1 | 0.41mi |
| 5858 Seneca St Detroit, MI | 3.0 | 1.0 | 1348 | $999 | $0.74 | 17d | 1 | 0.44mi |
| 5045 Fairview St Detroit, MI | 3.0 | 1.0 | 1303 | $1,200 | $0.92 | 43d | 1 | 0.94mi |
| 8843 E Canfield St Detroit, MI | 4.0 | 2.0 | 1200 | $2,400 | $2.00 | 43d | 1 | 0.97mi |
| 4487 French Rd Detroit, MI | 4.0 | 2.0 | 1280 | $1,800 | $1.41 | 43d | 1 | 1.02mi |
| 8193 Traverse St Detroit, MI | 3.0 | 1.0 | 1055 | $1,382 | $1.31 | 17d | 1 | 1.03mi |
| 4811 Seyburn St Detroit, MI | 3.0 | 1.0 | 1196 | $1,037 | $0.87 | 17d | 1 | 1.05mi |
| 4667 Beniteau St Detroit, MI | 5.0 | 2.0 | 1396 | $1,700 | $1.22 | 43d | 1 | 1.10mi |
| 4169 Burns St Detroit, MI | 4.0 | 2.5 | 1326 | $2,300 | $1.73 | 24d | 1 | 1.13mi |
| 11171 Charlemagne Ave Unit A Detroit, MI | 3.0 | 1.0 | 1598 | $1,200 | $0.75 | 43d | 1 | 1.41mi |
| 11806 Wilshire Dr Detroit, MI | 4.0 | 3.0 | 2000 | $1,600 | $0.80 | 24d | 1 | 1.42mi |
| 8205 E Outer Dr Detroit, MI | 3.0 | 1.5 | 1874 | $1,400 | $0.75 | 17d | 1 | 1.46mi |
Listing history 2 events
-
2026-06-17remarks 699-char remark
-
2026-06-17$84,900 Pending 25 DOM
ⓘ Source: listings_history table (triggers on properties + properties_extension) + one-shot
backfill from property_details.listing_events for pre-trigger history.
Climate risk First Street
- Flood 1/10 Low FEMA zone X (unshaded) · 0% chance over 30 yrs
- Wildfire 1/10 Low
- Heat 3/10 Moderate 7 d/yr ≥96°F today · 15 d/yr by 30 yrs out
- Wind 2/10 Low
- Air quality 3/10 Moderate 2 unhealthy d/yr today · 5 by 30 yrs out
Nearby sold comps map
Loading sold comps map…
Walkable amenities ~0.75 mi
Loading nearby amenities…
Taxation est. · year 1
- Rental income
- $17,015
- − Mortgage interest
- −$4,756
- − Property taxes
- −$1,274
- − Insurance
- −$424
- − Repairs & maintenance
- −$1,361
- − Management
- −$1,361
- − Depreciation
- −$2,470
- Taxable income
- $5,369
- Est. tax owed @ 24.0%
- −$1,289
- After-tax cash flow
- $5,113/yr
For passive investors: Depreciation is non-cash, so a rental often shows a tax loss while cash-flowing — sheltering income. Rental losses are passive: they offset passive income freely, and up to $25,000/yr can offset ordinary (W-2) income if you actively participate and your MAGI is under $100k (phasing out to $0 by $150k); unused losses carry forward. On sale, claimed depreciation is recaptured at up to 25%, and gains may owe capital-gains tax (a 1031 exchange can defer both). Figures are a year-1 estimate at your 24.0% rate — not tax advice; consult a CPA.
Condition & rehab AI · 6 photos
This Detroit colonial is in good condition with updated interiors and exteriors, making it a solid investment opportunity.
Value-add opportunities
- Both Paint exterior trim — Enhances curb appeal and value
- Both Clean gutters — Improves drainage and property value
Renovation cost estimate screening
Value-add ROI direction
- Both Paint exterior trim — Enhances curb appeal and value ↑
- Both Clean gutters — Improves drainage and property value ↑
ⓘ Cost ranges are severity-bucket heuristics (US national rule-of-thumb). Get contractor quotes + a written scope before underwriting a rehab budget.
Schools (NCES district)
- District
- Detroit Public Schools Community District
- NCES district ID
- 2601103
- Math proficiency
- 10% ▼ -2.00%
- Reading proficiency
- 24% ▲ 6.00%
- Median HH income
- $25,815
- Composite
- 13.06/100
- National rank
- #9564
- State rank
- #499 of 540 in MI
Livability — Detroit
- Score
- 73/100
- State rank
- #218
- US rank
- #5427
Category grades
Schools grade is shown separately in the Schools card above.
Census & demographics
- Census place
- Detroit, MI
Population outlook (Wayne County) Hauer SSP2
- Today (2025)
- 1,675,273 people
- By 2030
- 1,620,300 · -3.3%
- By 2040
- 1,502,341 · -10.3%
- By 2050
- 1,384,039 · -17.4%
- By 2075
- 1,124,592 · -32.9%
- By 2100
- 881,193 · -47.4%
Not yet ingested
- Political lean
- —
- Race & ethnicity
- —
- Common origin
- —
- Civics
- —
Market trends
- HPI YoY
- —
- Current HPI
- —
- Rent YoY
- —
- Metro
- —
- State GDP YoY
- ▲ 1.37%
- F500 in state
- 28
Industry mix (Fortune 500 HQ in MI)
| Industry | F500 HQs | Revenue |
|---|---|---|
| Automotive Parts | 3 | $48B |
|
||
| Automotive | 2 | $372B |
|
||
| Chemicals | 1 | $45B |
|
||
| Automotive Retail | 1 | $29B |
|
||
| Healthcare / Medical Devices | 1 | $23B |
|
||
| Automotive Technology | 1 | $20B |
|
||
Price history
+0.0% since first listed5 events — show timeline
- 2026-06-17 Pending — MiRealSource-MiMLS
- 2026-06-06 Relisted — MiRealSource-MiMLS
- 2026-05-26 Contingent — MiRealSource-MiMLS
- 2026-05-23 Listed $84,900 MiRealSource-MiMLS
- 2026-05-20 Coming Soon $84,900 MiRealSource-MiMLS
Cash-flow waterfall
monthlySold comps — $/sqft
last 12 mo · ≤1 miLoading sold comps…