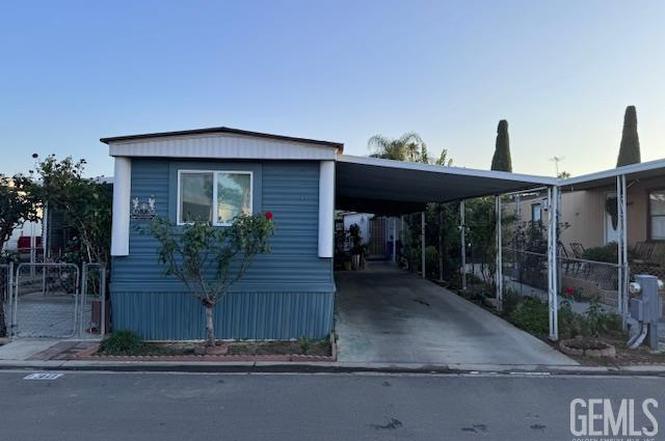
2042 Girard St #130 · Delano, CA
Flood risk 1/10 · Minimal
- FEMA flood zone
- X (unshaded)
- Chance of flooding over 30 yrs
- 0.0%
- Est. flood insurance / yr
- $507 – $1,088
Fire risk 5/10 · Moderate
- Est. fire insurance / yr
- $659 – $1,223
Heat risk 7/10 · Major
- Hot days now (above 106°F)
- 7 days/yr
- Hot days in 30 yrs
- 17 days/yr
Wind risk 1/10 · Minimal
- Chance of severe wind over 30 yrs
- —
Air-quality risk 10/10 · Severe
- Unhealthy air days now
- 30 days/yr
- Unhealthy air days in 30 yrs
- 34 days/yr
Risk factors via First Street. Map © Google.
Why this score? — see what drove the C grade
The composite is a weighted blend of 9 inputs, each scored 0–100. Each bar is that input's sub-score; the figure is the points it added to the 100-point composite (weight × sub-score).
- Cash flow +23.7/30.0
- 1% rule +10.0/10.0
- DSCR +7.6/10.0
- ARV discount +7.5/15.0
- Schools +3.4/10.0
- Rent growth +2.5/5.0
- Livability +2.5/5.0
- Condition / age +2.5/5.0
- Appreciation +0.0/10.0
$55,900
🖨 Deal sheet 📄 Offer letter ✓ Due diligence
Listing remarks
Welcome to this charming 2-bedroom, 2-bath mobile home nestled in Cypress Gardens! This cozy retreat offers comfortable living with a covered carport, two spacious storage sheds, and convenient laundry hookups. One bathroom has been thoughtfully converted into a large closet (unpermitted), creating additional storage and flexibility. With a warm, inviting feel throughout, this home is move-in ready and waiting for its next owner to make it their own.
Key facts
- Large closet
- Covered carport
- Laundry hookups
Tags
Property features AI
Finance
- Other: Owner occupant
- HOA & community: Cypress Gardens MHP homeowners association; HOA fee $895 monthly; Association clubhouse/recreation; Association pool
Exterior
- Parking: Carport
- Utilities: Public water; Sewer
- Home design: Mobile home (MH zoning); Owned space
- Construction: Other roof (see remarks); Other exterior material (see remarks)
- Exterior features: Covered patio; Accessory unit; Community pool
Interior
- Kitchen: Range/Oven
- Bathrooms: 2 full bathrooms
- Heating & cooling: Evaporative cooling
- Interior features: Great room; Breakfast area; Split wing floorplan; Range/Oven
Neighborhood map
What this means for you Summary
Snapshot
- This is a 2-bed/2.0-bath manufactured listed at $56k.
Deal economics
- At list price, monthly cash flow is $107 ($1k/yr) — positive.
- The deal already cash-flows at list — no discount required.
- Meets the 1% rule at list price ($2k rent vs $56k).
- Recommended offer: $49k (12.0% below list) — sets the bar for market timing.
- Cap rate 8.6% vs local median 3.2% in Delano — top-decile yield for the area; either an underpriced asset or a hidden risk that comps aren't pricing in. Stress-test before assuming the spread holds.
Location & tenants
- Location reads 50/100 on livability (#1,143 in CA) — a working-class tenant base; expect higher turnover. Strengths: housing A+; Watch: cost of living D, amenities F, commute F.
- Delano Union Elementary (suburban): math 32% / reading 43% proficiency, ranked #860 of 1,400 in CA (top 61%) — families likely to look elsewhere, expect single-tenant / working-renter base with shorter leases; 76% free/reduced lunch — lower-income household profile, screen leases tightly.
- Zoned schools: Terrace Elementary (442 students, 94% FRL) — zoned schools average 94% FRL vs 76% district-wide (19 pts higher); higher-poverty schools than district average — tighter screening recommended.
- Market conditions: 149 active listings in the ZIP; 8 comparable units currently listed for rent nearby; rentals leasing fast (median 3d on market — plan ~1-2 weeks tenant-placement turnaround); 3,244 units permitted in Kern County in 2024 (73 in 5+ unit buildings).
Forward outlook
- Local home prices are declining (-3.0%/yr); year-one equity from $386 of loan paydown is wiped out by about $2k of value loss. Plan a longer hold.
- Kern County population projected at +17% by 2050 — long-run rental-demand tailwind backs the buy-and-hold thesis.
Negotiation context
- It's been on market 196 days — a 12% lower offer ($49k) is reasonable based on typical stale-listing flexibility.
- 2 sale attempts; this cycle's ask has dropped $9k (14%) from the opening price — seller is motivated, your offer sets the floor, not the list.
Risks & watch-outs
- Watch-outs: HOA is 51% of rent.
- Climate carrying-cost: moderate wildfire risk; extreme-heat days projected 7→17/yr by 2055 (HVAC capex compounding) — expect insurance premiums to compound above CPI over the hold.
Questions for the listing agent
- It's been on market 196 days. Have you received any prior offers? Is the seller open to a 12% concession, seller financing, or rate buy-down credit?
- What does the HOA fee cover, when was the last increase, and are there any pending special assessments or reserve-fund shortfalls?
- Why hasn't it sold? Are there any deal-killer items the seller is aware of (foundation, flood, title, zoning, code violations)?
- Is there a deadline driving the sale (1031 exchange, divorce, estate, relocation)? That informs how much negotiation room exists.
- Schools are F-rated, which usually means shorter tenancies and higher turnover. Who's the typical renter profile here, and what's been the actual vacancy rate?
- What's the average days-on-market for RENTAL listings here right now (not sales)? A rising rental-DOM trend means longer vacancies and softer asking-rent achievability than the comps imply.
- What's the recent tenant-quality profile in this submarket — average credit score on applications, eviction rate, late-payment / NSF rate, and stable-employment percentage? A property-management company in the area should have these aggregated.
- How much new for-sale + rental construction is in the pipeline within 1–3 miles? Heavy new supply typically softens prices + rents 12–24 months out; constrained supply supports both.
Investment metrics
- 1% rule
- 3.14% ✓
- Cap rate
- 8.59%
- Cash-on-cash
- 8.19%
- DSCR
- 1.36
- GRM
- 2.7
CMA / ARV
No comps found within radius.
Projected returns pro-forma
-3.0% appreciation · 3.0% rent growth · sell at horizon
- IRR
- -2.8%
- Equity multiple
- 0.89×
- Total profit
- $-1,680
- Equity at exit
- $8,335
- IRR
- 7.8%
- Equity multiple
- 1.62×
- Total profit
- $9,638
- Equity at exit
- $4,833
Cash invested: $15,652 (down + closing). Projections, not guarantees.
Landlord ↔ Tenant lean methodology
- Overall (STATE)
- 18 Strongly Tenant-Friendly
- State California
- 18 Strongly Tenant-Friendly · D+13
- County
- — inherits STATE
- City
- — inherits STATE
ZIP-level market 93215
- Home prices YoY
- -15.4%
- Active inventory
- 149
- Price-to-rent
- 2.7×
Monthly cashflow live
- Estimated rent
- $1,757 high interval (Pro) →
- Mortgage (P&I)
- −$293
- Tax est. 1.5%
- −$70 /mo · $838/yr
- Insurance
- −$23
- HOA
- −$895
- Vacancy / Maint / Mgmt
- −$369
- Net cashflow
- $107
Break-even live
UW: 25.0% down · 7.5% · 30yr · 1.5% tax · 5.0% vac · 8.0% maint · 8.0% mgmt
Financing live
Cash to close
- Down payment
- $13,975
- Closing costs
- $1,677
- Reserves months
- —
- Total cash needed
- —
Loan-product check · same deal, 3 products live
Conventional
25% down · 7.5% · 30yr
- Down + closing
- —
- Monthly P&I
- —
- Monthly cashflow
- —
- DSCR
- —
- Eligible?
- —
Personal DTI + credit; lowest rate.
DSCR
20% down · 8.5% · 30yr
- Down + closing
- —
- Monthly P&I
- —
- Monthly cashflow
- —
- DSCR
- —
- Eligible?
- —
No personal income docs; deal must DSCR.
Hard money
10% down · 12.0% · 12mo
- Down + closing
- —
- Monthly P&I
- —
- Monthly cashflow
- —
- DSCR
- —
- Eligible?
- —
Short-term bridge; refi at stabilization.
Rent comps 8 comps
| Address | Beds | Baths | Sqft | Rent | $/sqft | DOM | Units | Dist |
|---|---|---|---|---|---|---|---|---|
| 420 20th Ave Unit F Delano, CA | 3.0 | 2.0 | 1100 | $1,900 | $1.73 | 2d | 1 | 0.38mi |
| 420 20th Ave Apt E Delano, CA | 2.0 | 1.0 | 990 | $1,650 | $1.67 | 43d | 1 | 0.38mi |
| 420 20th Ave Unit C Delano, CA | 3.0 | 2.0 | 1100 | $1,900 | $1.73 | 43d | 1 | 0.38mi |
| 2032 Norwalk St Delano, CA | 3.0 | 2.0 | 1040 | $2,100 | $2.02 | 2d | 1 | 0.42mi |
| 1736 Inyo St Apt D Delano, CA | 2.0 | 1.0 | 900 | $1,325 | $1.47 | 2d | 1 | 0.42mi |
| 1200 County Line Rd Delano, CA | 2.0 | 1.0 | 978 | $1,710 | $1.75 | 2d | 5 | 0.45mi |
| 1225 Lexington St Unit B Delano, CA | 3.0 | 2.0 | 983 | $1,700 | $1.73 | 2d | 1 | 0.86mi |
| 529 Main St Delano, CA | 3.0 | 1.0 | 920 | $1,850 | $2.01 | 10d | 1 | 1.48mi |
HOA detail
- Monthly dues
- $895 · $10,740/yr
Listing history 19 events
-
2026-06-18days on market $55,900 Active 196 DOM
-
2026-06-17days on market $55,900 Active 195 DOM
-
2026-06-16days on market $55,900 Active 194 DOM
-
2026-06-15days on market $55,900 Active 193 DOM
-
2026-06-14days on market $55,900 Active 191 DOM
-
2026-06-13days on market $55,900 Active 190 DOM
-
2026-06-10days on market $55,900 Active 188 DOM
-
2026-06-09days on market $55,900 Active 187 DOM
-
2026-06-08days on market $55,900 Active 186 DOM
-
2026-06-07days on market $55,900 Active 185 DOM
-
2026-06-05days on market $55,900 Active 182 DOM
-
2026-06-03days on market $55,900 Active 181 DOM
-
2026-06-03days on market $55,900 Active 180 DOM
-
2026-06-01days on market $55,900 Active 179 DOM
-
2026-05-31days on market $55,900 Active 178 DOM
-
2026-02-15status Active
-
2026-01-03status Pending
-
2025-12-02price $55,900
-
2025-10-21$65,000 Active
ⓘ Source: listings_history table (triggers on properties + properties_extension) + one-shot
backfill from property_details.listing_events for pre-trigger history.
Climate risk First Street
- Flood 1/10 Low FEMA zone X (unshaded) · 0% chance over 30 yrs
- Wildfire 5/10 Major
- Heat 7/10 Severe 7 d/yr ≥106°F today · 17 d/yr by 30 yrs out
- Wind 1/10 Low
- Air quality 10/10 Extreme 30 unhealthy d/yr today · 34 by 30 yrs out
Nearby sold comps map
Loading sold comps map…
Walkable amenities ~0.75 mi
Loading nearby amenities…
Taxation est. · year 1
- Rental income
- $21,085
- − Mortgage interest
- −$3,131
- − Property taxes
- −$838
- − Insurance
- −$280
- − Repairs & maintenance
- −$1,687
- − Management
- −$1,687
- − HOA
- −$10,740
- − Depreciation
- −$1,626
- Taxable income
- $1,096
- Est. tax owed @ 24.0%
- −$263
- After-tax cash flow
- $1,018/yr
For passive investors: Depreciation is non-cash, so a rental often shows a tax loss while cash-flowing — sheltering income. Rental losses are passive: they offset passive income freely, and up to $25,000/yr can offset ordinary (W-2) income if you actively participate and your MAGI is under $100k (phasing out to $0 by $150k); unused losses carry forward. On sale, claimed depreciation is recaptured at up to 25%, and gains may owe capital-gains tax (a 1031 exchange can defer both). Figures are a year-1 estimate at your 24.0% rate — not tax advice; consult a CPA.
Schools (NCES district)
- District
- Delano Union Elementary
- NCES district ID
- 0610890
- Math proficiency
- 32% ▲ 6.00%
- Reading proficiency
- 43% ▲ 4.00%
- Median HH income
- $36,893
- Composite
- 33.68/100
- National rank
- #10442
- State rank
- #860 of 1400 in CA
Livability — Delano
- Score
- 50/100
- State rank
- #1143
- US rank
- #25752
Category grades
Schools grade is shown separately in the Schools card above.
Census & demographics
- Census place
- Delano, CA
- Population (ZIP)
- 53,627
Population outlook (Kern County) Hauer SSP2
- Today (2025)
- 947,286 people
- By 2030
- 978,984 · +3.3%
- By 2040
- 1,045,018 · +10.3%
- By 2050
- 1,105,232 · +16.7%
- By 2075
- 1,229,538 · +29.8%
- By 2100
- 1,238,059 · +30.7%
Race, ethnicity, and origin ACS 2023
- Neighborhood character
- Predominantly Hispanic (77%)
- Race & ethnicity
- Hispanic / Latino 77% Two or more races 37% Asian 13% White 5% Black 4%
- Hispanic origin (detail)
- Mexican 73%
- Foreign-born
- 34% · Canada, Vietnam
- Languages at home
- 26% English-only · Spanish 64% Tagalog/Filipino 6% Other Asian/Pacific 3%
Political lean MEDSL · Kern
- 2024 margin
- Strong R (+21.1) · D 38.2% · R 59.3% · Other 2.5%
- 2008→2024 swing
- -3.3pp toward R · 2008: -17.8pp · 2024: -21.1pp
- All cycles
- 2024: R+21.1 2020: R+10.2 2016: R+15.0 2012: R+20.9 2008: R+17.8
Not yet ingested
- Civics
- —
Market trends
- HPI YoY
- ▼ -70.32%
- Current HPI
- 385.3136
- Rent YoY
- —
- Metro
- —
- State GDP YoY
- ▲ 3.21%
- F500 in state
- 116
Industry mix (Fortune 500 HQ in CA)
| Industry | F500 HQs | Revenue |
|---|---|---|
| Technology | 27 | $1,492B |
|
||
| Financial Services | 3 | $174B |
|
||
| Retail | 3 | $44B |
|
||
| Insurance | 3 | $26B |
|
||
| Media / Entertainment | 2 | $115B |
|
||
| Pharmaceuticals / Biotech | 2 | $62B |
|
||
Price history
-14.0% since first listed4 events — show timeline
- 2026-02-15 Relisted — GEMLS
- 2026-01-03 Pending — GEMLS
- 2025-12-02 Price Changed $55,900 GEMLS
- 2025-10-21 Listed $65,000 GEMLS
Property tax history
+4.1%/yrLatest (2025): $73 · +11.6% YoY. Source: county tax records.
Cash-flow waterfall
monthlySold comps — $/sqft
last 12 mo · ≤1 miLoading sold comps…