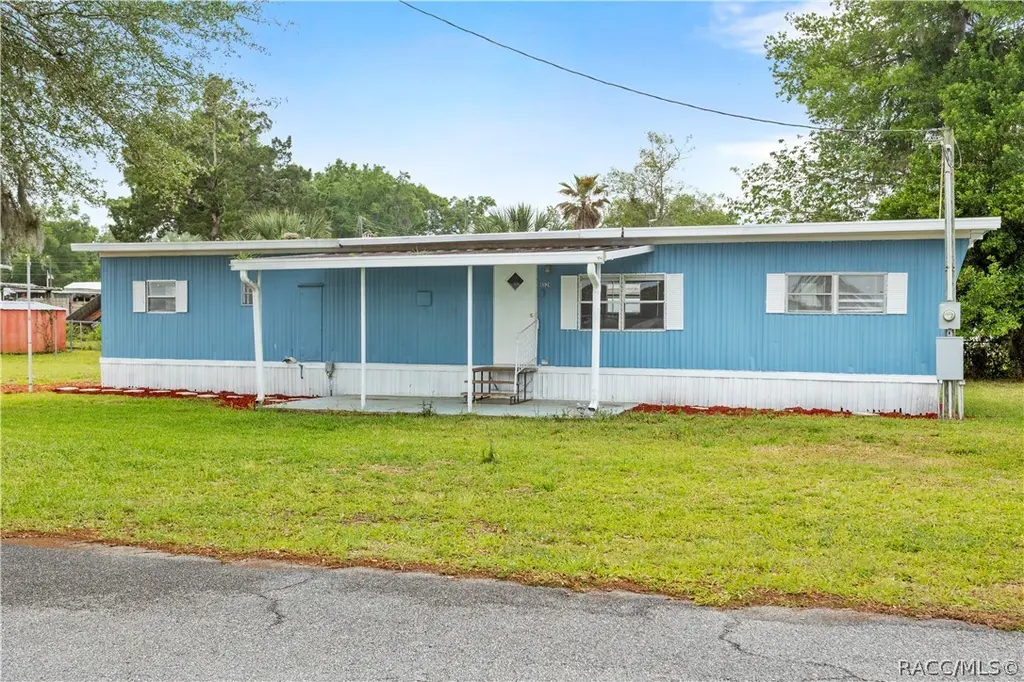
4524 N Canoe Ter · Hernando, FL
Flood risk 4/10 · Minor
- FEMA flood zone
- X (unshaded)
- Chance of flooding over 30 yrs
- 0.24%
- Est. flood insurance / yr
- $507 – $1,088
Fire risk 5/10 · Moderate
- Est. fire insurance / yr
- $947 – $1,759
Heat risk 9/10 · Severe
- Hot days now (above 108°F)
- 7 days/yr
- Hot days in 30 yrs
- 23 days/yr
Wind risk 9/10 · Severe
- Chance of severe wind over 30 yrs
- 99.0%
Air-quality risk 1/10 · Minimal
- Unhealthy air days now
- 0 days/yr
- Unhealthy air days in 30 yrs
- 0 days/yr
Risk factors via First Street. Map © Google.
Why this score? — see what drove the C+ grade
The composite is a weighted blend of 9 inputs, each scored 0–100. Each bar is that input's sub-score; the figure is the points it added to the 100-point composite (weight × sub-score).
- Cash flow +30.0/30.0
- DSCR +10.0/10.0
- 1% rule +8.7/10.0
- Schools +4.1/10.0
- Livability +3.6/5.0
- Rent growth +2.5/5.0
- Condition / age +2.5/5.0
- ARV discount +0.0/15.0
- Appreciation +0.0/10.0
$106,000
🖨 Deal sheet (PDF) 📄 Offer letter ✓ Due diligence
Listing remarks MLS
This Perfect Snowbird Getaway has 2 Bedrooms & 1.5 Bathrooms and comes Completely Furnished !!Features include a Roof Over w/ Gutters, Central Heat & Air, 10x18 Covered Front Porch, 12x21 Carport and 8x12 Shed w/ electric. Nice Double Lot.
Key facts
- Modernized kitchen
- Public boat ramps
- 6,978 sq ft lot
Tags
Property features AI
Finance
- Other: Located in Apache Shores Units 1-13 subdivision; Zoning: CL, CLMH
Exterior
- Parking: Unpaved parking
- Utilities: Private well water; Septic sewer
- Home design: Manufactured home (single wide); Residential property
- Construction: Metal roof
- Exterior features: Metal roof; Rectangular lot; Paved road access; Private well for water; Septic tank
Interior
- Kitchen: Electric cooktop, electric oven, electric range, refrigerator
- Bathrooms: 1 full bathroom; 1 half bathroom
- Interior features: Electric cooktop, electric oven, electric range, refrigerator; Central heating (electric); Central air conditioning
Neighborhood map
What this means for you Summary
Snapshot
- This is a 2-bed/2.0-bath manufactured listed at $106k.
Deal economics
- At list price, monthly cash flow is $469 ($6k/yr) — positive.
- The deal already cash-flows at list — no discount required.
- Meets the 1% rule at list price ($1k rent vs $106k).
- Recommended offer: $100k (6.0% below list) — sets the bar for market timing.
- Cap rate 11.6% vs local median 5.6% in Hernando — top-decile yield for the area; either an underpriced asset or a hidden risk that comps aren't pricing in. Stress-test before assuming the spread holds.
Location & tenants
- Location reads 71/100 on livability (#402 in FL) — a middle-class / working-renter tenant base. Strengths: cost of living A+, housing A+, health & safety A+; Watch: amenities F, commute F, employment D-.
- Citrus (rural): math 49% / reading 50% proficiency, ranked #44 of 73 in FL (top 60%) — families likely to look elsewhere, expect single-tenant / working-renter base with shorter leases.
- Zoned schools: Citrus Springs Elementary School (math 52% / reading 48%, grade D+, #1,070 of 2,144 statewide, top 51%, 817 students, 71% FRL); Citrus Springs Middle School (math 55% / reading 54%, grade B-, #183 of 571 statewide, top 34%, 821 students, 59% FRL).
- Market conditions: 444 active listings in the ZIP; 2,443 units permitted in Citrus County in 2024 (0 in 5+ unit buildings).
- This rent runs 30% of the median local income ($57k/yr) — at the standard rent-burdened threshold; future hikes will face affordability resistance.
Forward outlook
- Local home prices are declining (-3.0%/yr); year-one equity from $733 of loan paydown is wiped out by about $3k of value loss. Plan a longer hold.
- Citrus County population projected to shrink 10% by 2050 — rents likely to lag national; underwrite the cash flow, not the appreciation.
- At projected returns (-3.0% appreciation + 3.0% rent growth), your $30k cash investment doubles in ~7 years — after that, you're playing with house money.
Negotiation context
- It's been on market 70 days — a 6% lower offer ($100k) is reasonable based on typical stale-listing flexibility.
- 3 sale attempts since 20y ago with the ask held roughly flat each time — persistent listings suggest the price (not the market) is what's stuck; bring a comps-based counter.
- Current owner paid $60k; list at $106k implies a 77% gain — meaningful room to come down on a strong offer.
Risks & watch-outs
- Climate carrying-cost: severe wind risk, 99% chance of damaging wind over 30y; moderate wildfire risk; extreme-heat days projected 7→23/yr by 2055 (HVAC capex compounding) — expect insurance premiums to compound above CPI over the hold.
Questions for the listing agent
- It's been on market 70 days. Have you received any prior offers? Is the seller open to a 6% concession, seller financing, or rate buy-down credit?
- Built in 1971 — when were the roof, HVAC, electrical panel, plumbing, and water heater last replaced?
- Why hasn't it sold? Are there any deal-killer items the seller is aware of (foundation, flood, title, zoning, code violations)?
- Is there a deadline driving the sale (1031 exchange, divorce, estate, relocation)? That informs how much negotiation room exists.
- What's the average days-on-market for RENTAL listings here right now (not sales)? A rising rental-DOM trend means longer vacancies and softer asking-rent achievability than the comps imply.
- What's the recent tenant-quality profile in this submarket — average credit score on applications, eviction rate, late-payment / NSF rate, and stable-employment percentage? A property-management company in the area should have these aggregated.
- How much new for-sale + rental construction is in the pipeline within 1–3 miles? Heavy new supply typically softens prices + rents 12–24 months out; constrained supply supports both.
Investment metrics
- 1% rule
- 1.37% ✓
- Cap rate
- 11.61%
- Cash-on-cash
- 18.98%
- DSCR
- 1.84
- GRM
- 6.1
CMA / ARV
- ARV (on-the-fly)
- $79,968
- Comps found
- 4
Show comp detail 4 sales within ~0.75 mi
| Address | Dist | Beds/Ba | Sqft | Sold | Price | $/sf | Match |
|---|---|---|---|---|---|---|---|
| 3513 E Buffalo Ln | 0.19mi | 2/1.0 | 672 (0%) | 0mo | $80,000 | $119 | 87 |
| 3560 E Squaw Valley Dr | 0.07mi | 2/1.0 | 644 (-4%) | 11mo | $122,000 | $189 | 76 |
| 4794 N Apache Trl | 0.29mi | 2/1.0 | 762 (+13%) | 1mo | $85,000 | $112 | 59 |
| 2948 E Blackberry Ln | 0.64mi | 2/1.0 | 616 (-8%) | 14mo | $70,000 | $114 | 40 |
Match score weights: distance 35% · size 25% · config 20% · recency 20%. Top-matched comps best support the ARV.
Projected returns pro-forma
-3.0% appreciation · 3.0% rent growth · sell at horizon
- IRR
- 10.8%
- Equity multiple
- 1.43×
- Total profit
- $12,701
- Equity at exit
- $15,805
- IRR
- 19.9%
- Equity multiple
- 2.67×
- Total profit
- $49,496
- Equity at exit
- $9,165
Cash invested: $29,680 (down + closing). Projections, not guarantees.
Landlord ↔ Tenant lean methodology
- Overall (STATE)
- 87 Strongly Landlord-Friendly
- State Florida
- 87 Strongly Landlord-Friendly · R+3
- County
- — inherits STATE
- City
- — inherits STATE
ZIP-level market 34442
- Home prices YoY
- -21.9%
- Active inventory
- 444
- Price-to-rent
- 6.1×
Monthly cashflow live
- Estimated rent
- $1,449 medium interval (Pro) →
- Mortgage (P&I)
- −$556
- Tax from tax record
- −$75 /mo · $903/yr
- Insurance
- −$44
- HOA
- −$0
- Vacancy / Maint / Mgmt
- −$304
- Net cashflow
- $469
Break-even live
Sensitivity live
| Price | -10% $529 | -5% $499 | +0% $469 | +5% $439 | +10% $409 |
|---|---|---|---|---|---|
| Rent | -10% $355 | -5% $412 | +0% $469 | +5% $527 | +10% $584 |
| Rate | -1.0pp $523 | -0.5pp $496 | base $469 | +0.5pp $442 | +1.0pp $414 |
UW: 25.0% down · 7.5% · 30yr · 1.5% tax · 5.0% vac · 8.0% maint · 8.0% mgmt
Financing live
Cash to close
- Down payment
- $26,500
- Closing costs
- $3,180
- Reserves months
- —
- Total cash needed
- —
Loan-product check · same deal, 3 products live
Conventional
25% down · 7.5% · 30yr
- Down + closing
- —
- Monthly P&I
- —
- Monthly cashflow
- —
- DSCR
- —
- Eligible?
- —
Personal DTI + credit; lowest rate.
DSCR
20% down · 8.5% · 30yr
- Down + closing
- —
- Monthly P&I
- —
- Monthly cashflow
- —
- DSCR
- —
- Eligible?
- —
No personal income docs; deal must DSCR.
Hard money
10% down · 12.0% · 12mo
- Down + closing
- —
- Monthly P&I
- —
- Monthly cashflow
- —
- DSCR
- —
- Eligible?
- —
Short-term bridge; refi at stabilization.
Listing history 27 events
-
2026-06-19days on market $106,000 Active 70 DOM
-
2026-06-18days on market $106,000 Active 69 DOM
-
2026-06-17days on market $106,000 Active 68 DOM
-
2026-06-16days on market $106,000 Active 67 DOM
-
2026-06-15days on market $106,000 Active 66 DOM
-
2026-06-14days on market $106,000 Active 64 DOM
-
2026-06-13days on market $106,000 Active 63 DOM
-
2026-06-09days on market $106,000 Active 60 DOM
-
2026-06-08days on market $106,000 Active 59 DOM
-
2026-06-07days on market $106,000 Active 58 DOM
-
2026-06-03days on market $106,000 Active 54 DOM
-
2026-06-02days on market $106,000 Active 53 DOM
-
2026-06-01days on market $106,000 Active 52 DOM
-
2026-05-31days on market $106,000 Active 51 DOM
-
2026-05-30days on market $106,000 Active 50 DOM
-
2026-05-12price $106,000
-
2026-04-10$111,000 Active
-
2022-05-31soldstatus $60,000
-
2021-07-02soldstatus $45,500
-
2007-05-14soldstatus $38,000 251-char remark
Show marketing remark (251 chars)
This Perfect Snowbird Getaway has 2 Bedrooms & 1.5 Bathrooms and comes Completely Furnished !!Features include a Roof Over w/ Gutters, Central Heat & Air, 10x18 Covered Front Porch, 12x21 Carport and 8x12 Shed w/ electric. Nice Double Lot.
-
2007-03-10$39,900 251-char remark
Show marketing remark (251 chars)
This Perfect Snowbird Getaway has 2 Bedrooms & 1.5 Bathrooms and comes Completely Furnished !!Features include a Roof Over w/ Gutters, Central Heat & Air, 10x18 Covered Front Porch, 12x21 Carport and 8x12 Shed w/ electric. Nice Double Lot.
-
2006-05-24soldstatus $33,900 223-char remark
Show marketing remark (223 chars)
Neat and clean, brand new refrigerator and range, carpet shampoed, ceiling fans, split floor plan, 1/2 bath in master bedroom, on double lot with nice shade trees. Washer and dryer hook-up in shed. A must see at this price.
-
2006-03-23$34,900 223-char remark
Show marketing remark (223 chars)
Neat and clean, brand new refrigerator and range, carpet shampoed, ceiling fans, split floor plan, 1/2 bath in master bedroom, on double lot with nice shade trees. Washer and dryer hook-up in shed. A must see at this price.
-
2004-07-22soldstatus $13,500
-
1997-12-01soldstatus $10,000
-
1992-03-01soldstatus $17,000
-
1983-02-01soldstatus $13,900
ⓘ Source: listings_history table (triggers on properties + properties_extension) + one-shot
backfill from property_details.listing_events for pre-trigger history.
Tax reassessment forecast FL · Resets to sale price
- Current annual tax
- $903 · $75/mo
- Projected year-2 tax
- $903 · $75/mo
- Expected delta
- $0/yr ($0/mo · -0.0%)
ⓘ Screening estimate from a state-policy table — verify with the county assessor before closing.
Climate risk First Street
- Flood 4/10 Moderate FEMA zone X (unshaded) · 24% chance over 30 yrs
- Wildfire 5/10 Major
- Heat 9/10 Extreme 7 d/yr ≥108°F today · 23 d/yr by 30 yrs out
- Wind 9/10 Extreme 99% chance of damaging wind over 30 yrs
- Air quality 1/10 Low 0 unhealthy d/yr today · 0 by 30 yrs out
Nearby sold comps map
Loading sold comps map…
Walkable amenities ~0.75 mi
Loading nearby amenities…
Taxation est. · year 1
- Rental income
- $17,386
- − Mortgage interest
- −$5,938
- − Property taxes
- −$903
- − Insurance
- −$530
- − Repairs & maintenance
- −$1,391
- − Management
- −$1,391
- − Depreciation
- −$3,084
- Taxable income
- $4,150
- Est. tax owed @ 24.0%
- −$996
- After-tax cash flow
- $4,636/yr
For passive investors: Depreciation is non-cash, so a rental often shows a tax loss while cash-flowing — sheltering income. Rental losses are passive: they offset passive income freely, and up to $25,000/yr can offset ordinary (W-2) income if you actively participate and your MAGI is under $100k (phasing out to $0 by $150k); unused losses carry forward. On sale, claimed depreciation is recaptured at up to 25%, and gains may owe capital-gains tax (a 1031 exchange can defer both). Figures are a year-1 estimate at your 24.0% rate — not tax advice; consult a CPA.
Schools (NCES district)
- District
- Citrus
- NCES district ID
- 1200270
- Math proficiency
- 49% ▼ -10.00%
- Reading proficiency
- 50% ▼ -6.00%
- Median HH income
- $38,618
- Composite
- 41.28/100
- National rank
- #3519
- State rank
- #44 of 73 in FL
Livability — Hernando
- Score
- 71/100
- State rank
- #402
- US rank
- #7137
Category grades
Schools grade is shown separately in the Schools card above.
Census & demographics
- Census place
- Hernando, FL
- County
- Citrus County · 111,314 people
- City population
- 17,281
- Metro
- Homosassa Springs, FL
- Population (ZIP)
- 17,281
- Household income
- $57,259
- Rent vs Own
- Severe rent burden
- 314.0
Population outlook (Citrus County) Hauer SSP2
- Today (2025)
- 138,622 people
- By 2030
- 136,886 · -1.3%
- By 2040
- 132,009 · -4.8%
- By 2050
- 125,196 · -9.7%
- By 2075
- 108,570 · -21.7%
- By 2100
- 84,454 · -39.1%
Race, ethnicity, and origin ACS 2023
- Neighborhood character
- Predominantly White (90%)
- Race & ethnicity
- White 90% Hispanic / Latino 4% Two or more races 3% Asian 2% Black 2%
- Common ancestry
- Romanian 4% Slovak 4% Lithuanian 3%
- Foreign-born
- 8% · Canada, China, South Korea
- Languages at home
- 93% English-only · Spanish 3% German/W. Germanic 2% Tagalog/Filipino 1%
Political lean MEDSL · Citrus
- 2024 margin
- Solid R (+45.9) · D 26.8% · R 72.6%
- 2008→2024 swing
- -29.8pp toward R · 2008: -16.1pp · 2024: -45.9pp
- All cycles
- 2024: R+45.9 2020: R+41.0 2016: R+39.7 2012: R+21.9 2008: R+16.1
Not yet ingested
- Civics
- —
Market trends
- HPI YoY
- ▼ -76.70%
- Current HPI
- 273.3262
- Rent YoY
- —
- Metro
- Homosassa Springs, FL
- State GDP YoY
- ▲ 3.28%
- F500 in state
- 36
Industry mix (Fortune 500 HQ in FL)
| Industry | F500 HQs | Revenue |
|---|---|---|
| Industrial Technology | 2 | $29B |
|
||
| Insurance | 2 | $17B |
|
||
| Retail | 1 | $60B |
|
||
| Technology Distribution | 1 | $58B |
|
||
| Homebuilding | 1 | $35B |
|
||
| Technology Manufacturing | 1 | $35B |
|
||
Price history
+662.6% since first listed12 events — show timeline
- 2026-05-12 Price Changed $106,000 RACC
- 2026-04-10 Listed $111,000 RACC
- 2022-05-31 Sold (Public Records) $60,000 Public Records
- 2021-07-02 Sold (Public Records) $45,500 Public Records
- 2007-05-14 Sold (MLS) $38,000 RACC
- 2007-03-10 Listed $39,900 RACC
- 2006-05-24 Sold (MLS) $33,900 RACC
- 2006-03-23 Listed $34,900 RACC
- 2004-07-22 Sold (Public Records) $13,500 Public Records
- 1997-12-01 Sold (Public Records) $10,000 Public Records
- 1992-03-01 Sold (Public Records) $17,000 Public Records
- 1983-02-01 Sold (Public Records) $13,900 Public Records
Property tax history
+25.5%/yrLatest (2025): $903 · +14.2% YoY. Source: county tax records.
Cash-flow waterfall
monthlySold comps — $/sqft
last 12 mo · ≤1 miLoading sold comps…